Share

State of Pensions 2025
Public pension funds will see a funded ratio improvement in 2025, despite persistent market volatility

- What is the State of Pensions in 2025?
- Trendline for Projecting the Future: Pension Assets Amid Global Market Instability
- Trend to Watch: Valuation Risk
- Examining Pension Debt: Causes of Unfunded Liabilities
- National Trends
- Looking to the Future
- Additional Resources
Read last year's state of pensions
What is the State of Pensions in 2025?
State and local retirement systems in America are still Fragile.
This an annual report on the financial status of state and local public pension systems, put into a historic context. State and local governments face a wide range of challenges in general – and some of the largest are growing and unpredictable pension costs. The scale and effects of these challenges are best understood by considering the multi-decade financial trends and funding policy decisions that have brought public sector retirement systems to this moment.
In April 2025, financial markets experienced a sudden and sharp decline, triggered by the Trump administration’s aggressive tariff proposals. For public pension funds, it was just another jarring market shock that wiped out hundreds of billions in asset values and threatened an already fragile system.
Like the Covid market crash of 2020 and multiple volatility shocks since then, state and local pension funds survived—but they haven’t thrived. Not only did the need to recover losses from April mean missed opportunities for growth, but the episode revealed how reliant public plans were on political events breaking in their favor to produce improved returns. State and local pension fund assets aren’t resilient as much they have been fortunate.
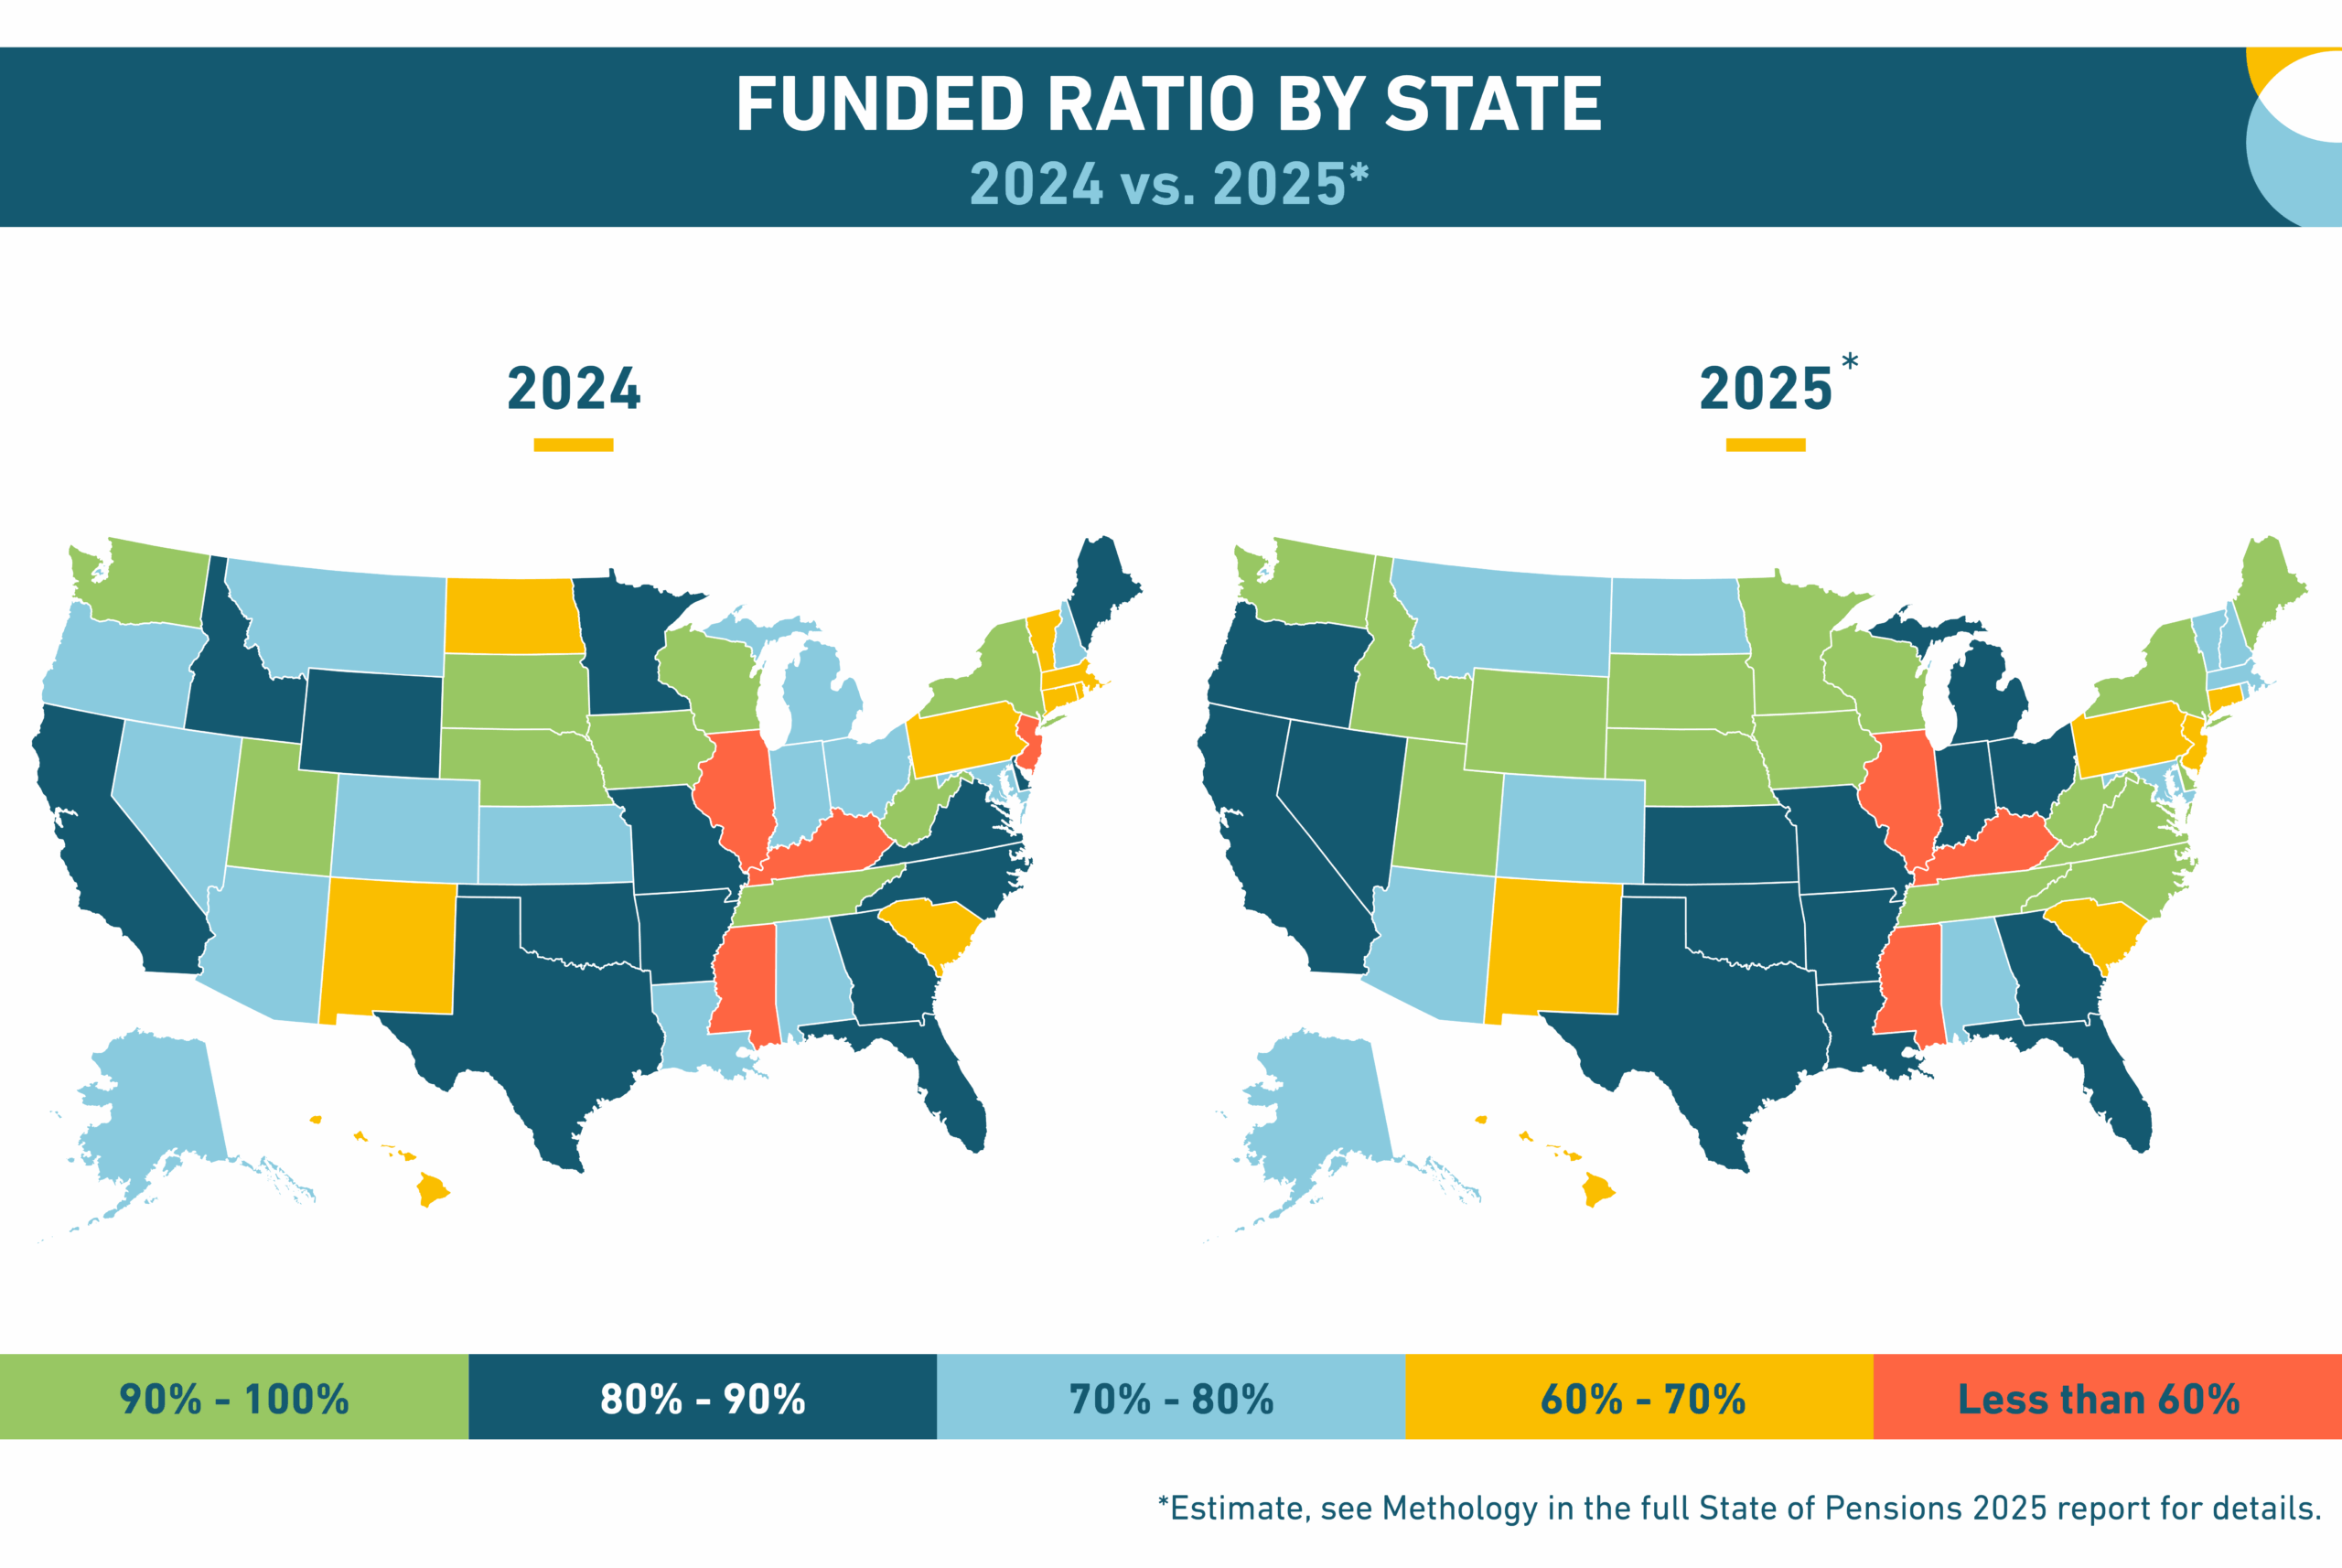
As of Q4, markets have recovered those losses and we estimate that the average 2025 investment return for state and local plans will be 9.5%—well above the 6.87% assumed rate of return. In 2025, the national average funded ratio will increase from 78.0% to 82.5% and total unfunded liabilities will decrease from $1.54 trillion to $1.27 trillion.
Looking forward, the long-term outlook for pension funds in 2025 and beyond will likely be shaped by rising contribution rates stemming from pension debt paralysis, increasing exposure to valuation risk, and ongoing financial market volatility.
- State and local plans are reporting an investment return average of 9.5%. This is above the average 6.87% assumed rate of return—which is the main target to hit each year in order to prevent further growth of unfunded liabilities.
- Funded status in 2025 has shown moderate improvement, increasing to 82.5%, up from 78.0% in 2024. We estimate unfunded liabilities will decline to $1.27 trillion, down from $1.54 trillion in 2024.
Positive Trends
- Funded Ratio: While increasing contribution rates are hard on government budgets, the payments into state and local pension funds have helped improve funded status. We project that the national averaged funded ratio will grow from 78.0% to 82.5%, while unfunded liabilities will decline from $1.5 trillion to $1.2 trillion in 2025
- Overperforming Investment Returns: We estimate the 2025 average investment return for all states combined — 9.5% — will underperform the average assumed return (6.87%). Returns have significantly rebounded from the asset losses in April’s tariff-triggered market meltdown not been recovered
- Interest on the Debt: The growing contributions have begun to stop the growth of interest on the debt (at least for now) as a contributing factor to cumulative national unfunded liabilities. Since this data is only available through 2023, we anticipate the larger contribution rates in 2024 and 2025 will contribute to reducing interest on the debt among the factors causing today’s unfunded liabilities.
- Paying the Bills: While a few states are still not paying 100% of required contributions, on net the country paid 100% for the last three years (2022-2024).
Negative Trends
- Contribution Rates: Contribution rates for state and local pension plans have reached another historic high, with government employers paying 31.65% of payroll on average across all 50 states and D.C.
- Valuation Risk: Due to a slight decline in the share of assets allocated to real estate over the last two years and a slight increase in fixed income as a share of allocations, the national average level of valuation has reduced slightly. However, the overall level of valuation risk remains elevated at 25%.
- Cash Flows: Negative cash flows keep expanding even as contribution rates from members and employers keep growing.
Trendline for Projecting the Future: Pension Assets Amid Global Market Instability
U.S. state and local pension funds have weathered multiple volatility shocks since 2020—the most recent caused by the Trump administration’s tariff announcement in April. Through these market downturns and rebounds, pension funds survived—but they haven’t thrived.
Not only does the need to continually recover losses mean missed opportunities for growth, but the volatility of the last few years has shown how reliant public plans are on political events breaking in their favor to produce improved returns. State and local pension fund assets aren’t resilient as much they have been fortunate.
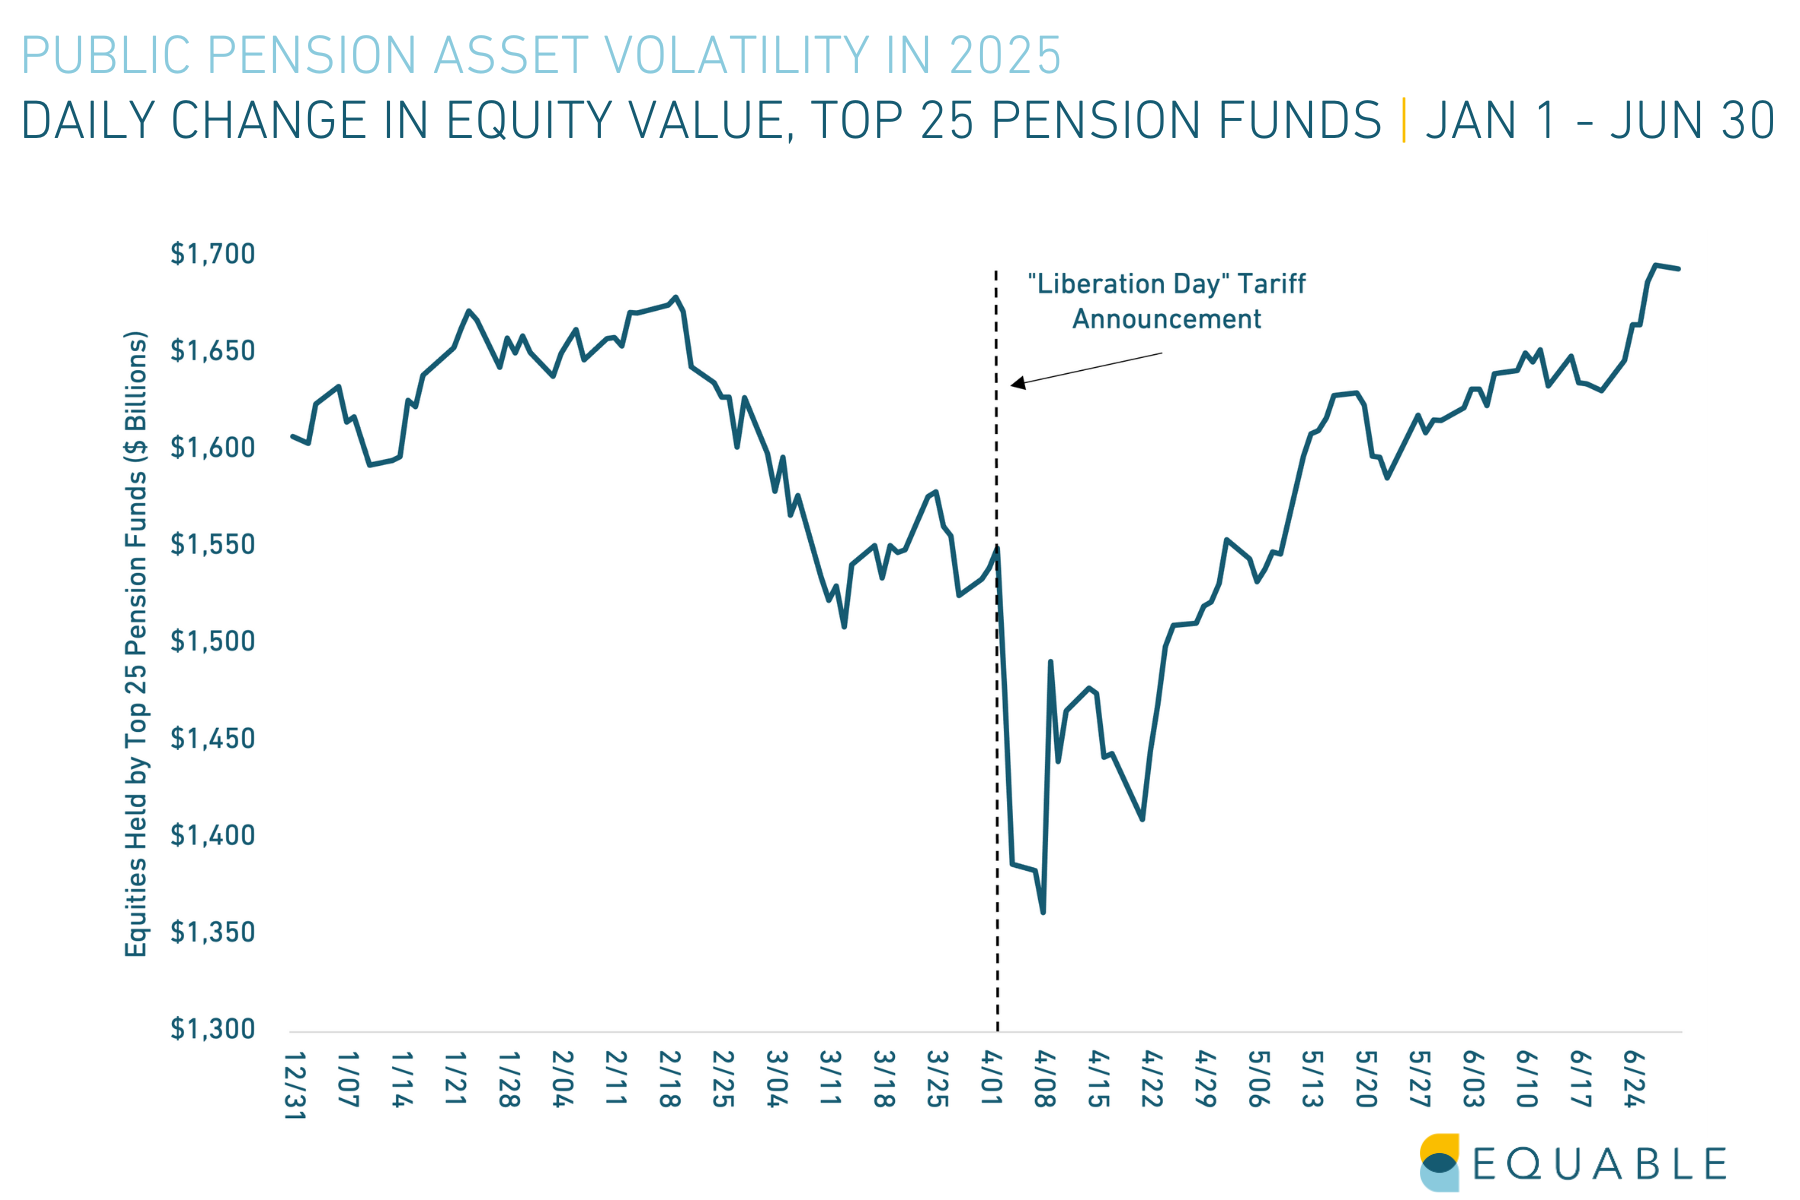
The below chart shows the estimated value of global equities held by the top 25 pension funds during the period from January 1 to June 30, 2025.
These 25 funds represent 63 pension funds, and manage 2/3rds of state and local pension fund assets.
As a proxy for how market volatility during 2025 has affected public pension assets, this provides a good directional sense of where total public plan asset values will have shifted.
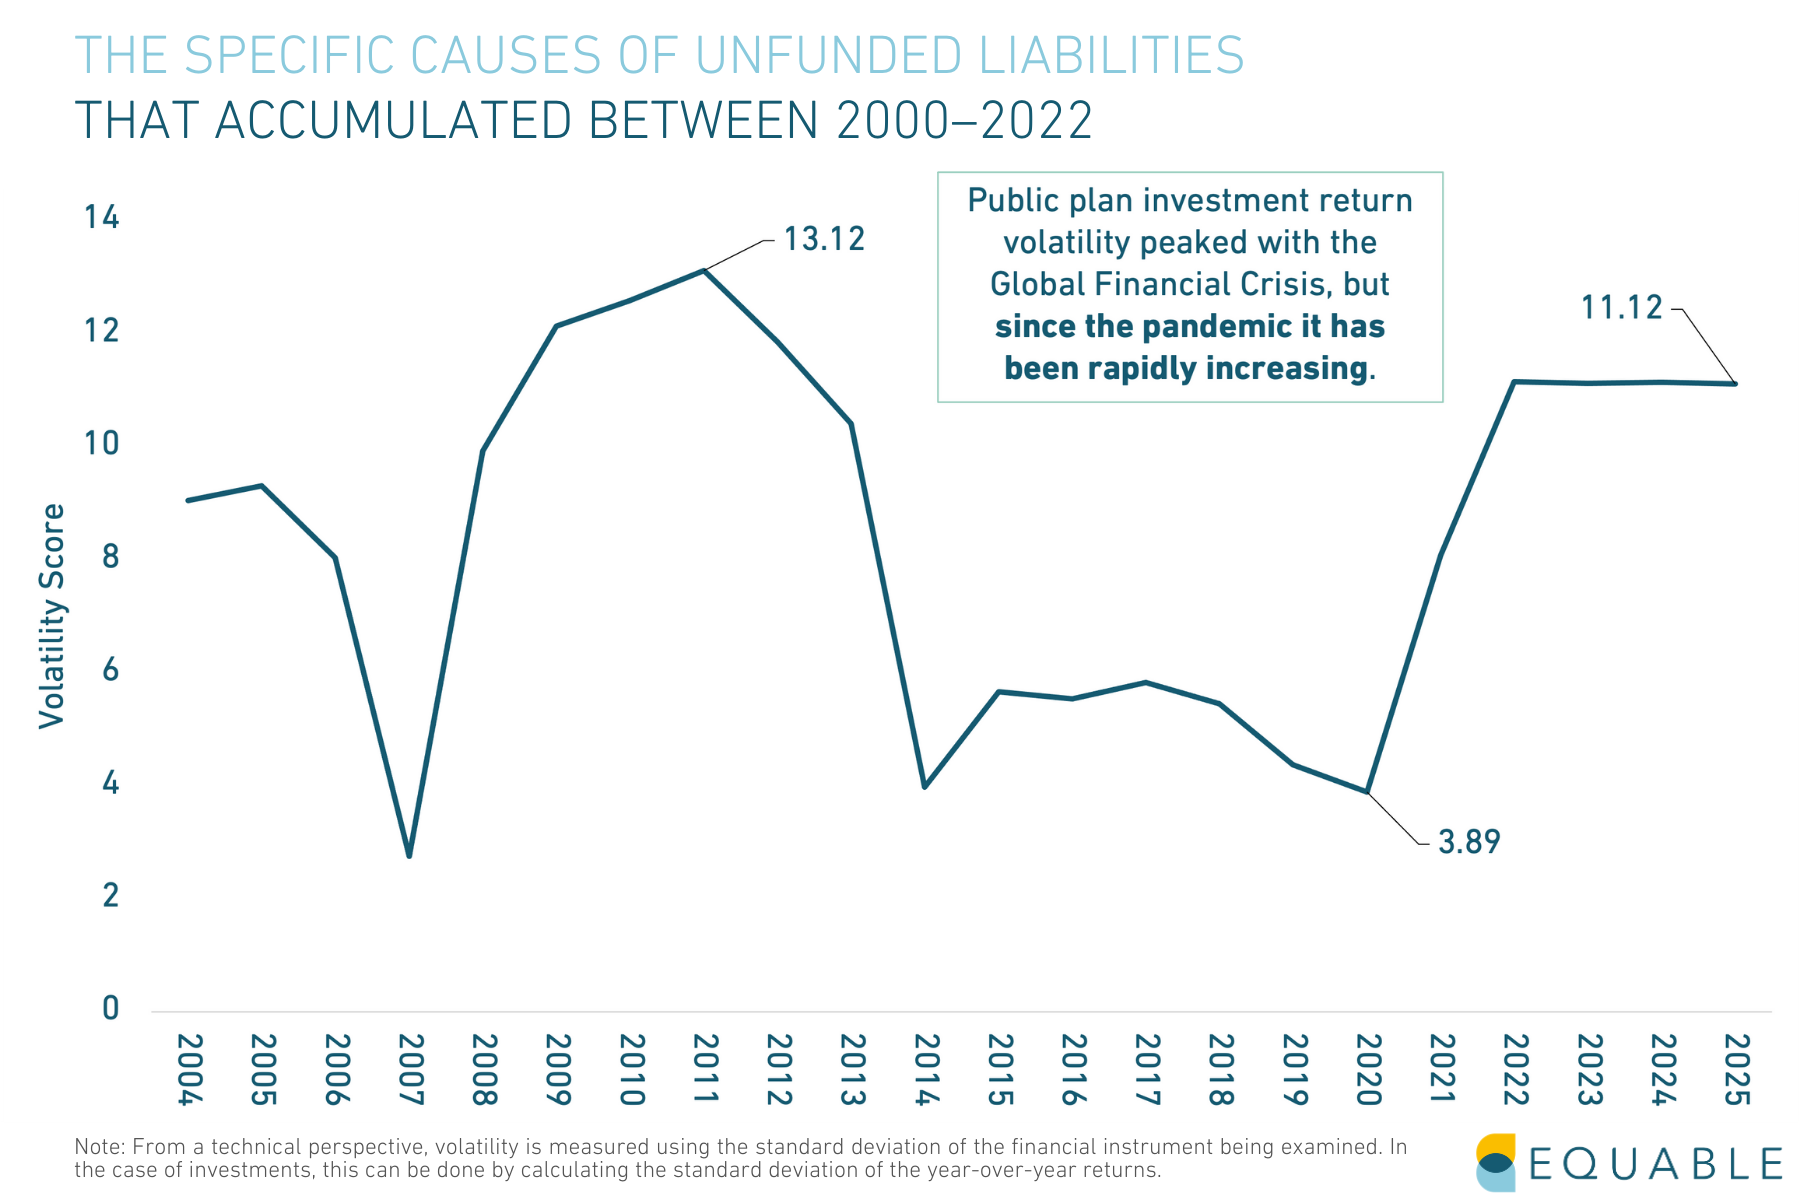
In finance, volatility is a measure uncertainty related to asset prices or investment returns.
Savvy investors can use volatility to their advantage, including some pension funds. However, generally pension funds prefer stability because investment returns are important for determining contribution rates and for managing cash flow with regular required benefit payments.
This figure shows a “volatility score” where the higher the number, the more uncertainty there is around investment return patterns and trends.
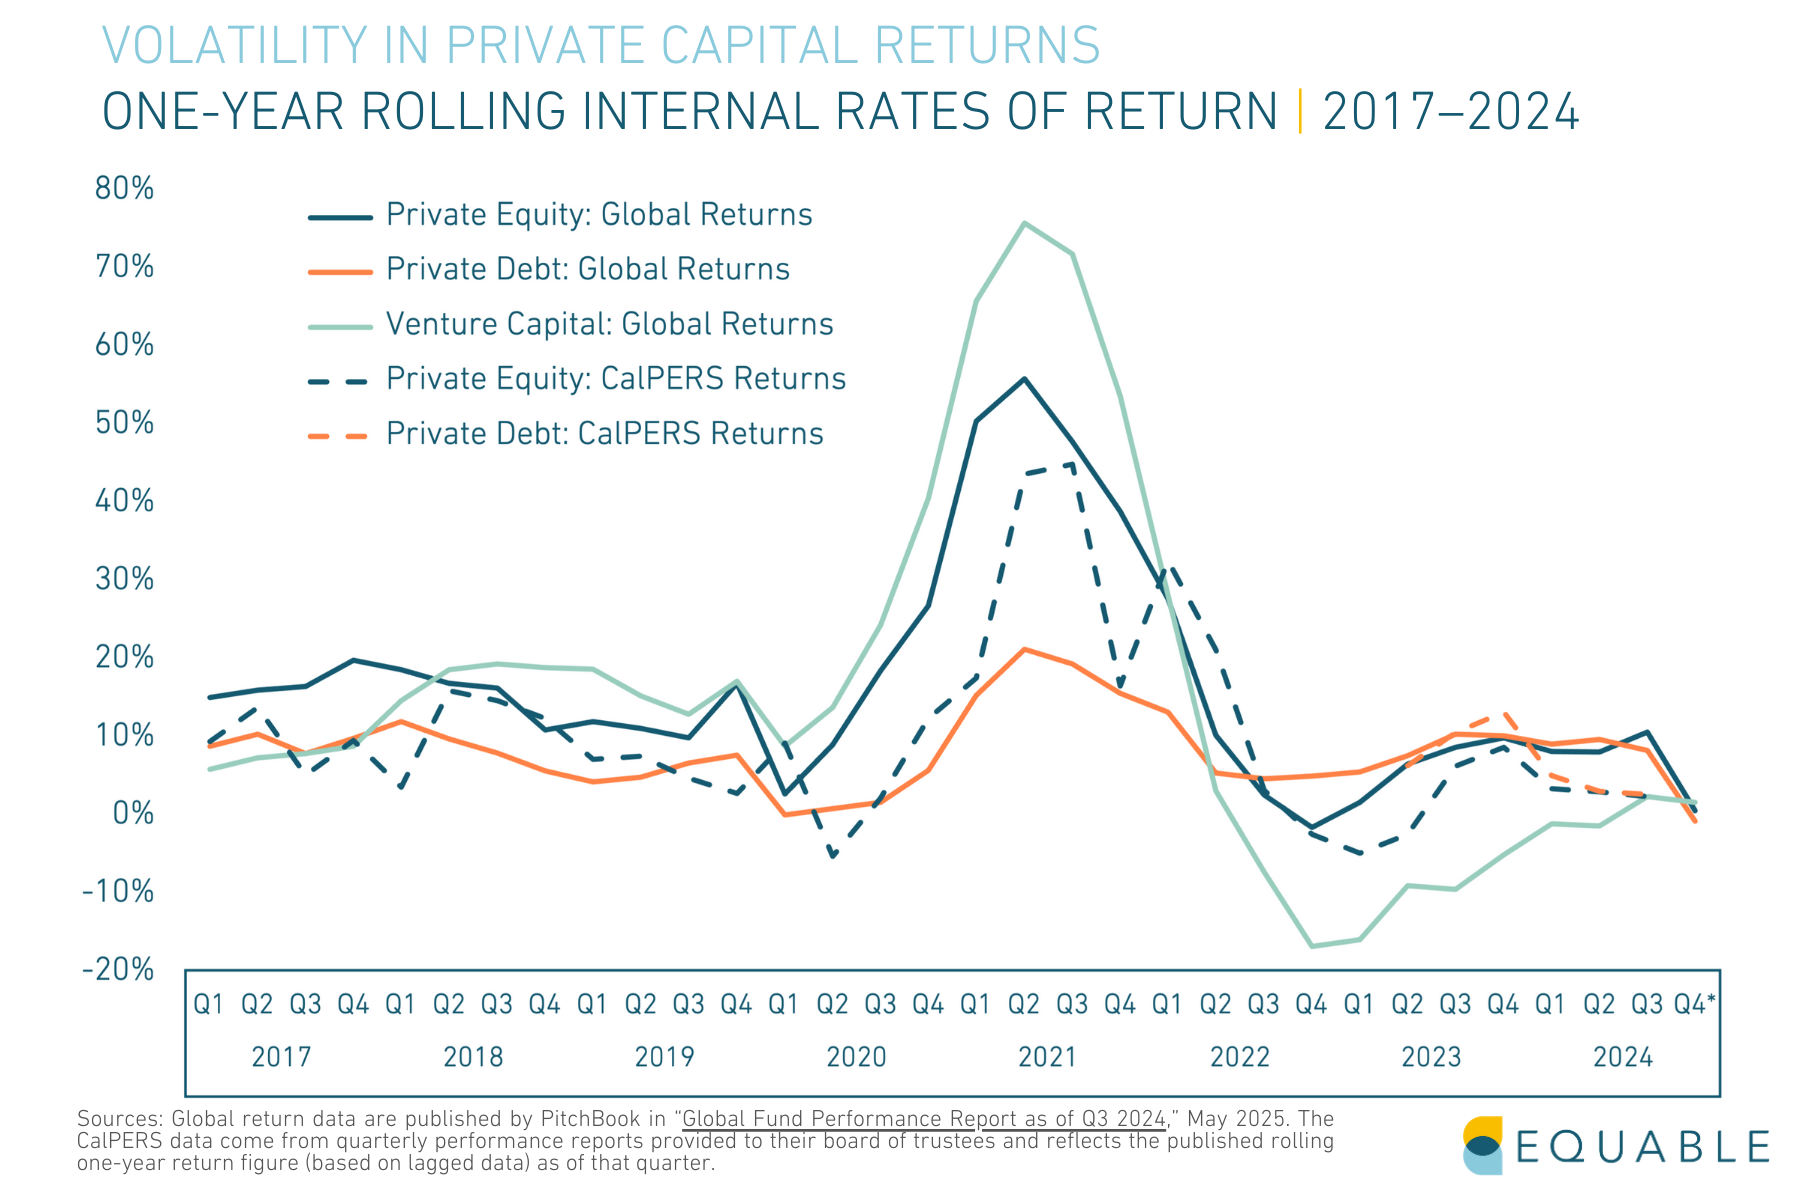
The performance of the largest public pension alternatives portfolio (CalPERS) largely tracks with global returns for varying private capital asset classes.
The following chart shows rolling one-year IRRs to account for the lagged reporting cycles that can muddy any given quarter’s measurement.
Returns in general show significant volatility, up dramatically in 2021, back down in 2022, and then leveling off in 2023 through 2024.
How the Trump Administration’s Economic Policy is Influencing Pension Asset Values
April’s tariff announcement and subsequent market shock showed how significantly economic policy impacts pension funds. Specifically, the current administration affects funds primarily in two key ways:
- Unpredictable Policy: Most market analysts did not anticipate the scope or scale of Liberation Day tariff policy pronouncements, as reflected in the general panic from investors that followed the April 2 declaration. Along with other investors, state and local pension funds lost hundreds of billions in assets in the month of April and there was little clarity early as to whether recovery would be likely in the near-term. Fortunately for pension fund asset values, the Trump administration backed off the most aggressive parts of their trade policies and state and local retirement systems fully recovered. It is important to emphasize, though, that state pension fund survival through April’s market low points was unrelated to any degree of diversification or trading strategy — virtually all asset classes fell together, and the market rebound was related to the Trump administration backing down from its tariff threats. Pension fund values are at the mercy of market swings and favorable political policy change.
- Uncertain Future: There is profound uncertainty about U.S. global economic policy in the coming years, with continuous signals from the White House that the Trump administration would tolerate downward pressure on the U.S. economy from adopting large and widespread tariffs on imported goods. The economic effects on businesses could translate both into depressed state tax revenues and reduced economic value, whether in publicly traded markets or the valuation of privately held companies who are negatively affected by tariffs.
Trend to Watch: Valuation Risk
There is a sharply increasing share of pension fund investments with values based on valuation-methods instead of market prices, which means an increasing share of pension portfolios are exposed to the risk of being overpriced.
What is Valuation Risk?
“Valuation Risk” is the risk to pension funds that the value of their assets as reported to them is inaccurate (e.g., understating or overstating the actual value) because the asset pricing method used is based on valuation models, as opposed to market-based prices.
If asset values are overstated today, then that means reported funding levels are overstated. This in turn can lead to lower than appropriate contribution rates, which will mean larger unfunded liabilities in the future than if assets were more accurately priced.
Overstated pension asset values can also lead to other policy decisions that could influence future funded status — such as raising the value of benefits or having lower political priority for supplemental funding to pay down unfunded liabilities faster than planned.
This is in contrast to “opportunity risk” (the risk that a specific use of capital doesn’t justify the risk-adjusted returns relative to other opportunities), or “asset risk” (the risk of losing money on an investment), or “management risk” (the risk that trustees will inefficiently allocate capital).
The share of pension fund assets priced based on valuations grew to 25.6% of assets as of 2024, up from an average of 9.1% between 2001–2007. This means the share of pension fund assets exposed to “valuation risk” has almost tripled since the Global Financial Crisis.
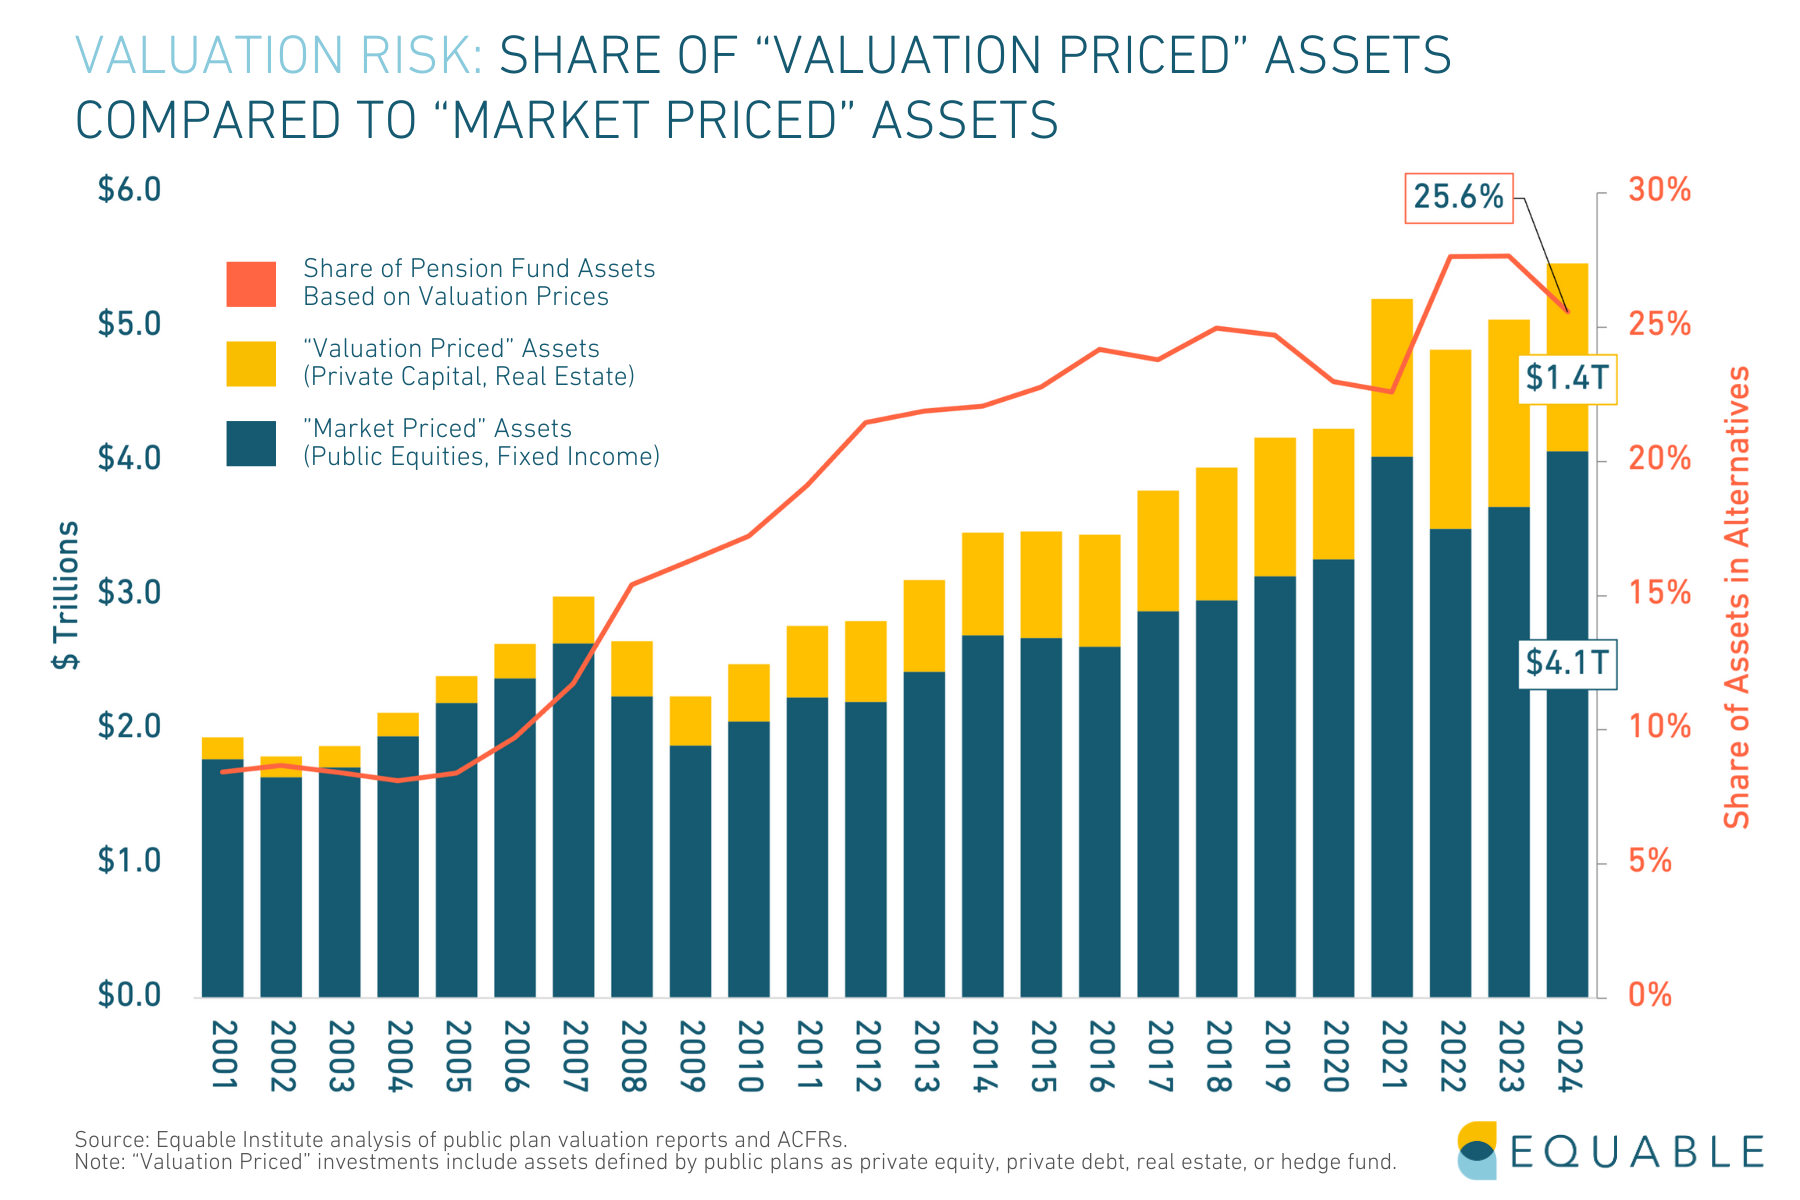
In total, $1.4 trillion in pension fund assets are exposed to valuation risk as of the end of 2024.
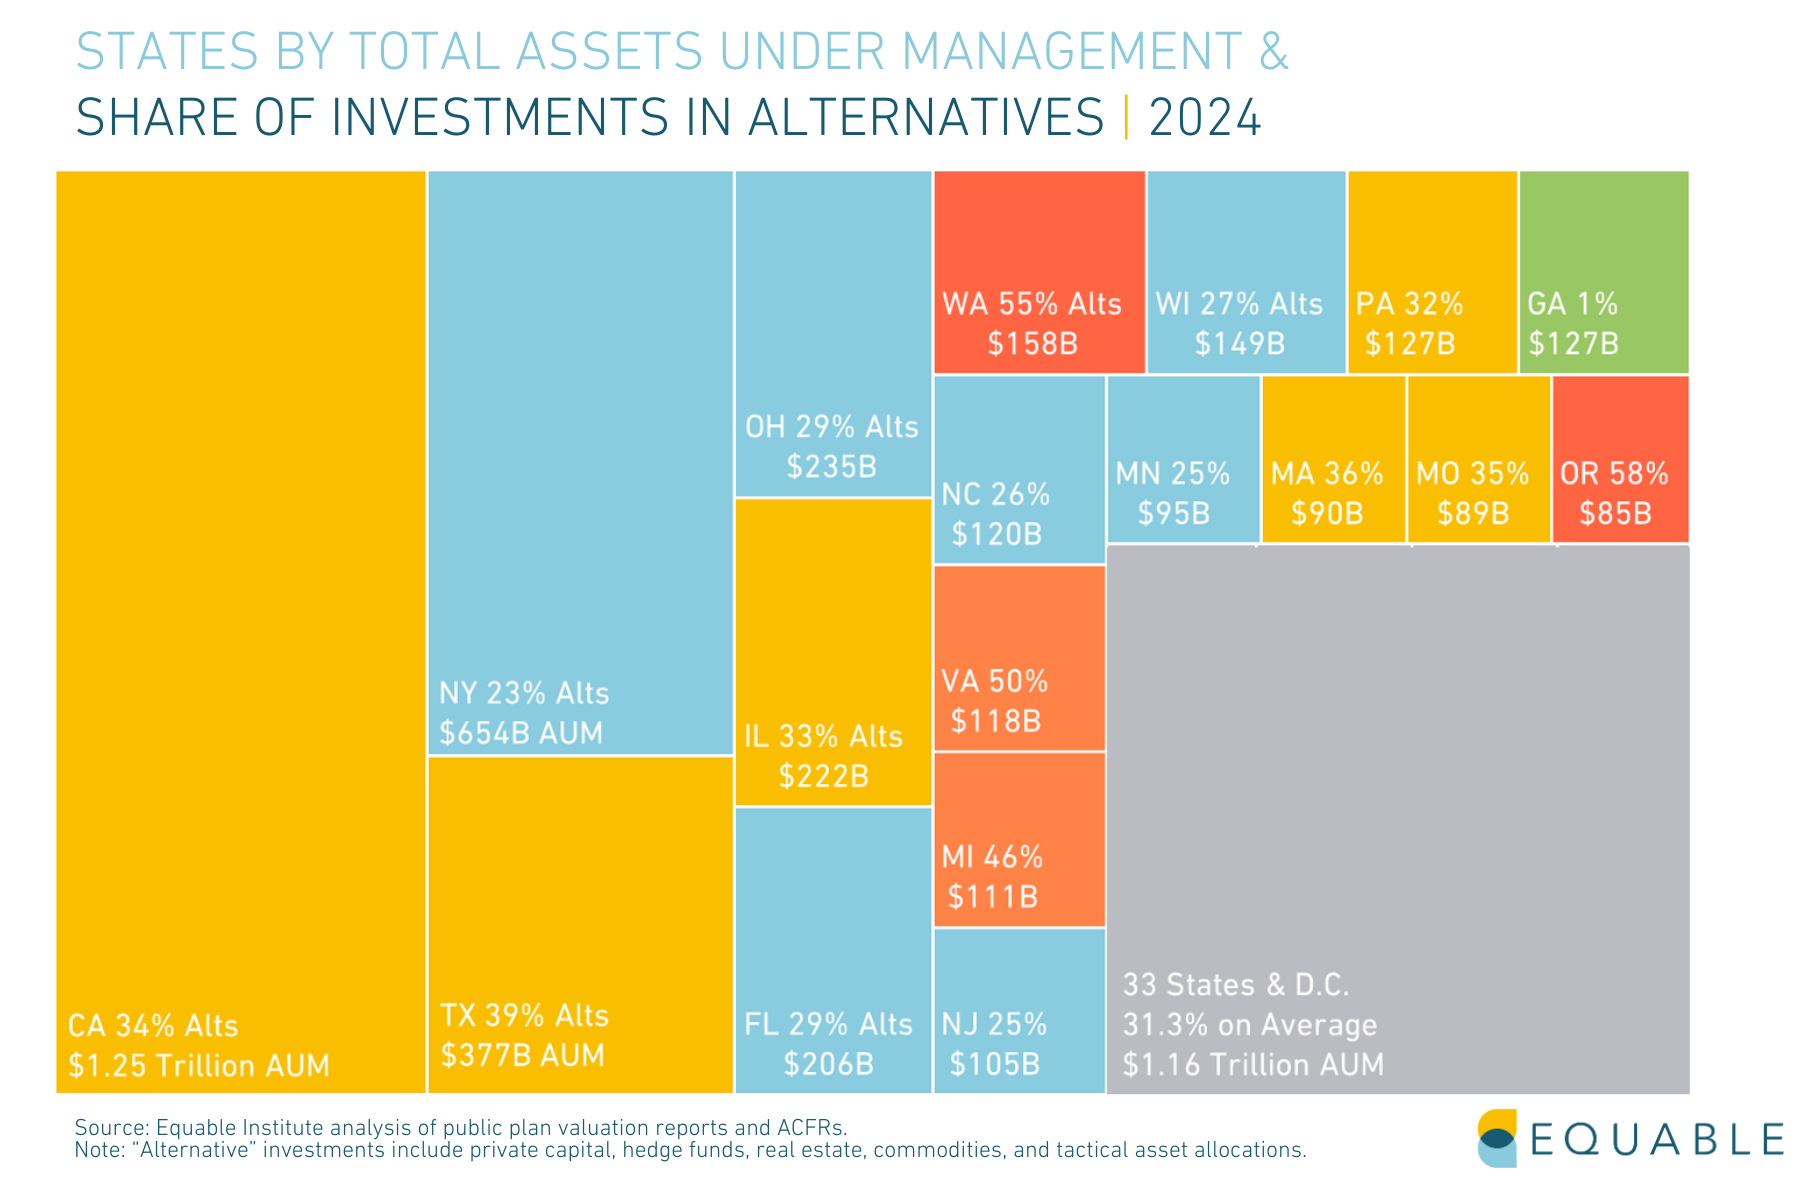
Below is a visualization of the states with the largest investments in alternatives by dollar value.
Why is this a problem?
- There is a sharply increasing share of pension fund investments with values based on valuation-methods instead of market prices, which means an increasing share of pension portfolios are exposed to the risk of being overpriced.
-
- The significant lack of transparency in how pension funds invest in valuation-priced asset classes like private equity and real estate exacerbates concerns about valuation risk.
- The growing rate of volatility in investment returns also adds to concerns about the scale of pension fund assets that are exposed to valuation risk.
- There is a sharply increasing share of pension fund investments with values based on valuation-methods instead of market prices, which means an increasing share of pension portfolios are exposed to the risk of being overpriced.
-
- Overstated portfolio values for asset classes like private capital and real estate can lead to significant unfunded liability problems in the future.
Examining Pension Debt: Causes of Unfunded Liabilities
Today’s pension debt is not primarily caused by increased lifespans, enhanced benefits, or states failing to pay 100% of required contributions. The three primary factors explain unfunded liabilities as of 2023: changes to actuarial assumptions, underperforming investment returns, and interest on the debt.
Managing pension plans requires a wide range of assumptions about future events: investment returns, mortality rates, workforce turnover, salary growth, inflation, government contributions, and more. There are lots of places where actual experience may not line up with actuarial expectations — leading to unfunded liabilities or improved funding.
Pension funds compare actuarial and assumed experience every year, along with other factors that can change the value of liabilities.
We can use the data to look at the internal structure of public pension plans and measure exactly which categories are causing the country’s collective unfunded liabilities.
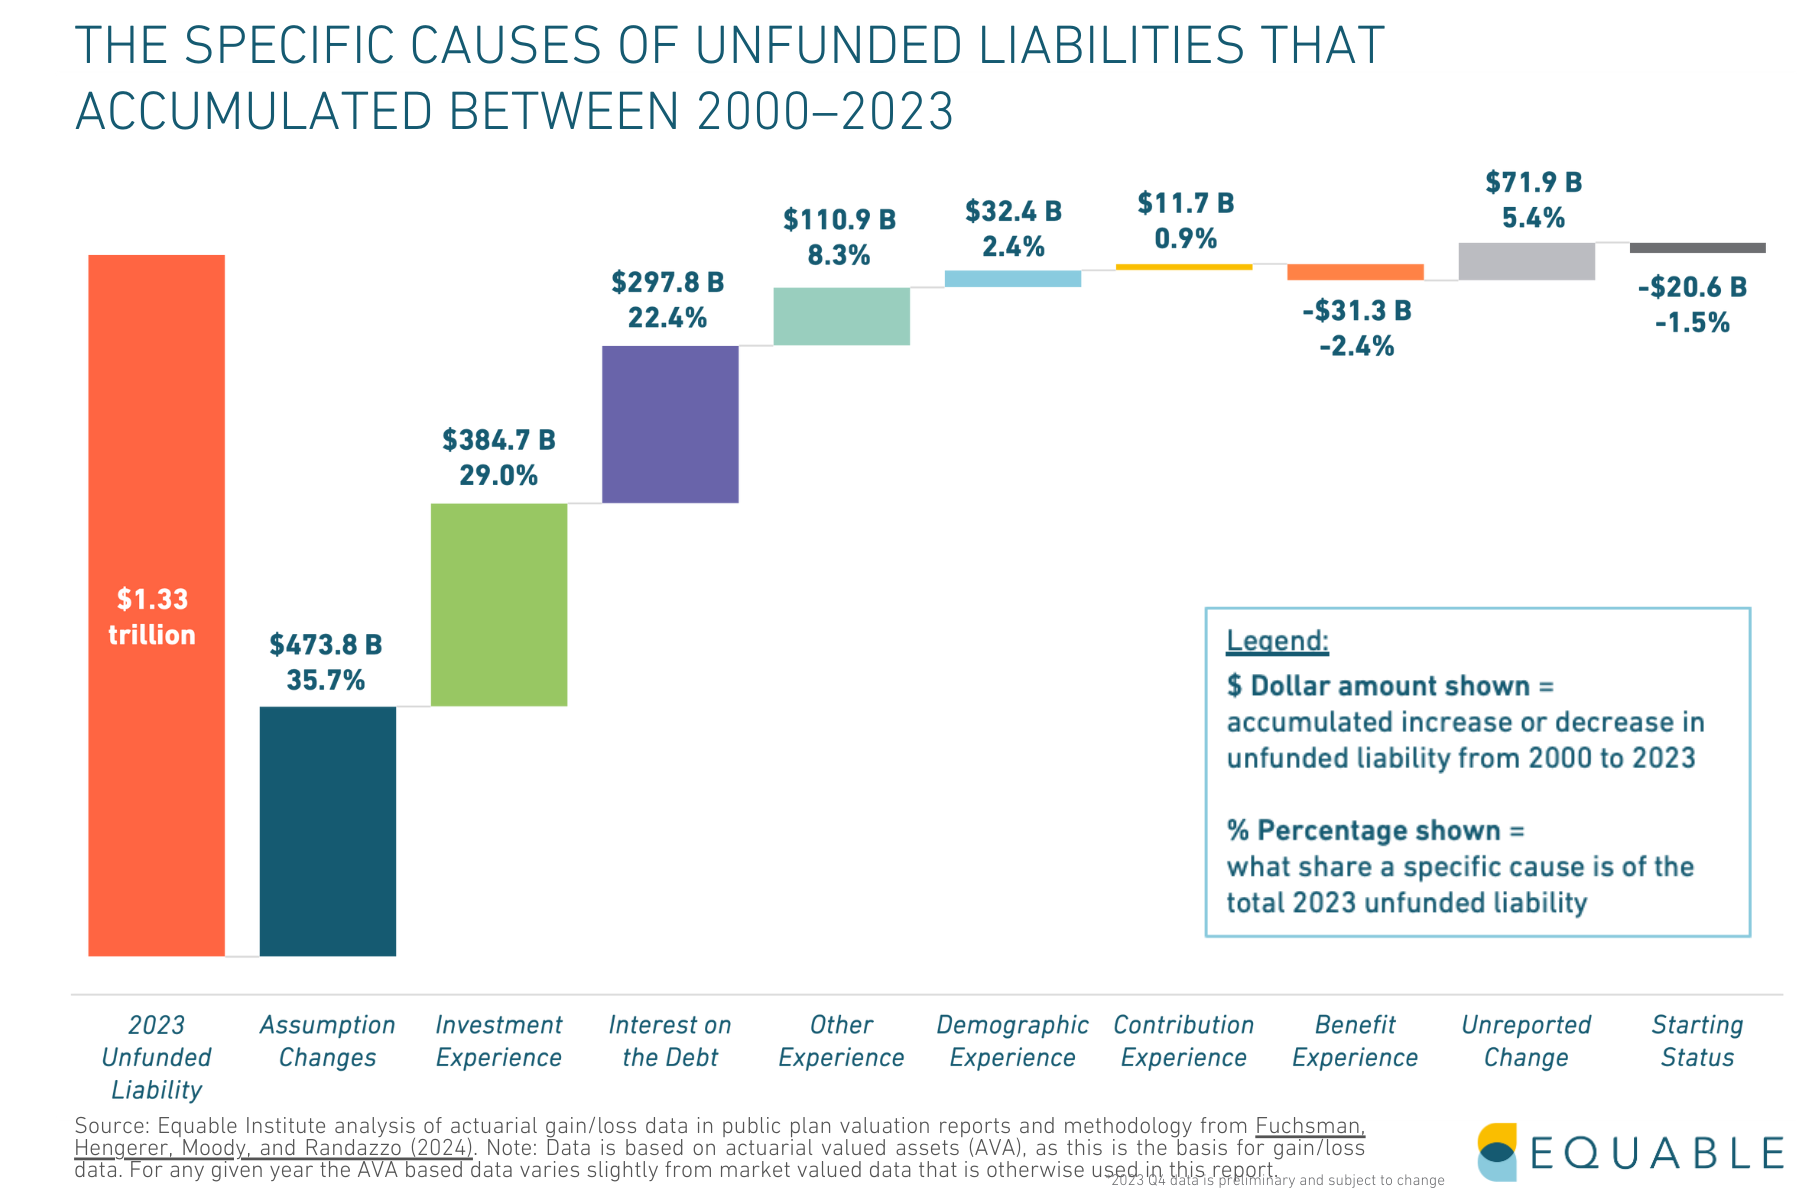
The red column in the chart below shows the total unfunded liabilities from 2000-2023. Each bar to its right shows much individual factors and assumptions contributed to the accumulation of these unfunded liabilities.
The largest contributor to the $1.33 trillion in unfunded liabilities as of 2023 was necessary improvements to actuarial assumptions: $473.8 billion accumulated since 2000 (35.7% of the total accumulated growth). The next largest factors were underperforming investment returns (29.0% of the total) and interest growing faster than contributions paid (22.4%).
The below chart looks at how these factors have contributed to the growth of pension debt overtime.
Underperforming investment experience was the largest contributor to unfunded liabilities, until historically strong 2021 investment returns.
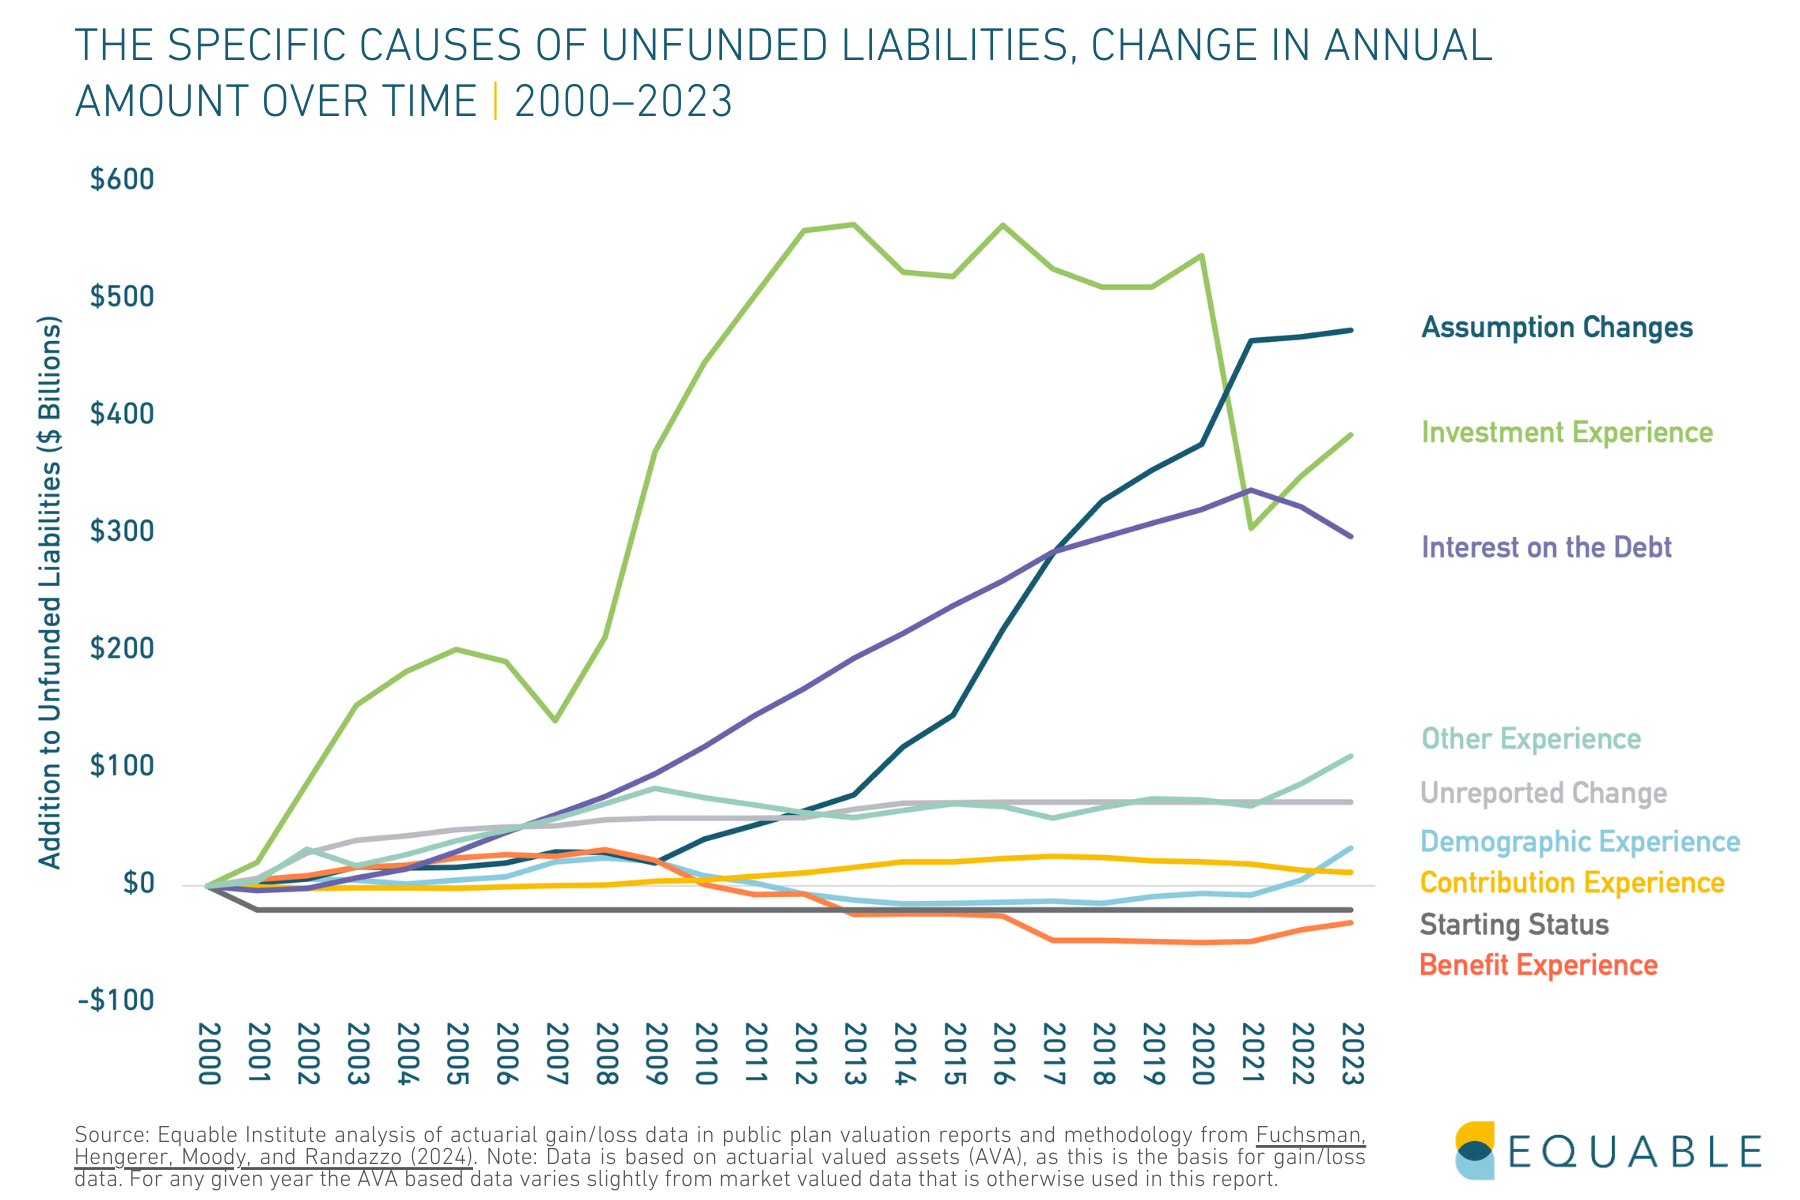
Interest on pension debt has been steadily increasing as a cause of unfunded liabilities for nearly two decades.
Benefit experience has gone from causing unfunded liabilities to reducing pension debt.
National Trends
Unfunded liabilities for state and local pension plans have remained paralyzed above $1 trillon since the 2008 Financial Crisis.
In 2025, The national shortfall in assets for state and local pension plans shrank from $1.54 trillion in 2024 to an estimated $1.27 trillion shortfall in 2025.
This is nearly the same national unfunded liability level as in 2009 ($1.37 trillion).
The national aggregate funded ratio has improved for the third year in a row.
The estimated aggregate funded ratio for statewide and municipal pension plans in 2025 (82.5%) is still below the recent high mark in 2021 (83.9%).
Progress in the reduction of assumed rates of return to levels with higher levels of probability has stalled since the Covid Pandemic.
On the upside, the 10-year rolling average return (2016-2025) at 7.89% is above the 6.87% average assumed return. On the downside, since 2021’s asset bubble returns, the average return for plans (2022-25) is just 4.04% with significant volatility and market unpredictability forecast for the coming years.
We estimate the average investment return for 2025 will be 9.5% (based on data through December 31st).
Government employer contributions have surpassed 30% of payroll for the fourth year in a row.
Combined state and local employer contributions in 2001 were 9.41% of payroll. During the fiscal year ending 2025, employer contributions are 31.65% of payroll.
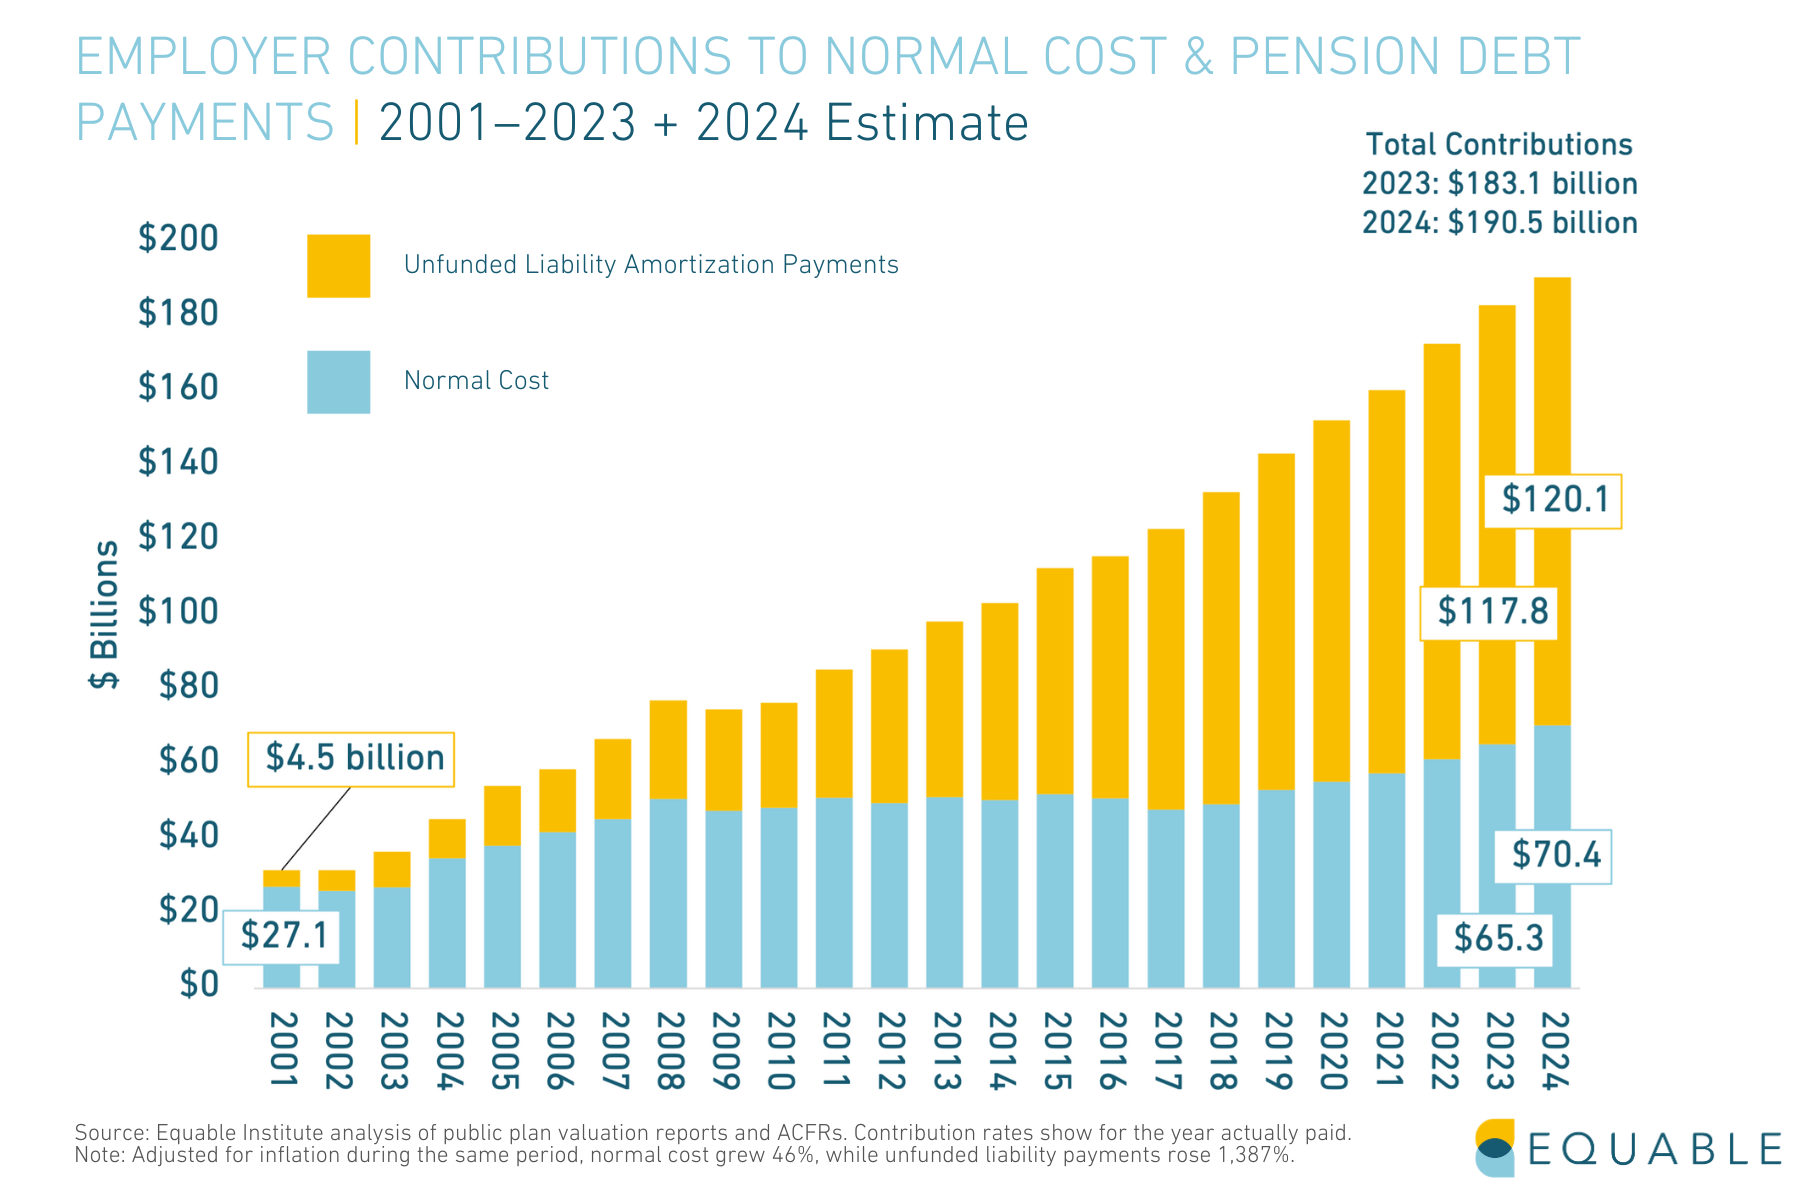
Employer contributions have steadily increased over the past two decades, mostly because of increased unfunded liability amortization payments.
Between 2001 and 2024 the dollar payments toward normal cost more than doubled (up 159%), and for unfunded liability payments jumped over 2,541%.
State and local employee contributions to their own retirement plans have continued to steadily increase.
Note: Public employees are not uniformly covered by Social Security. Some states never opted into Social Security and, therefore, typically have higher valued benefits and relatively higher contribution rates than for statewide systems where members also have access to Social Security benefits.
Public pension asset allocations have continued to shift away from transparent public equities and relatively safe fixed income investments into riskier categories as trustees search for stronger investment returns.
“Alternatives” are a third of pension fund investments (31.7%), driven by private capital investments (13.4%).
Negative net cash flows from contributions and benefit payments have steadily increased over the past two decades, reflecting more “mature” pension plans.
Larger negative cash flows put increased pressure on investment return income each year to make up the difference.
Looking to the Future
There are three key areas to focus on, as America’s state and local pension plans look to the future:
- Will Contribution Rates Keep Growing? Employer contributions successfully offset poor investment performance this year and projections show contribution rates continuing to increase. However, economic instability from unpredictable policy changes, potential production declines from trade disputes, and state budget strain from federal cost-shifting could force states to slow or halt these necessary contribution increases.
- Will Assumed Returns Stay Flat? Capital market assumptions published in the summer of 2025 are slightly improved compared to 2024, with generally consistent caveats about geopolitical risks. Combined with higher treasury yields and volatile tax revenues, public pension plans are unlikely to reduce their assumed rates of return in the near term, keeping expectations at current levels despite market uncertainties.
- Will Interest on the Debt Continue Its Decline? There has been a two-year decline in the amount of unfunded liabilities caused by interest on the debt. This trend is a direct byproduct of rising contribution rates and relatively lower investment return assumptions. If contributions do keep rising that could help with reducing how much this factor is contributing to unfunded liabilities.
Multi-year, small, steady improvements have pushed the national average funded ratio above 80% and kept unfunded liabilities consistently between $1 trillion and $1.5 trillion. The upside of this is that things aren’t getting worse and there is reason for cautious optimism a positive trajectory could persist. The downside is that plans have just survived, not thrived. The costs of pension debt paralysis continue to grow while the fragile system remains vulnerable to market downturns and unpredictable political policy.
We're here to help. Contact us for more information.
Additional Resources
Financial Resilience Report
Want to dive deeper and understand pension fund fiscal health on the state, system, and plan levels? The Financial Resilience Report is an interactive tool that looks at 7 key metrics of pension performance.
Read More
State of Pensions 2025 Downloadable Data
Interested in exploring our full data set? Download the raw data from the sixth edition of State of Pensions.
Read More