Share

State of Pensions 2023
Public pension funds will see a moderate improvement in funding in 2023, but persistent unfunded liabilities remain a threat in 2023.

- What is the State of Pensions in 2023?
- Trend to Watch: Political Risk - ESG and Pensions
- Trend to Watch: Valuation Risk
- National Trends
- Within the Trends: Funded Status
- Analysis: What We See in the Cash Flow Trends
- Looking to the Future
- Additional Resources
Read last year's state of pensions
What is the State of Pensions in 2023?
State retirement systems in America are still Fragile.
This an annual report on the financial status of state and local public pension systems, put into a historic context. State and local governments face a wide range of challenges in general – and some of the largest are growing and unpredictable pension costs. The scale and effects of these challenges are best understood by considering the multi-decade financial trends and funding policy decisions that have brought public sector retirement systems to this moment.
The last 12 months have provided many mixed signals for U.S. state and local pension funds: the 2022 bear market rolled into a community bank crash before markets rebounded into the summer of 2023. However, on net, investment performance of state and local pension funds fell short of important investment targets. Equable Institute estimates that the aggregate funded ratio for U.S. state and local pension funds will rise to 78.1% in 2023 and unfunded liabilities will decline slightly to $1.44 trillion year over year.
Looking forward, the long-term outlook for pension funds in 2023 and beyond will likely be shaped by converging pressures of risk addiction, market uncertainty, and increasing politicization of asset management activities.
- State and local plans are reporting an investment return average of 7.47%, over performing the average 6.9% assumed rate of return.
- Funded status in 2023 has shown moderate improvement, increasing to 78.1%. Following the wide swings of the Covid-era market, the 2023 fiscal year may have an underwhelming but positive effect of funding levels after the negative returns of 2022.
Positive Trends
- Funding Policies: There are now 95 state and local plans that assume investment returns below 7%, as of announcements through June 2023. This is up from 65 plans in 2020 and 84 plans in 2022. While the median assumption is still 7%, just a quarter of state and local plans are still using investment expectations above 7%. Overall, this downward trend in investment assumptions is translating into more accurate accounting of future liabilities and better contribution in-flows. States also continued in the past year a recent trend of using surpluses for one-time supplemental contributions into state pension funds to shore up their funding levels.
- Paying the Bills: While a few states did not fully fund their required contributions in 2022 there were enough plans that overpaid required contributions that the average amount paid was 100% of actuarially determined rates. This continues a trend that was gradually improving over the past few years.
- Funded Ratio: There was an improvement in the funded ratio between 2022 and 2023, going up from 74.9% in 2022 to an estimated 78.1% in 2023. While this is a positive jump in funded status, persistent unfunded liabilities and underperforming investments temper the long-term outlook for pension funds.
Negative Trends
- Investment Returns: Preliminary 2023 investment returns are 7.47% on average for state and local plans, which is above the average 6.9% assumed rate of return. Although this is an improvement over the negative -5.9% returns for 2023, a deeper look shows a wide variance in pension fund investment performance. Just 53% of plans who have reported actual returns for fiscal year 2023 beat their assumed return target, while the rest have underperformed.
- Asset Allocations: Asset allocations continue to shift toward risky alternatives, including private equity, hedge funds, and real estate as pension funds attempt to invest their way out of their funding shortfalls. Roughly one-third of all pension assets are in alternatives as of 2022, up from around 10% before the global financial crisis.
- Contribution Rates: Negative trends from the past decade continue to persist for both member and government employer contribution rates. In fact, employer contributions have now exceeded 30% of payroll on average for the first time.
- Cash Flows: As demonstrated by the bear market of 2022 and subsequent volatility, it is going to be harder and harder to earn large investment returns going forward. This will put a lot of pressure on state retirement plans that are cash flow negative from growing benefit payments.
Trend to Watch: Political Risk - ESG and Pensions
More laws were adopted in 2023 concerning pension funds’ investments related to ESG than any other year on record.
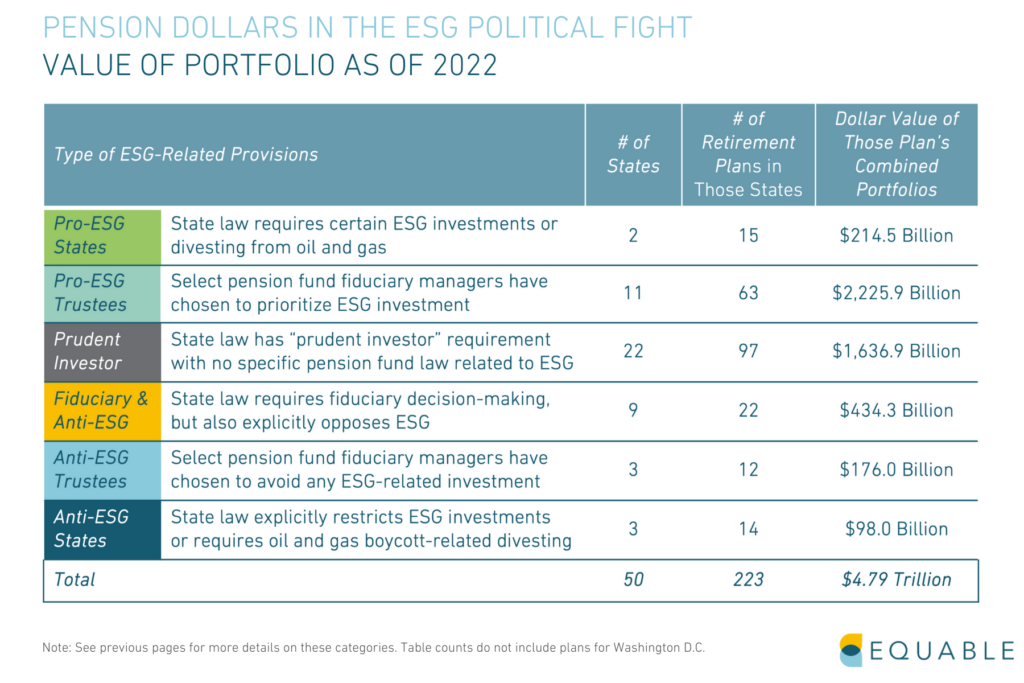
While states passed more anti-ESG laws than pro-ESG laws, there are significantly more pension fund assets that are being influenced by pro-ESG sentiments than anti-ESG views.
More than $2.4 trillion in assets are under management in pro-ESG states compared to $708 billion in anti-ESG states. Even with more laws on the books than ever before, it is unlikely that any of these laws will significantly influence pension fund investing decisions.
In the context of public pension investing, environmental, social, and governance (ESG) considerations are a broad management framework that can guide corporate and government decision making.
Similar frameworks include “stakeholder capitalism” or “sustainable investing.”
There are several ways in which ESG potentially becomes relevant to state and local pension funds. State pension fund trustees could use ESG factors to guide their asset allocation decisions. Financial asset managers could use ESG factors when making investment decisions. Ratings agencies commonly provide “social scores” for different companies that consider ESG factors, which could guide asset manager decisions. Pension funds could also encourage corporate behaviors (through proxy voting) based on ESG factors.
Examples of some ESG factors encompass a wide range of issues and concerns – from climate change to “vice products” to corporate transparency.
There are several ways in which ESG has been addressed in states across the country, ranging from laws directing investment decisions to pension fund trustees prioritizing certain ESG-related investment goals.
In the past year:
- 13 states have adopted a bill, issued a joint resolution (LA), or had an executive order (NH) related to ESG during the spring 2023 legislative session.
- 9 of the above bills/resolutions/orders adopted in 2023 require investment decisions to be based solely on financial (pecuniary) factors and also make some negative reference to ESG.
- 1 state (IL) adopted a pro-ESG law requiring investment fund managers to consider environmental and sustainability factors.
- 6 other states have pending ESG legislation as of June 2023, including proposals to divest from fossil fuel companies (CA, VT) and proposals to require financial factors only in investment decisions (OH, SC).
Trend to Watch: Valuation Risk
Pension funds are addicted to risk in their effort to avoid contribution rates rising even higher.
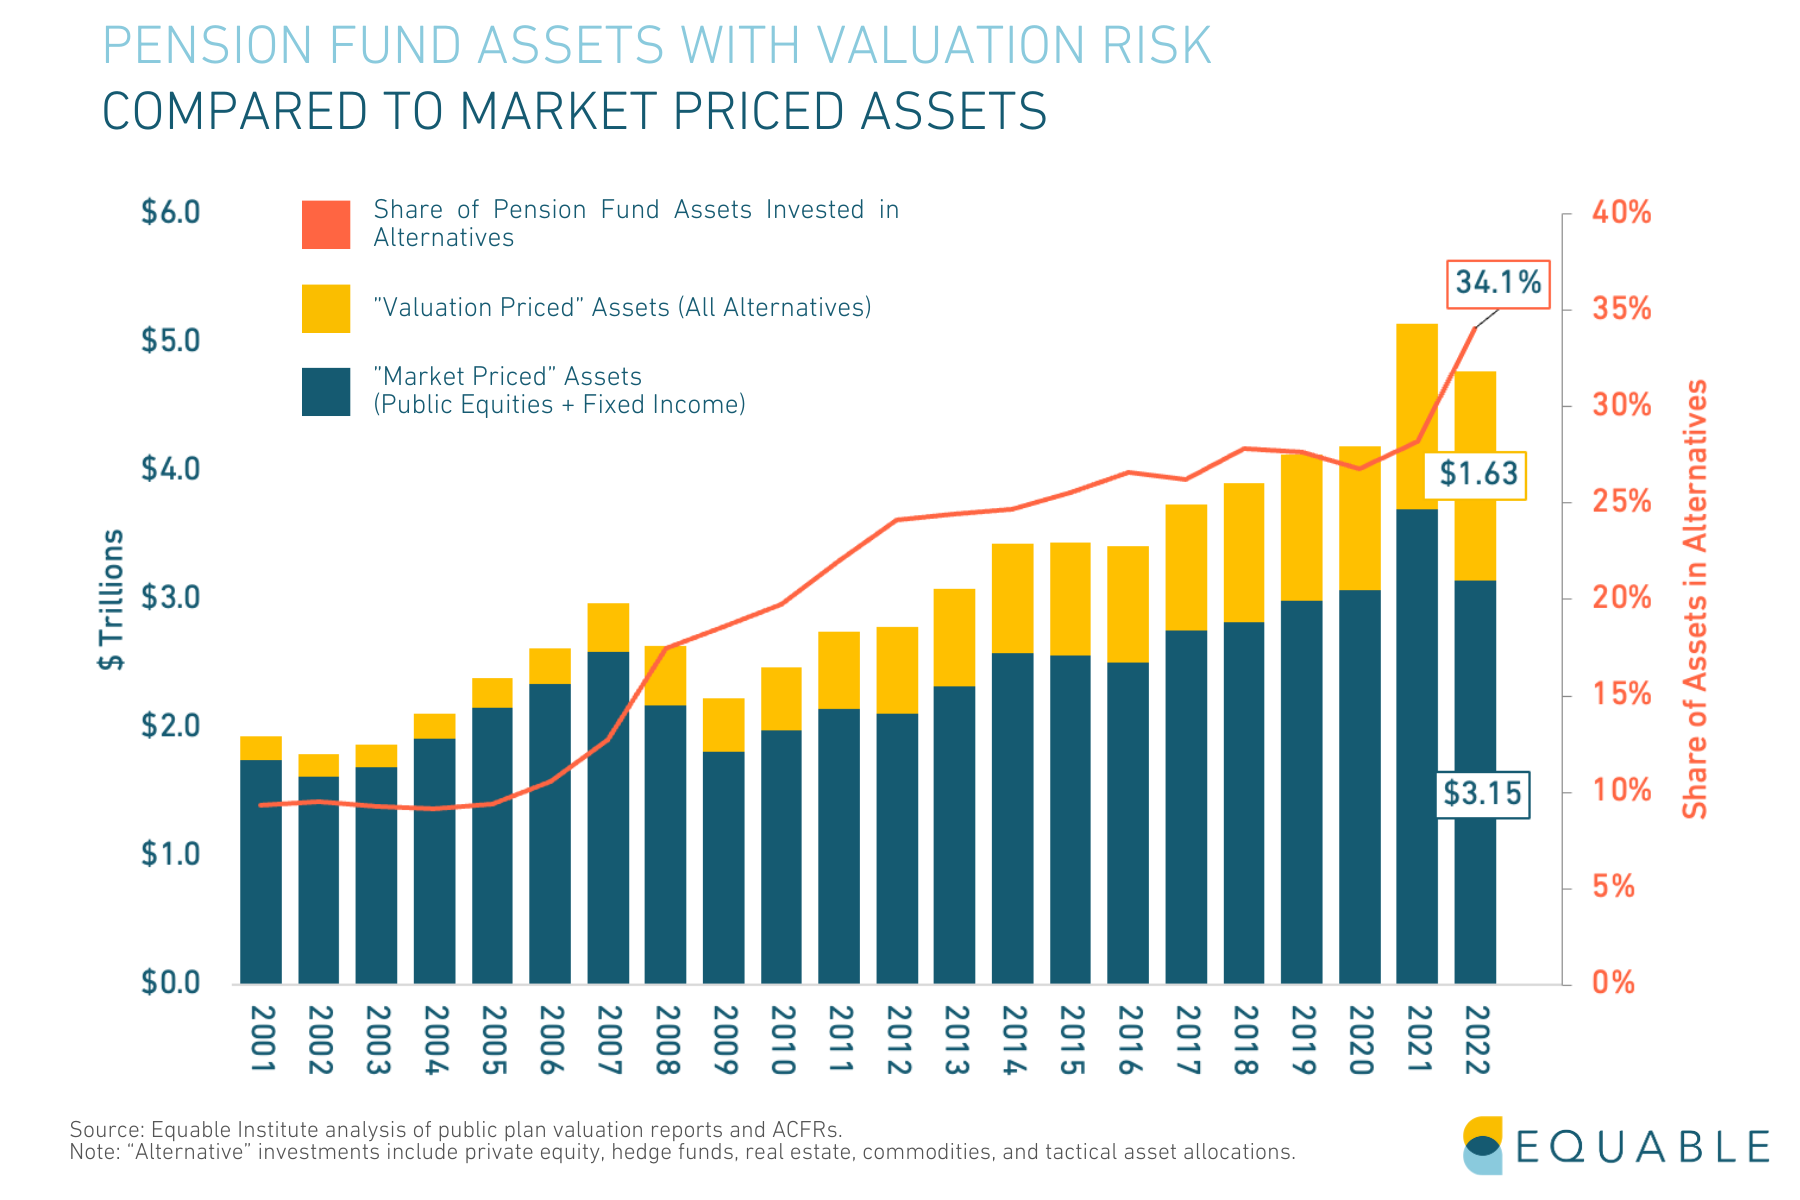
The risk profiles of U.S. state and local pension funds have changed significantly in recent years. And it appears that the “take more risk” route is likely for the major pension funds. As of 2023, 34.1% of pension fund assets have shifted into private equity and other alternatives, up from just 9% in 2001. This leaves pension funds exposed to “valuation risk.”
What is Valuation Risk?
Traditional assets like stocks and other public equities that are valued based on their market price. Alternative investments are valued based on “fair price” valuations from asset managers that are not tied to real-time market performance. This means that it is difficult to effectively evaluate if these “fair prices” are accurate. If they aren’t, pension funds are likely over-estimating the total value of their assets and, in turn, are setting contribution rates too low to achieve their funding goals.
As of 2022, as much as one-third of the $4.8 trillion in assets that pension funds reported owning were based entirely on non-transparent valuation approaches from asset managers (not market-based prices like stocks).
Why is this happening?
There is no way that pension funds can meet their investment targets using simple stock and bond passive portfolios. The probability of earning just a 6% return over the next decade is less than 50%. This is particularly notable since public retirement systems have done a better job lowering their assumed returns over the last two decades but they are still unrealistically high.
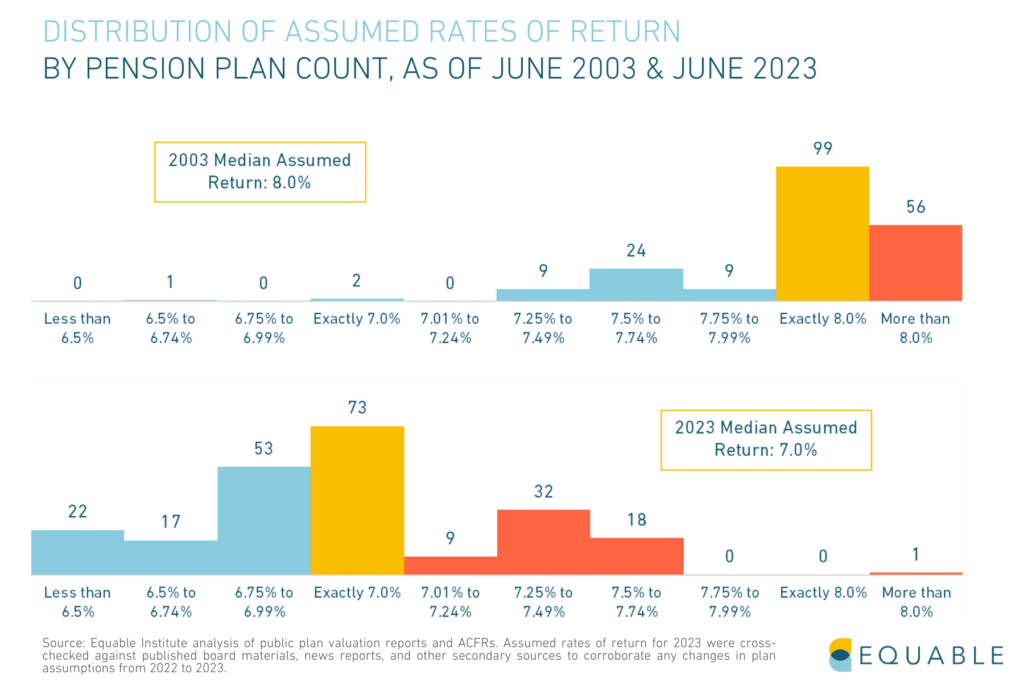
There were 197 major public pension plans with assumed rates of return higher than 7% in 2003. Today, that number has fallen to just 60 plans, including 19 plans using a 7.5%+ return assumption. The median assumed return in 2003 is 7%, but the average is 6.88% and continuing to decline.
Still, just 37 plans have assumed returns of 6.5% or less. These plans are leading their peers in adopting more realistic future expectations.
Therefore, the choices are to either (a) increase contributions into pension funds beyond their currently historically high levels, or (b) roll the dice and take on more risk.
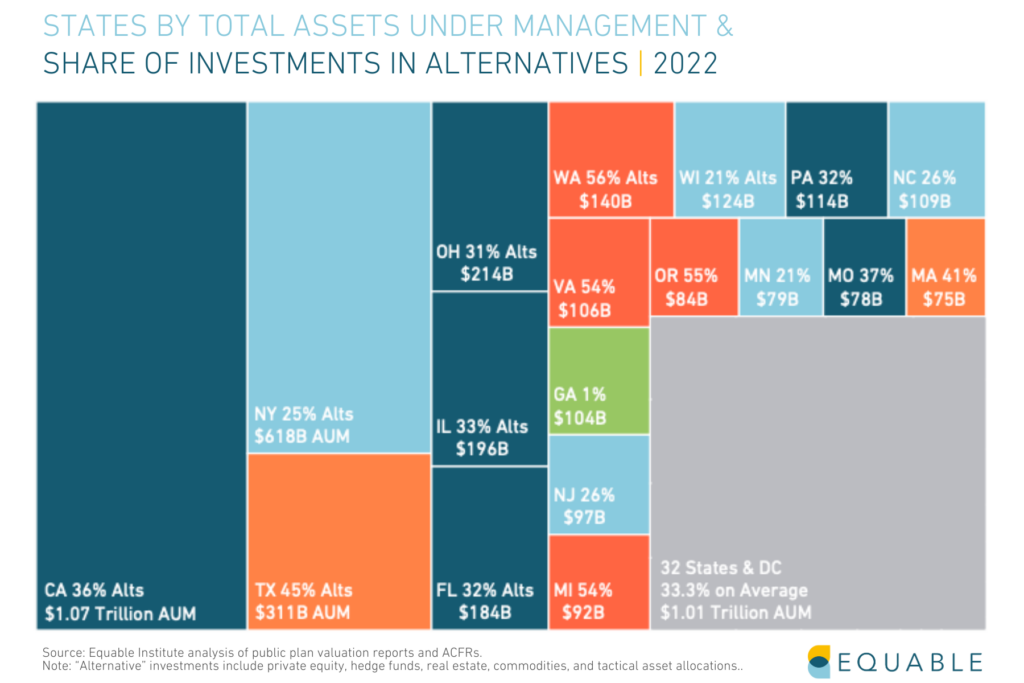
In total, $1.6 trillion in pension fund assets are exposed to valuation risk as of the end of 2022.
Below, is a visualization of the states with the largest investments in alternatives by dollar value.
National Trends
State and local pension plans have reached historic levels of investments in private equity and real estate — doubling down on what has become a high-risk, high reward dilemma for trustees.
We are seeing more and more funds making more and more risky decisions. However in this age of volatility, it is unclear whether these risky investments will pay off.
Asset allocations have continued to shift away from relatively safe fixed income investments into riskier categories in a search for stronger investment returns.
Notably, private equity investments are up from 10% to 13% of portfolios so far announced in 2023.
Average investment returns were consistently below assumed rates of return over most of the past decade. This contributed to the growth in unfunded liabilities for public plans.
Preliminary 2023 investment returns are 7.47% on average for state and local plans. Improving financial markets in the last few months of the calendar year pushed the average investment return above the average 6.9% assumed rate of return. But, on a plan-level basis, just 53% of plans beat their assumed rate of return for the year.
The average 10-year return has fallen to around the average assumed rate of return for the first time since 2018.
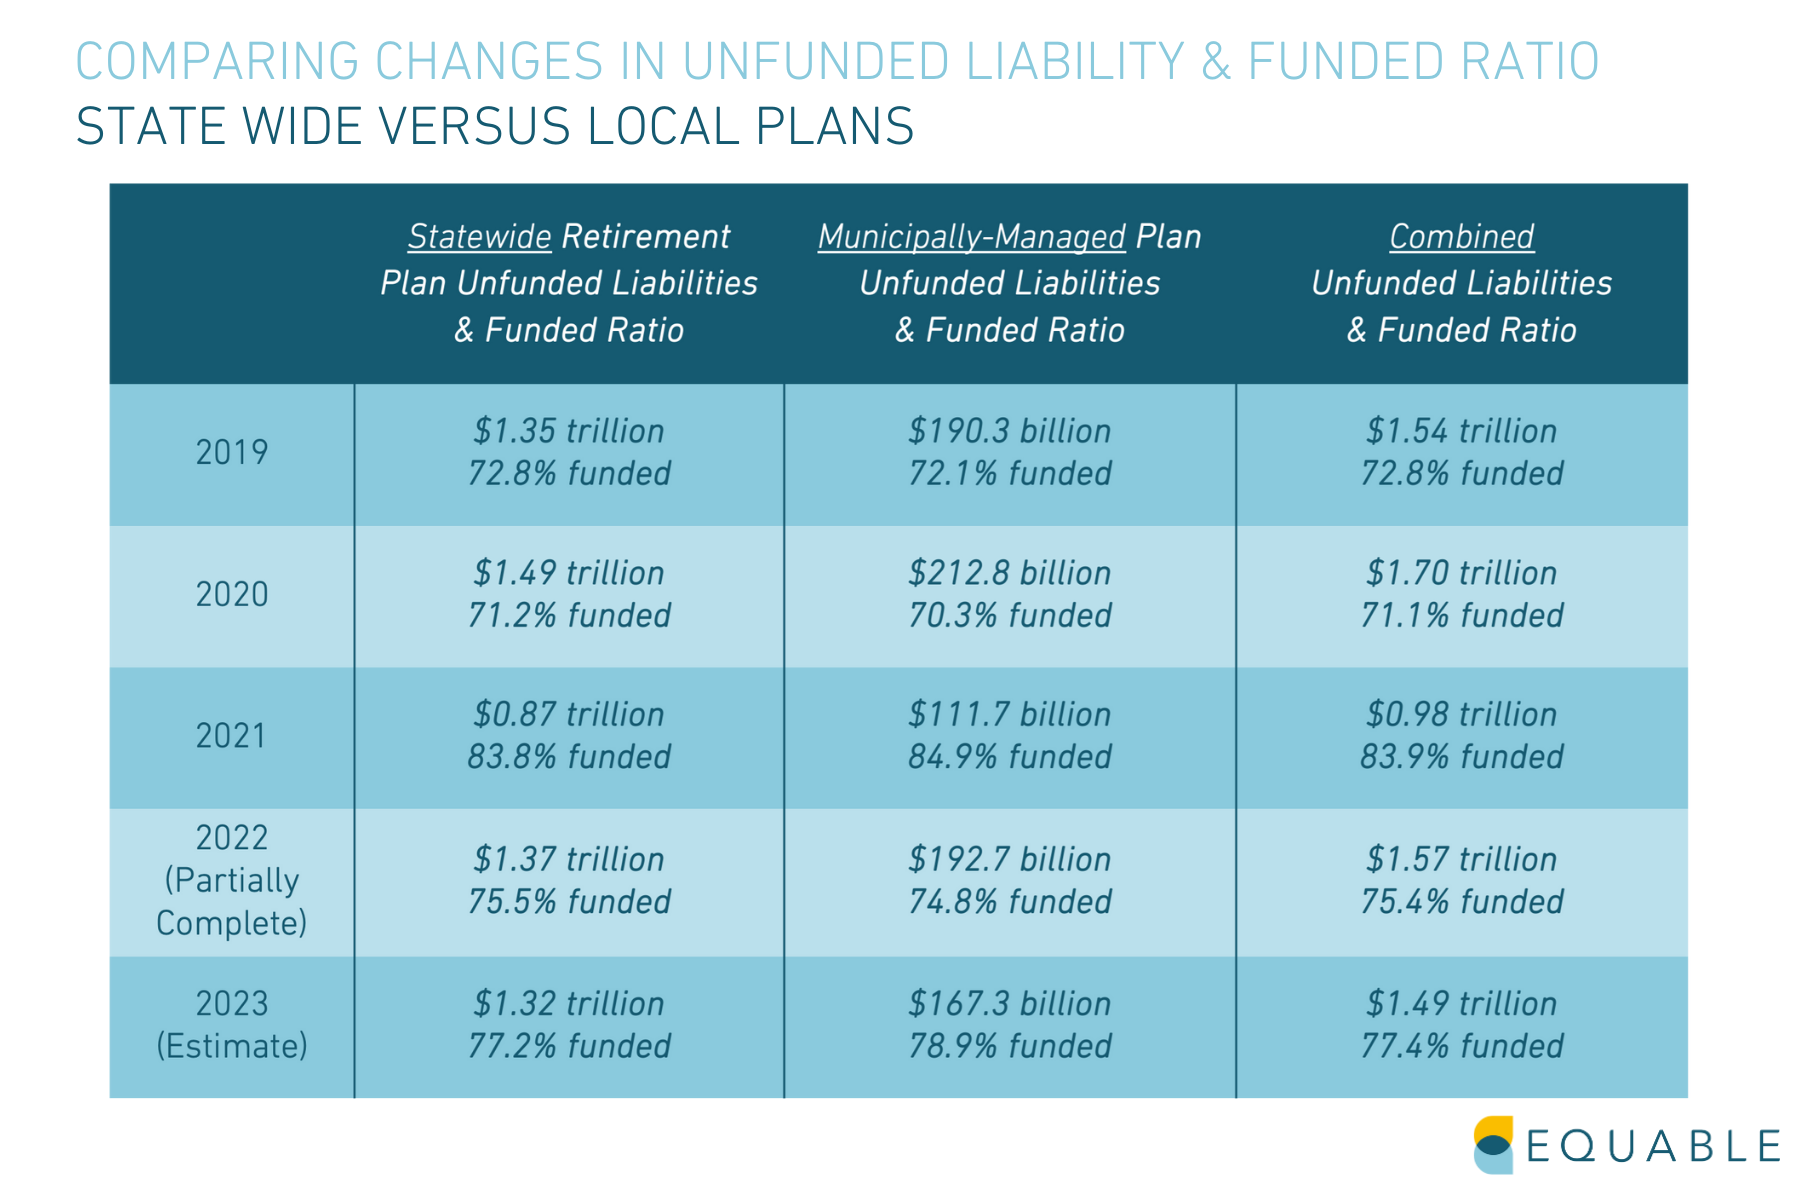
The aggregate funded ratio for statewide plans collectively is worse than in 2008. However, the trend from 2019 to 2023 still shows improvement despite mediocre returns in 2023.
There has been relatively little change in the national shortfall in assets for state and local pension plans since the Financial Crisis. Unfunded liabilities decreased to their lowest level in 2021, but since then have reverted to just a slight improvement from pre-Covid 19 pandemic levels.
Total unfunded liabilities for state and municipal plans have moved from $1.35 trillion in 2009 to a peak of $1.70 trillion in 2020. We estimate that 2023 unfunded liabilities will stay relatively stable, decreasing slightly to $1.44 trillion from $1.59 trillion in 2022.
State and local employee contributions to their own retirement plans have continued to steadily increasing.
State and local employee contributions to their own retirement plans have been steadily increasing. Public sector workers who are also enrolled in Social Security paid 161 basis points more (a 35.7% increase) during the 2023 fiscal year than they did during the 2001 fiscal year and 21.8% more than they did in 2008 before the financial crisis.
Those who do not participate in Social Security paid 19.9% more this year than in 2001 and 13.7% more than in 2008. For Plans Not Participating in Social Security or with Mixed Levels of Participation For Plans Participating in Social Security
Note: Public employees are not uniformly covered by Social Security. Some states never opted into Social Security and, therefore, typically have higher valued benefits and relatively higher contribution rates than for statewide systems where members also have access to Social Security benefits.
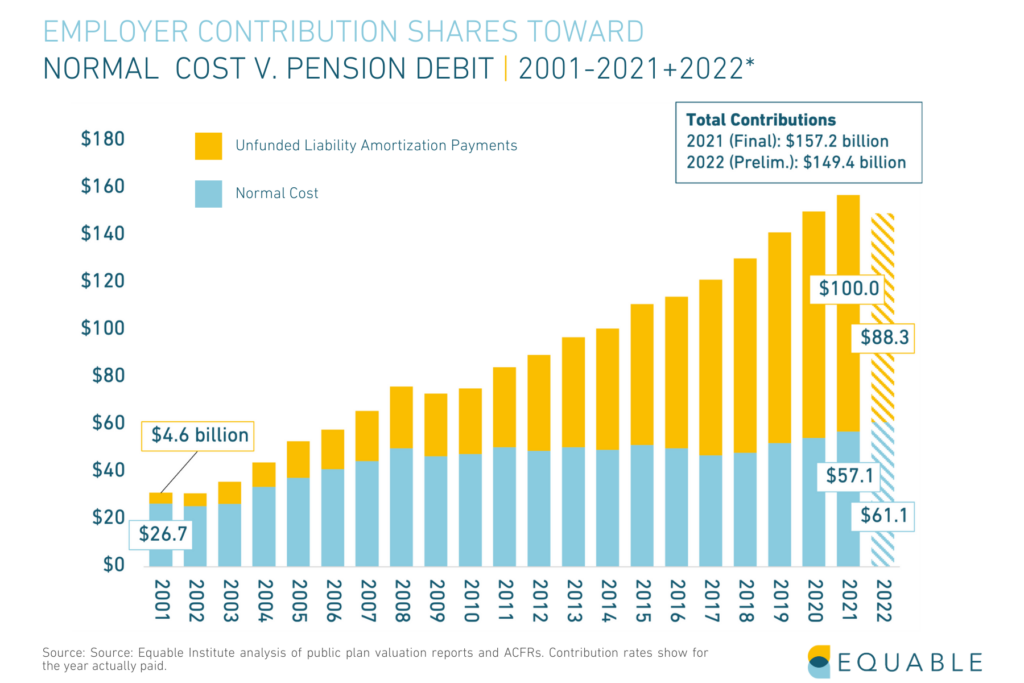
Government employer contributions have steadily increased over the past two decades, mostly because of increased unfunded liability amortization payments.
Combined state and local employer contributions in 2001 were 9.15% of payroll. During the fiscal year ending 2023, employer contributions are 30.05% of payroll.
On a dollar basis, unfunded liability payments have risen 2,089% during the same two-decade period from under $4.6 billion in 2001 (or $7.6 billion, adjusted for inflation) to over $100 billion annually in 2021.
Negative net cash flows from contributions and benefit payments have steadily increased over the past two decades, reflecting more “mature” pension plans.
The average assumed rate of return in 2023 is 6.88%, down from 6.92% in 2022.
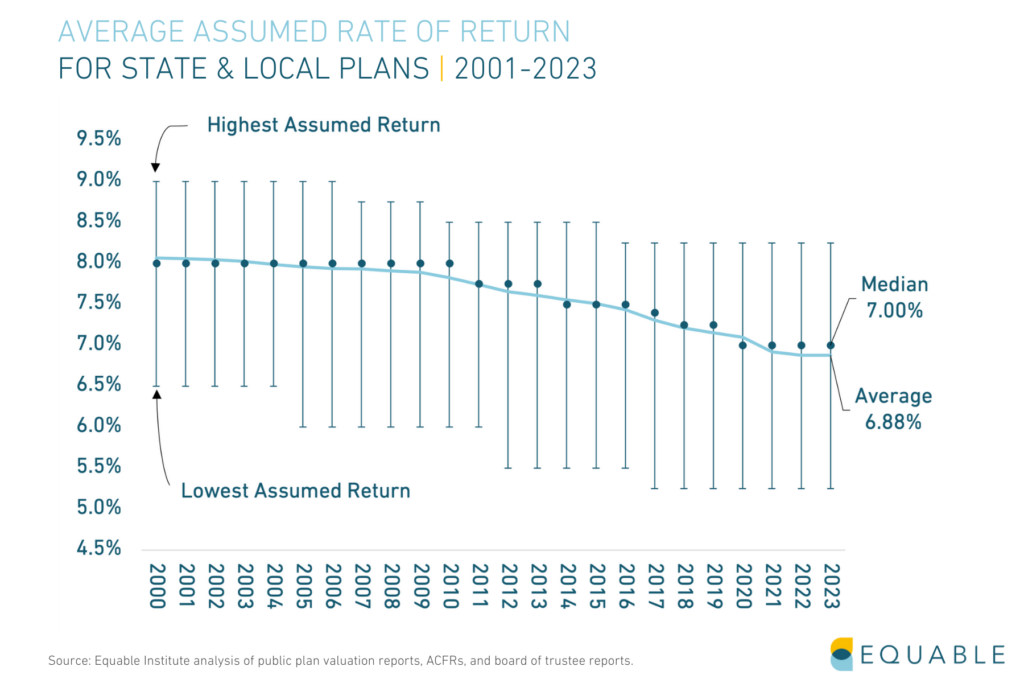
By comparison, there were 197 major public pension plans with assumed rates of return higher than 7% in 2003. Today, that number has fallen to just 60 plans, including 19 plans using a 7.5%+ return assumption. The median assumed return in 2003 is 7%, but the average is 6.88% and continuing to decline.
Still, just 37 plans have assumed returns 6.5% or less. These plans are leading their peers in adopting more realistic future expectations.
Within the Trends: Funded Status
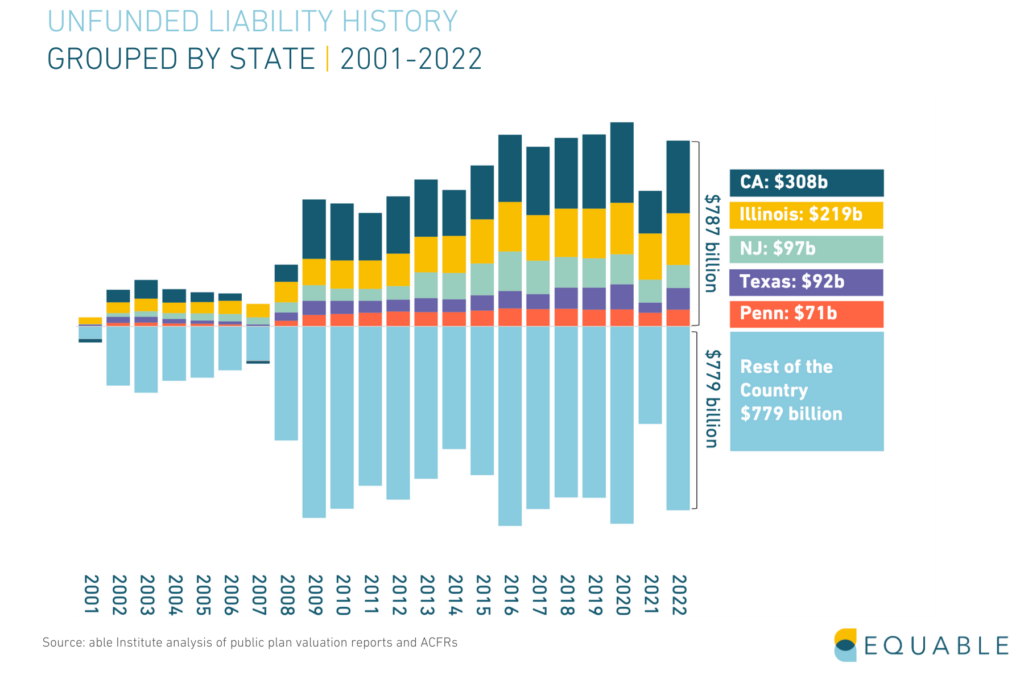
The five largest states by unfunded liabilities have a shortfall ($787.3 billion) that is slightly larger than the rest of the country combined ($778.6 billion).
More than one-third (33.7%) of national unfunded liabilities are just in California and Illinois combined ($527.1 billion).
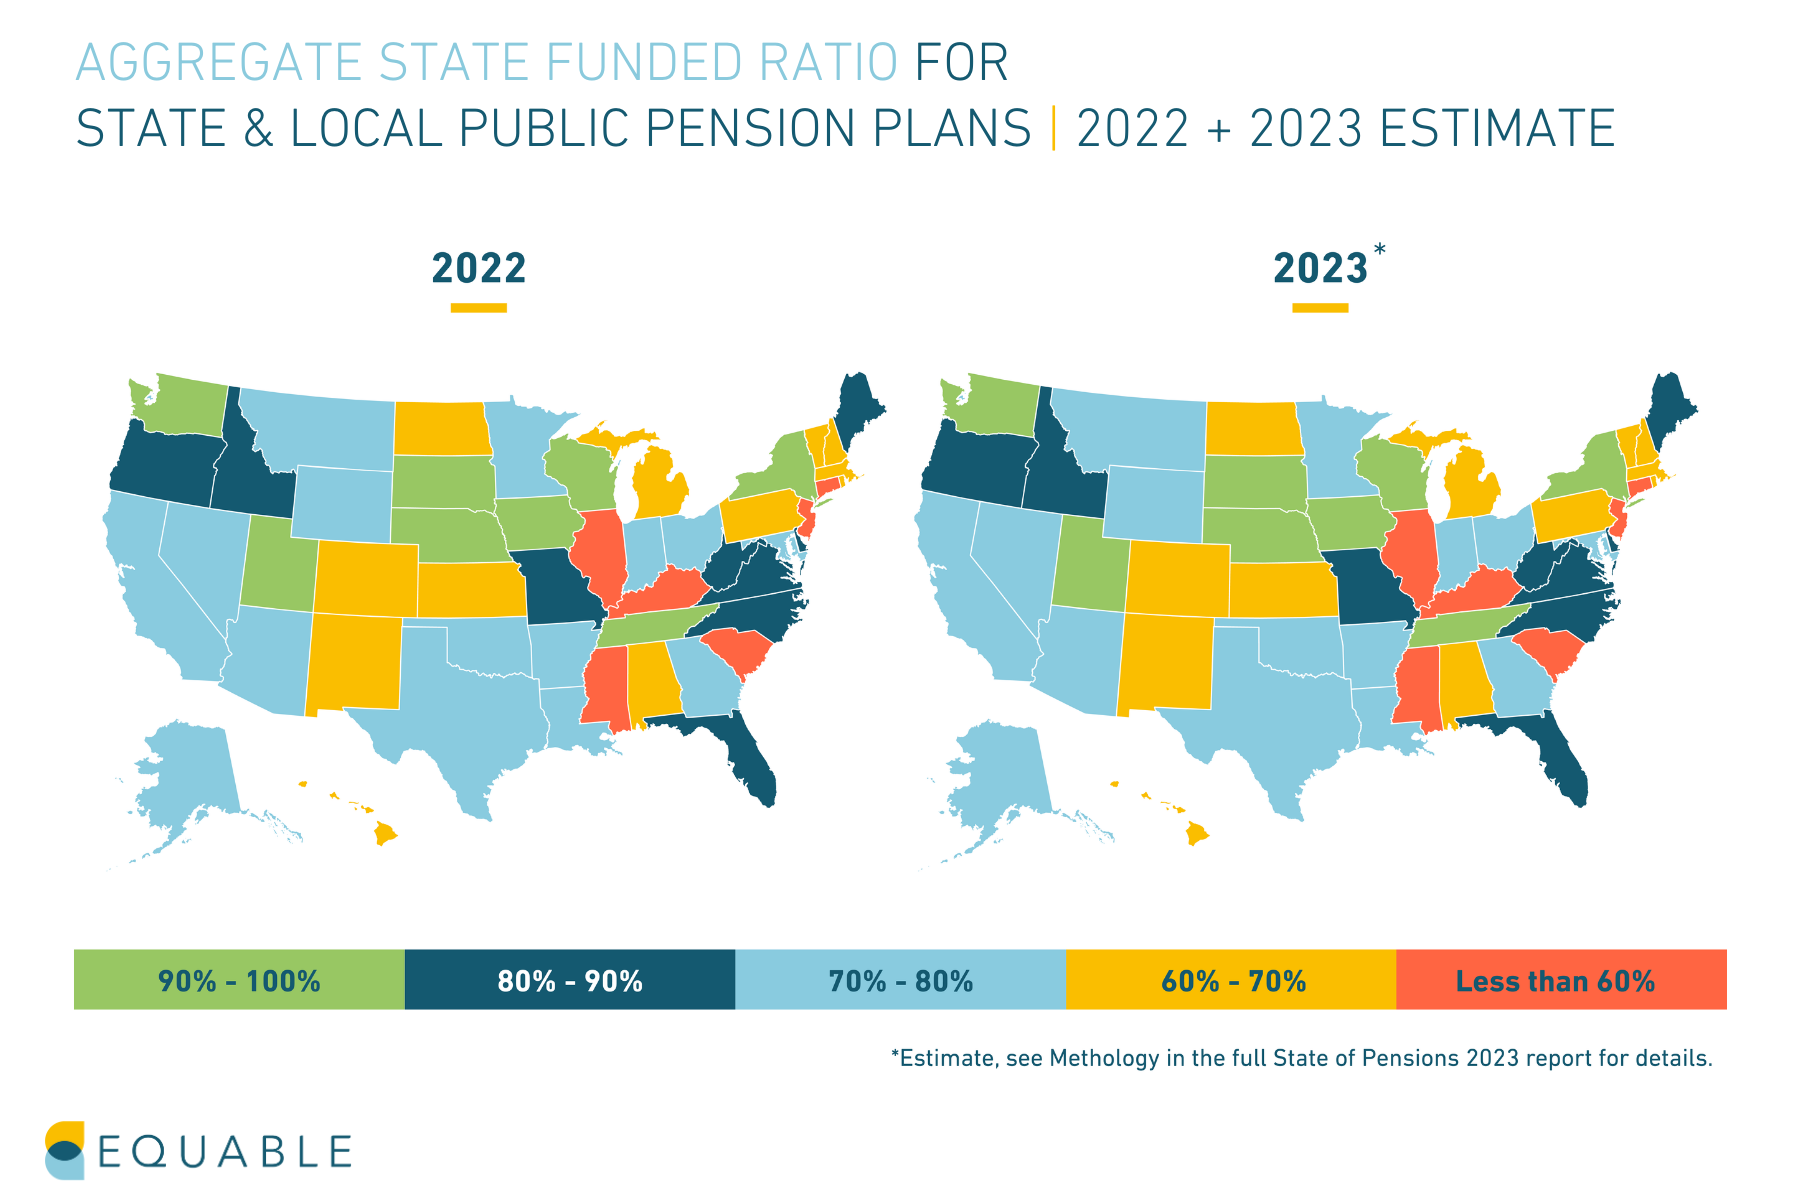
Financial market volatility has meant most plans’ funded ratios declined between 2019 and 2020, then increased in 2021, and now are balancing out with weak investment performance for 2022-23.
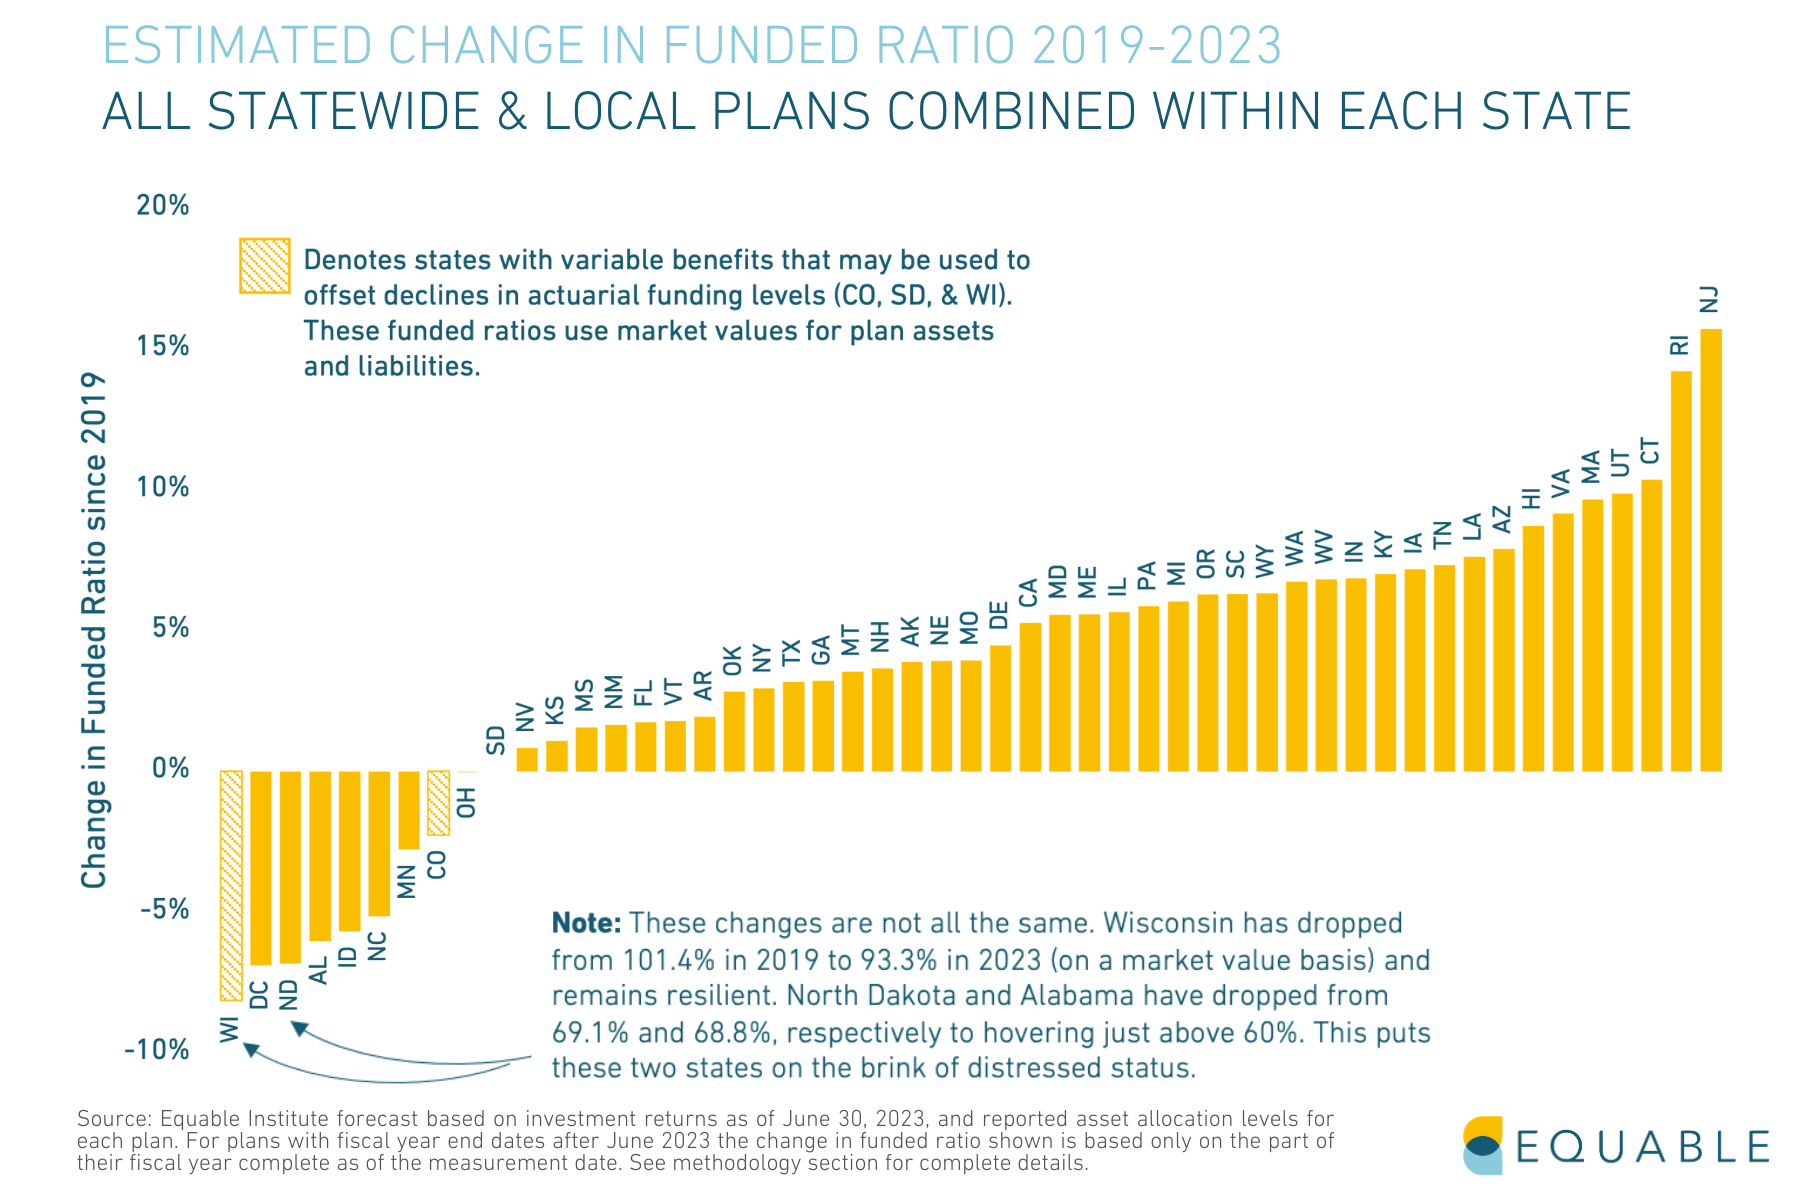
There will be varied levels of funded ratio change from 2019 (pre-pandemic) to 2023 once final plan numbers are available.
However, it’s likely that in 2023 the funded ratio for most states will be in a better condition than at the end of 2019.
Most public pension unfunded liabilities reside within statewide retirement systems, primarily because they are simply larger, with more members and more promised benefits.
The funded ratios for state and local plans also have tended to move together, as the same dynamics of underperforming investments and changes to actuarial assumptions have influenced overall finances.
The aggregate funded ratio for municipally-managed plans is more volatile than statewide only plans. But while the funded ratios is under 80% in 2023 this is still near its highest point in recent history.
The aggregate funded ratio for statewide plans collectively is slightly worse than the national average. However, like the national combined data, the trend from 2019 to 2023 still shows some improvement.
Analysis: What We See in the Cash Flow Trends
It is going to be harder in coming years to earn massive investment returns. Plans are cash flow negative from contributions and benefit payments. And the available asset base to earn investments from is improving, but is still at least a trillion dollars less than it should be.
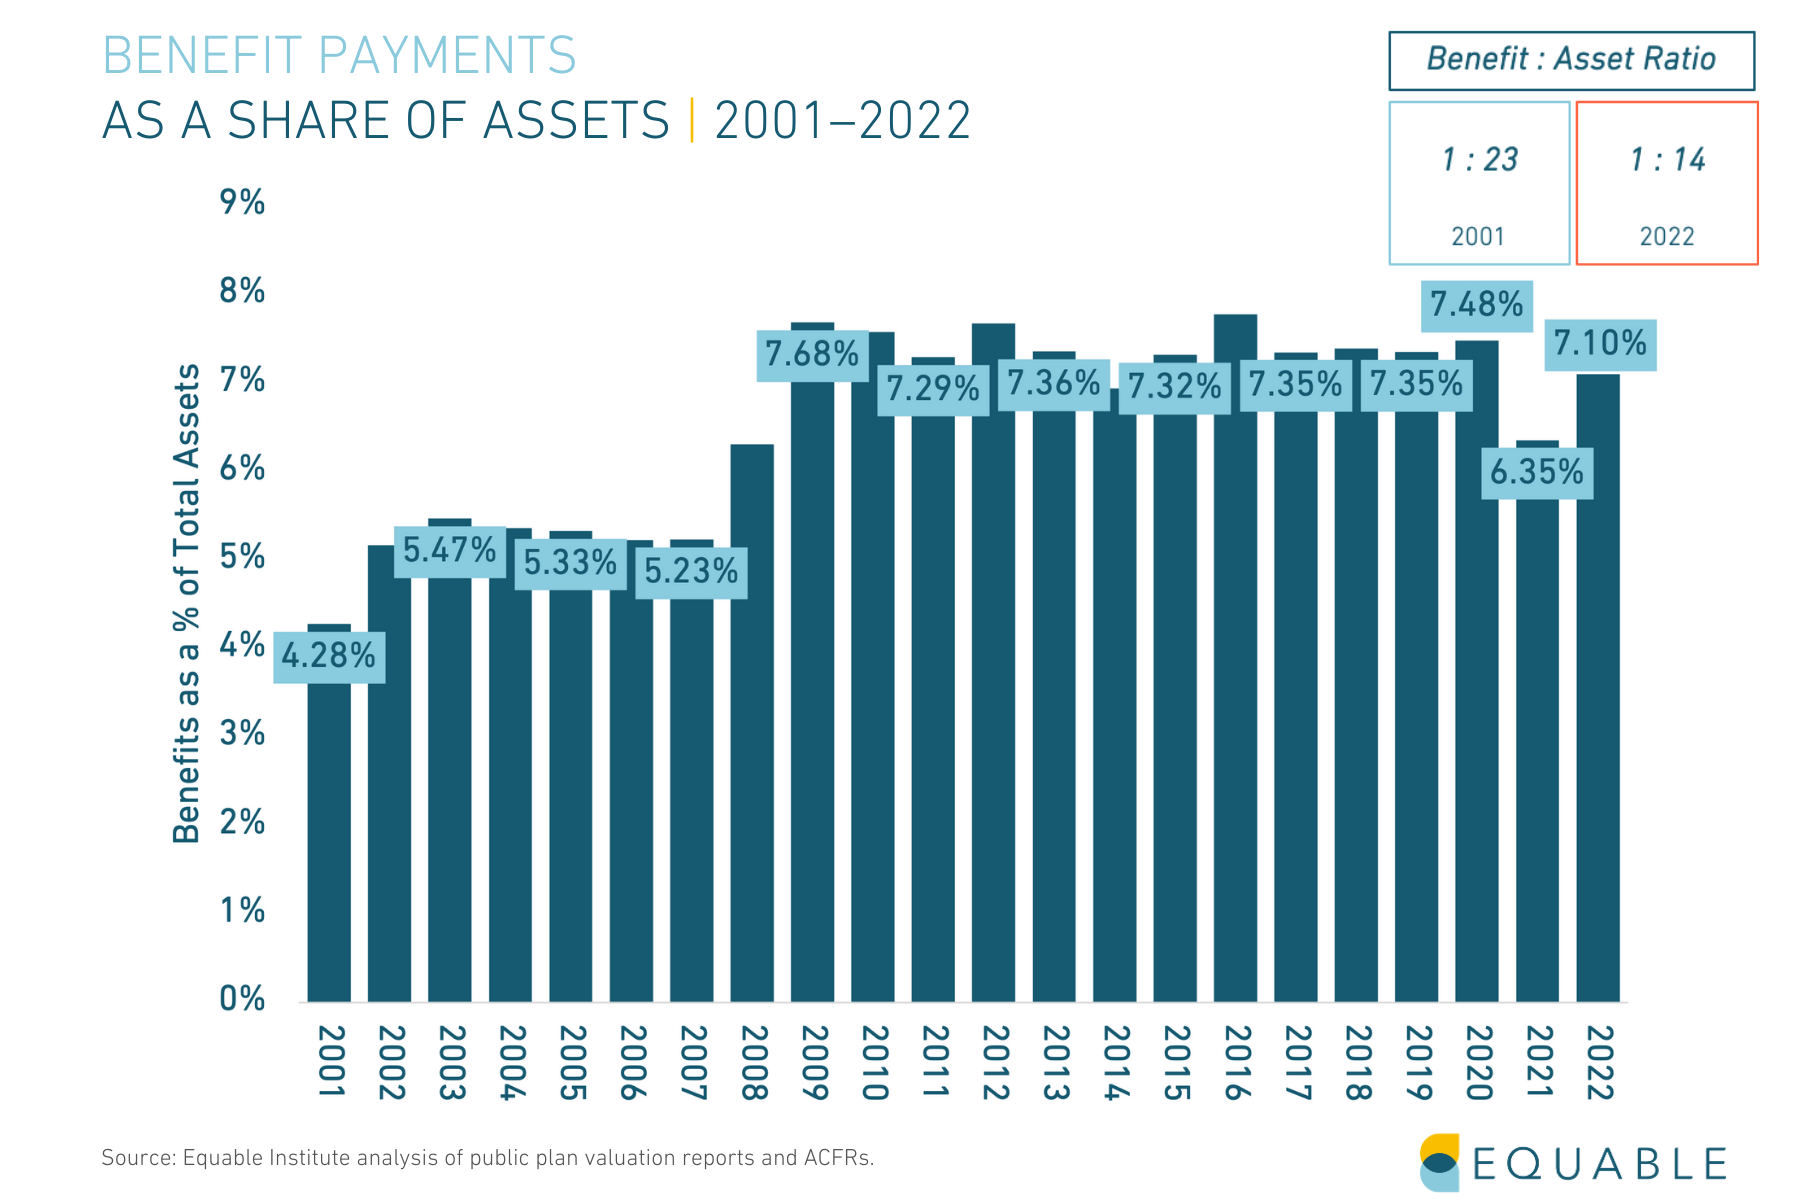
Because investment returns have been less than expected in most years during the past two decades and asset values haven’t kept up, the ratio of benefits to assets has been trending down since 2001. This is a vicious cycle because negative cash flow from contributions puts additional pressure on plan investment returns to meet or exceed expectations.
And, as the Benefit to Asset measure of liquidity shifts toward 1:1, pension fund managers will find it increasingly harder to make investment decisions. There will simply be fewer assets that can be invested flexibly.
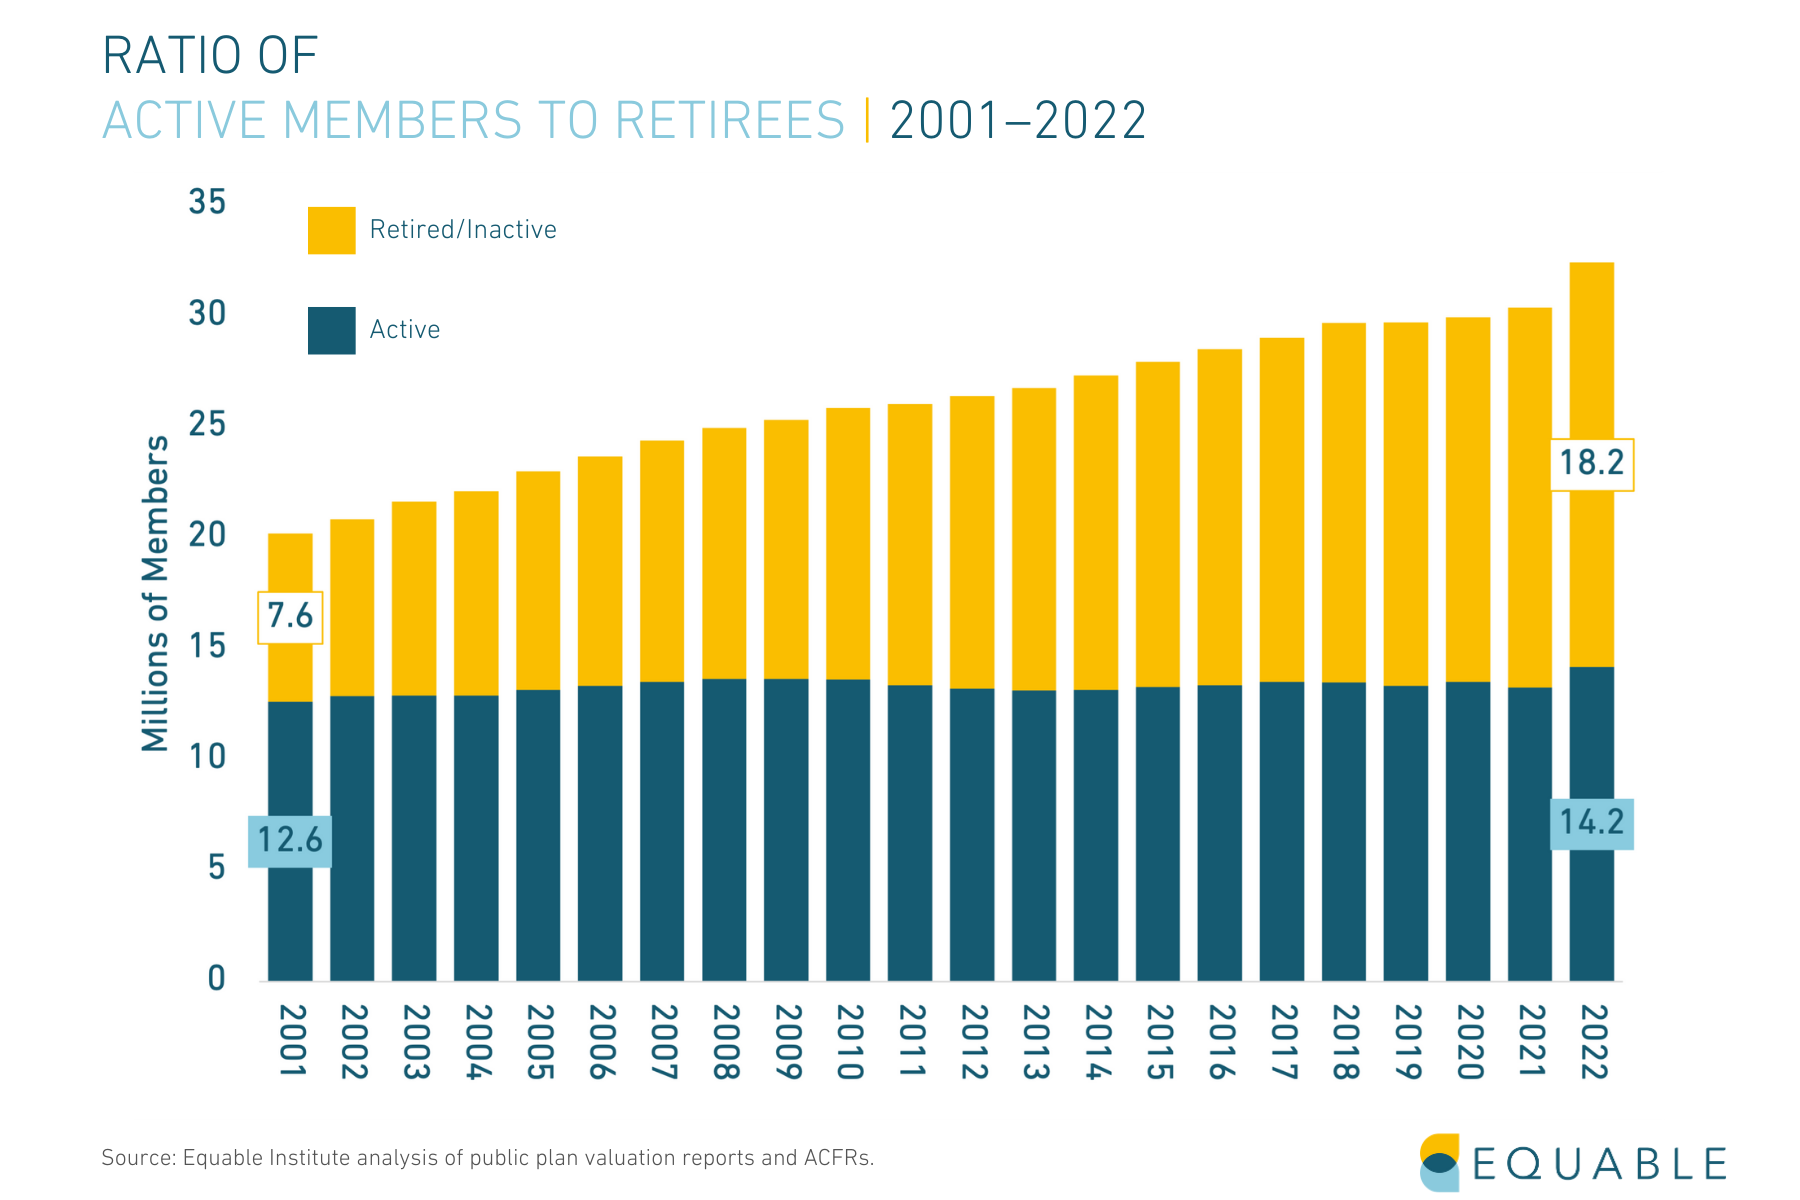
Total retirees passed active members for the first time in 2015. This is driving ever-increasing benefit payments.
Looking to the Future
It will be very difficult (in some cases impossible) for public plans to invest their way back to fiscal health. Contributions are being fully consumed by benefit payments, and pension funds are relying on investment returns to make up the balance (meaning less exponential investment growth) and pre-fund benefits for active members (which are not being fully funded, meaning continued unfunded liabilities). Each year investment returns underperform expectations, it perpetuates a vicious cycle.
We're here to help. Contact us for more information.
Additional Resources
State of Pensions 2023 Downloadable Data
Interested in exploring our data set? Download the raw data from the third edition of State of Pensions.
Read More
Explore More
Hidden Education Funding Cuts: How Growing Teacher Pension Debt Stresses America’s K–12 Education Budgets
There are lots of factors that new, prospective K–12 teachers have to consider when entering the education workforce. People typically pay the most attention to […]