Equable.org Learning Center Policy Institute

State of Pensions

State of Pensions 2022

Download the full State of Pensions 2022 report and fact sheets to dive deeper into the trends affecting public pensions.

The Year End Update to State of Pensions 2022 is now live. Read it here.

icon-equable-mark

State of Pensions 2022

Negative financial returns expose how vulnerable state and local plans are to market volatility.

What is the State of Pensions in 2022?

State retirement systems in America are still Fragile. 

This an annual report on the financial status of state and local public pension systems, put into a historic context. State and local governments face a wide range of challenges in general – and some of the largest are growing and unpredictable pension costs. The scale and effects of these challenges are best understood by considering the multi-decade financial trends and funding policy decisions that have brought public sector retirement systems to this moment.

There should be little surprise that America’s pension funds have taken a financial hit this year, swinging backwards the year following some of the best investment returns in history. Massive returns for public and private equity in 2021 didn’t clearly align with any kind of obvious market fundamentals signaling a persistent future of growth. The volatility and fragility of the past few years point to the clear reality: state and local retirement systems collectively are not going to invest their way out of their poor funded status. The primary path forward for most pension funds with fragile or distressed funded ratios will likely require assumption changes and contribution increases.

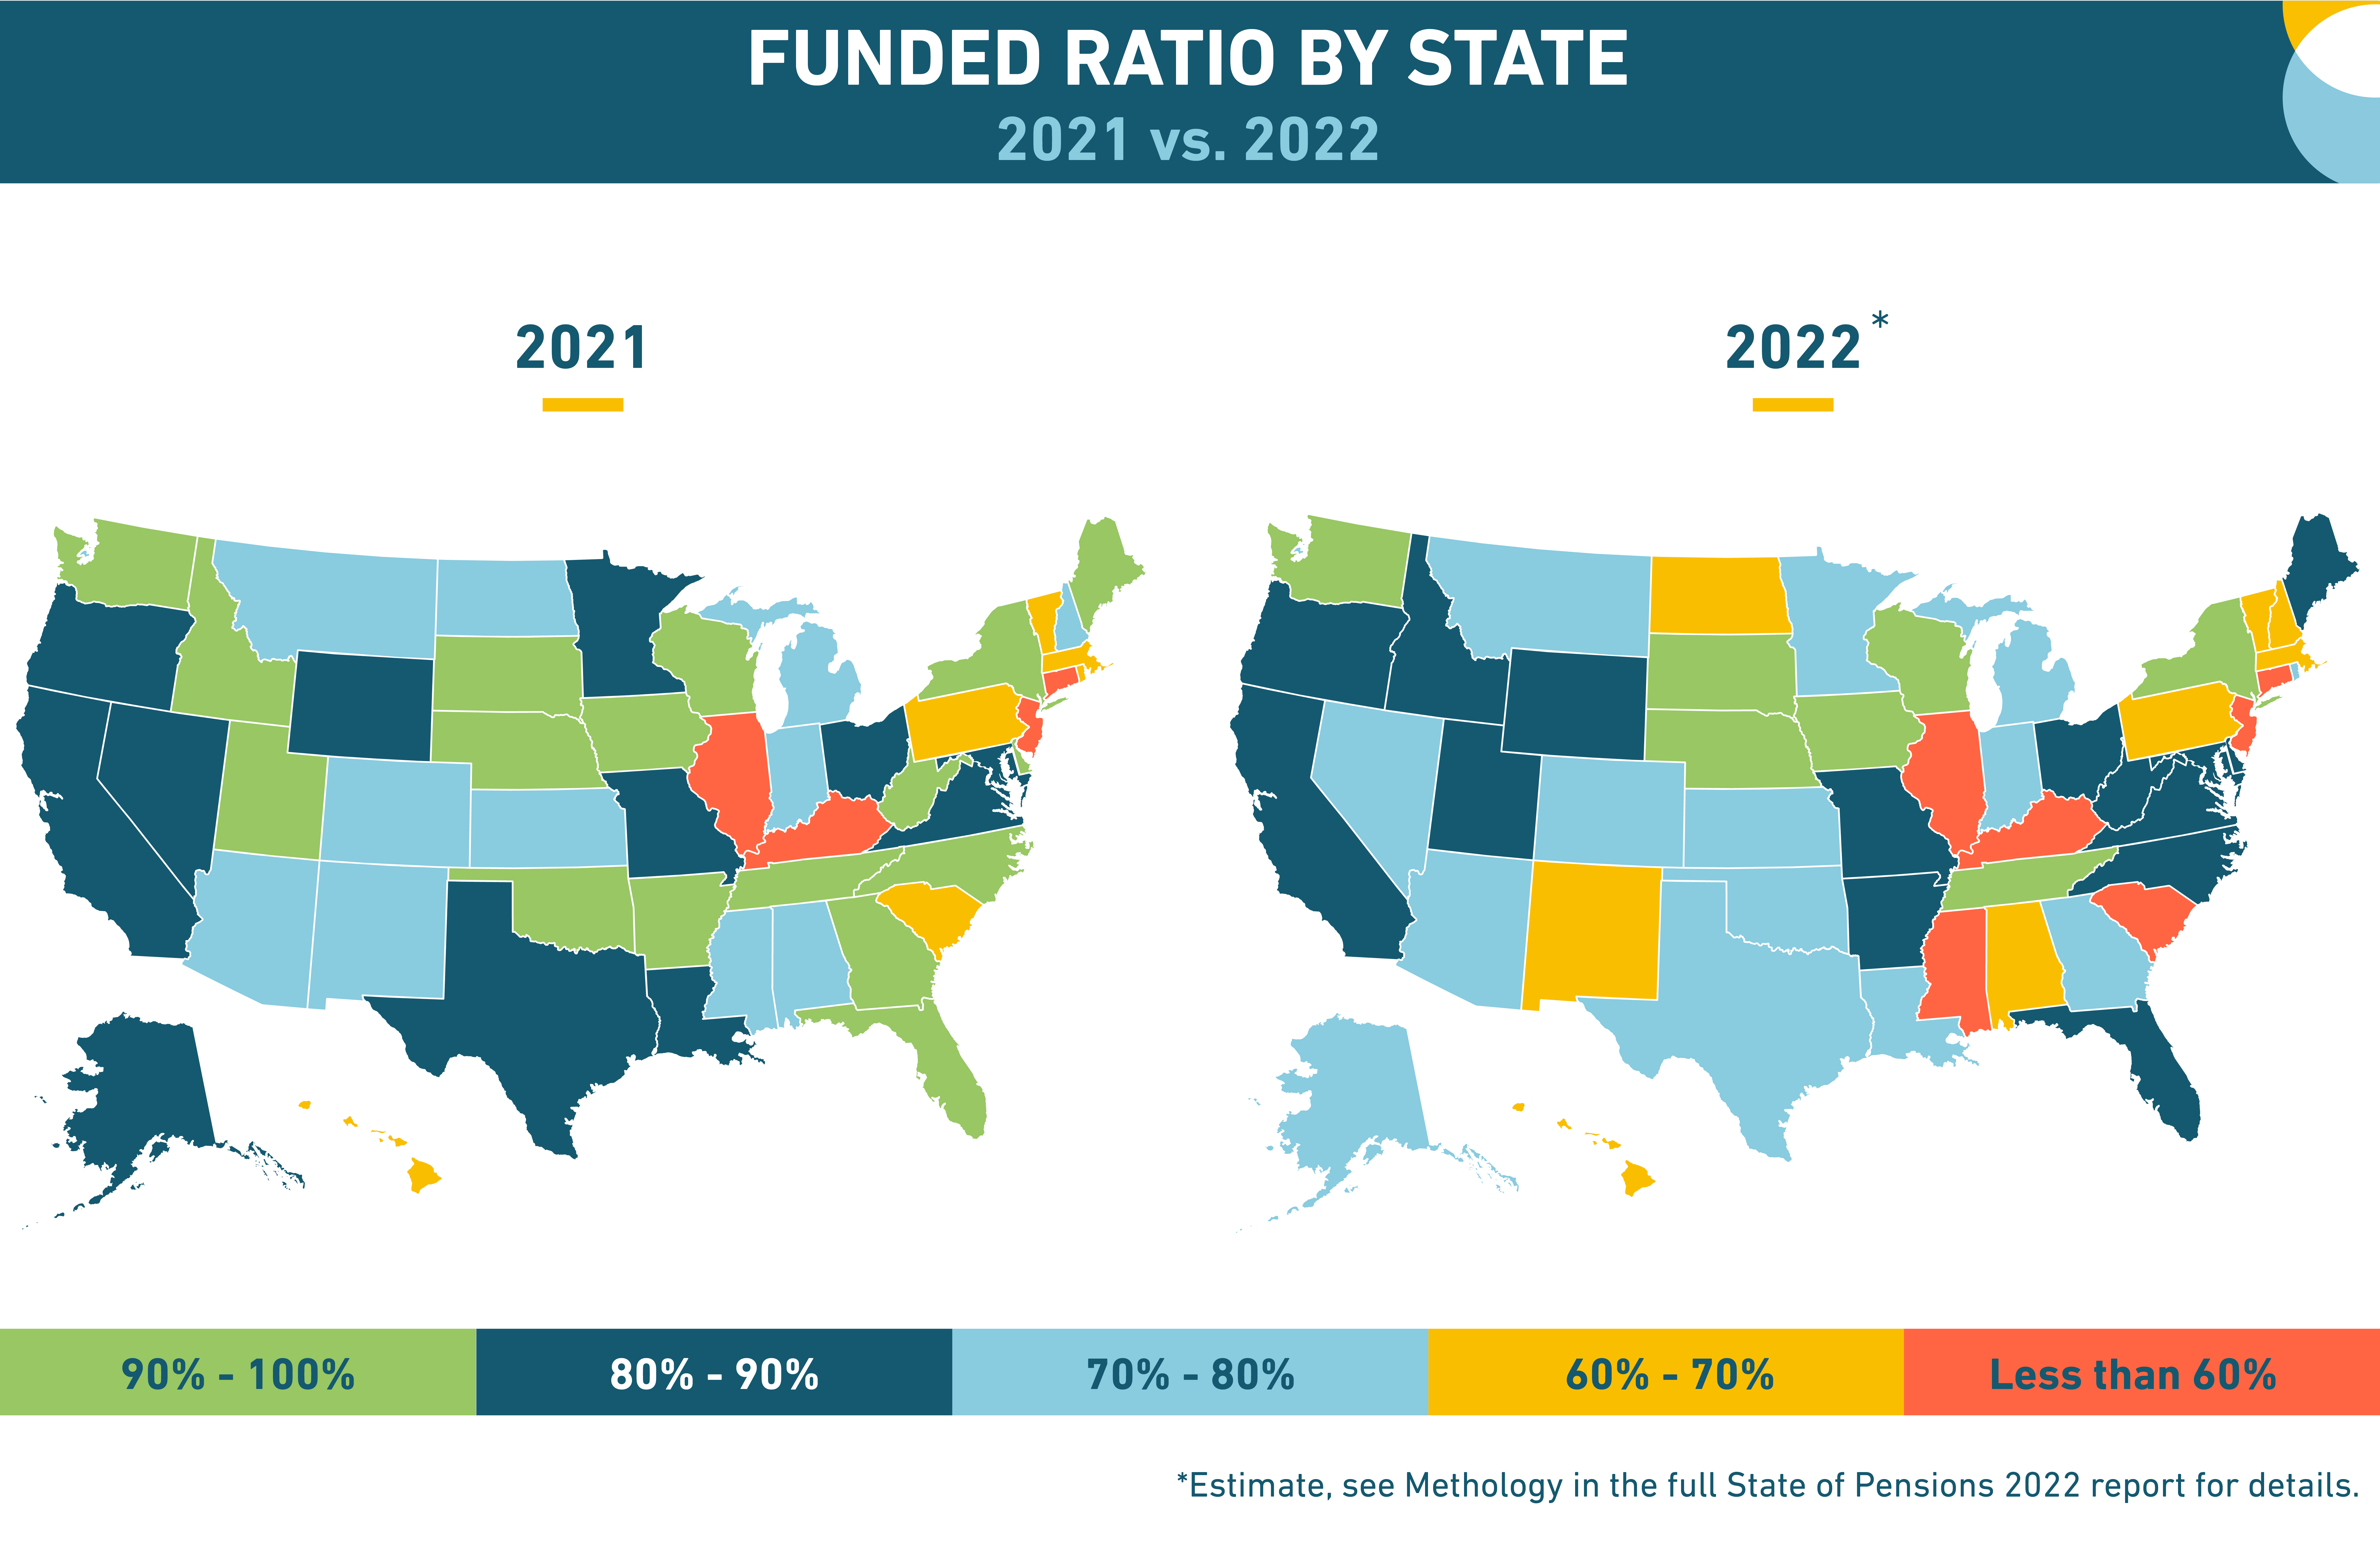
US Maps Showing Public Pension Funded Ratio by State for 2021 and 2022

So what are the trends in public pension funding in 2022? 

  • Despite state and local plans reporting disappointing preliminary investment returns averaging -6.14% in 2022 , there has been a net positive funded ratio trend on net over the past three years. 


  • Funded status in 2022 for state and local retirement systems has declined considerably from last year, the sharpest single-year decline since the Great Recession and financial crisis. Investment return volatility is contributing to some significant swings in funded levels, which has been compounded by rising inflation and geopolitical turmoil. 


Positive Trends

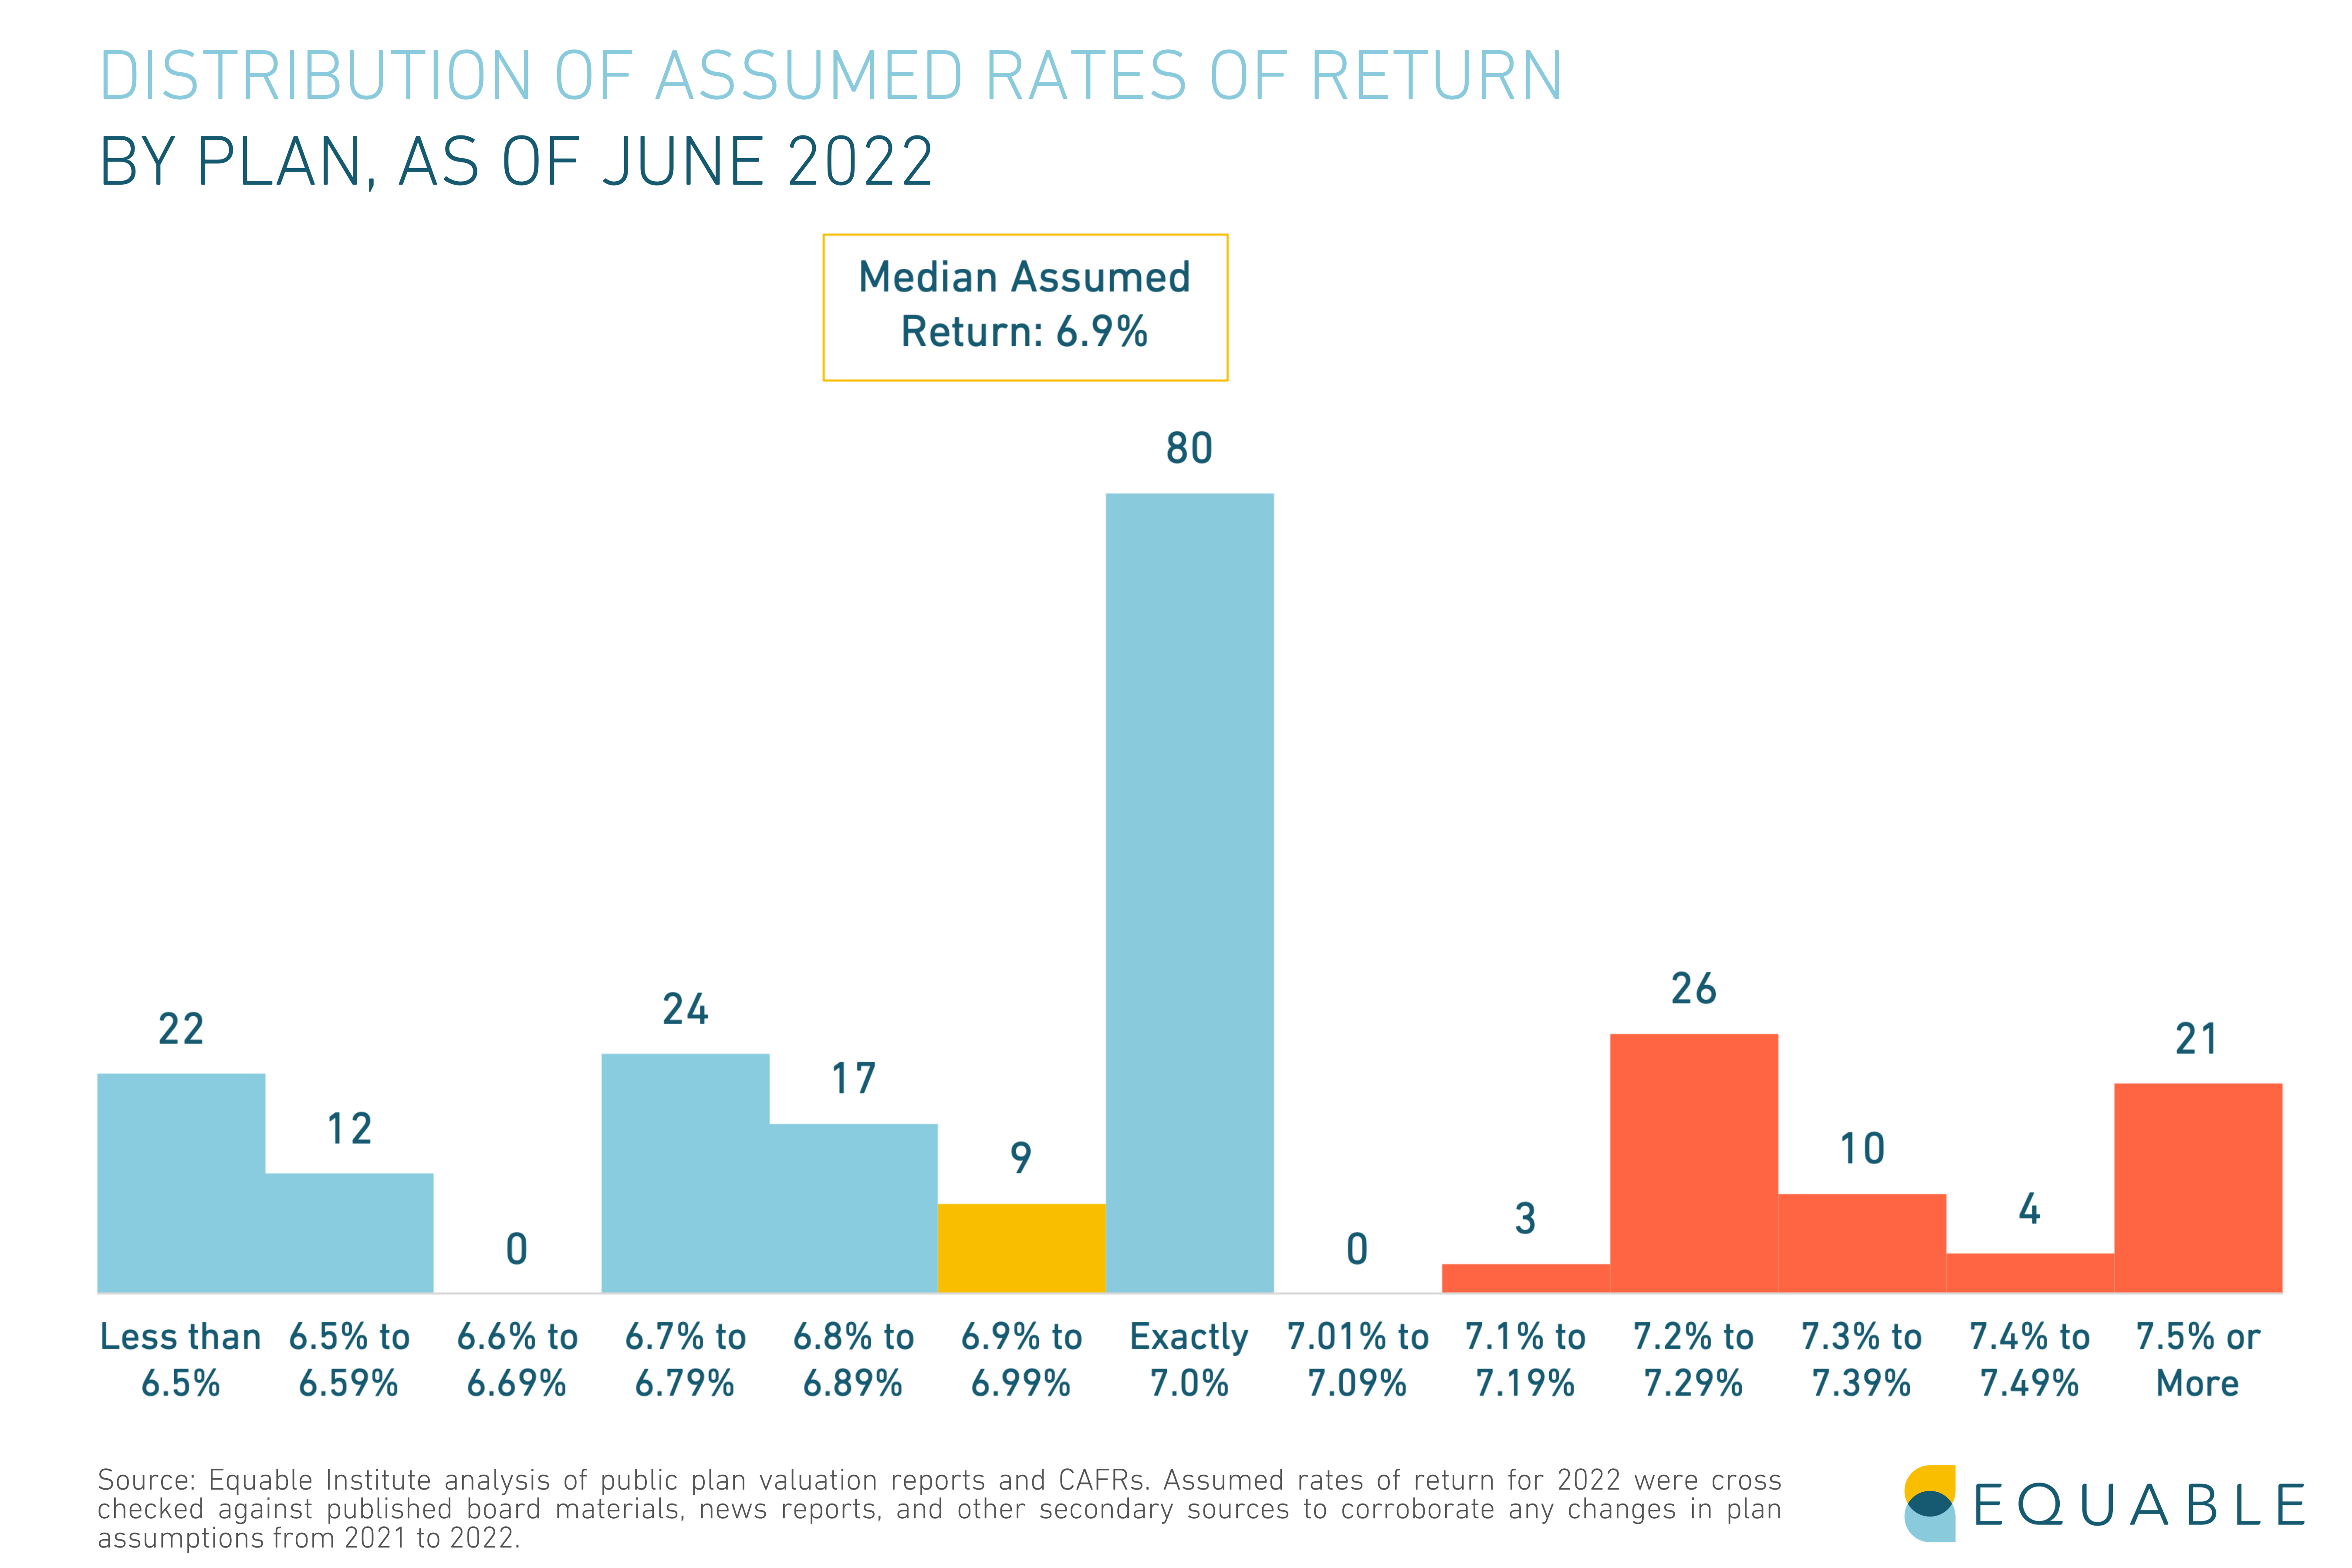
  • Funding Policies: There are now 84 state and local plans that assume investment returns below 7%, as of announcements through June 2022. This is up from 65 plans expecting 7% or less as of their 2020 valuations. Just 9.2% of state and local plans have assumed returns 7.5% or more. Many states have also made one-time supplemental contributions using supplemental funds, rainy day funds, and budget surpluses to make one-time contributions into state pension funds to shore up their funding levels and buy down their assumed rates of return. 
  • Paying the Bills: While a few states did not fully fund their required contributions in 2021, on net states collectively paid closer to the actuarially determined rates (99.8% in the aggregate) than in any year since 2001.

Negative Trends

  • Investment Returns: Preliminary 2022 investment returns are -6.14% on average for state and local plans, after once-in-a-century investment gains in 2021 (25.3% on average). All plans will fail to achieve their assumed return (6.9% on average based on current policy). The net result is the largest single-year decline in assets since 2009
  • Funded Ratio: Poor returns have contributed to a decline in the projected funded status of state and local plans. In 2022, we expect the aggregate funded ratio to decline to 77.3% and total unfunded liabilities to increase to $1.45 trillion, up from $986.6 billion in 2021. This is a loss of roughly half of last year’s improvement. Within the states, funded ratios and unfunded liability levels continue to vary considerably from state to state. The vast majority have a Fragile or Distressed funded status
  • Asset Allocations: Asset allocations continue to shift toward risky alternatives, including private equity, hedge funds, and real estate as pension funds attempt to invest their way out of their funding shortfalls. The share allocated to hedge fund managers and private equity strategies has grown to 14.9% (from 8% in 2008.)
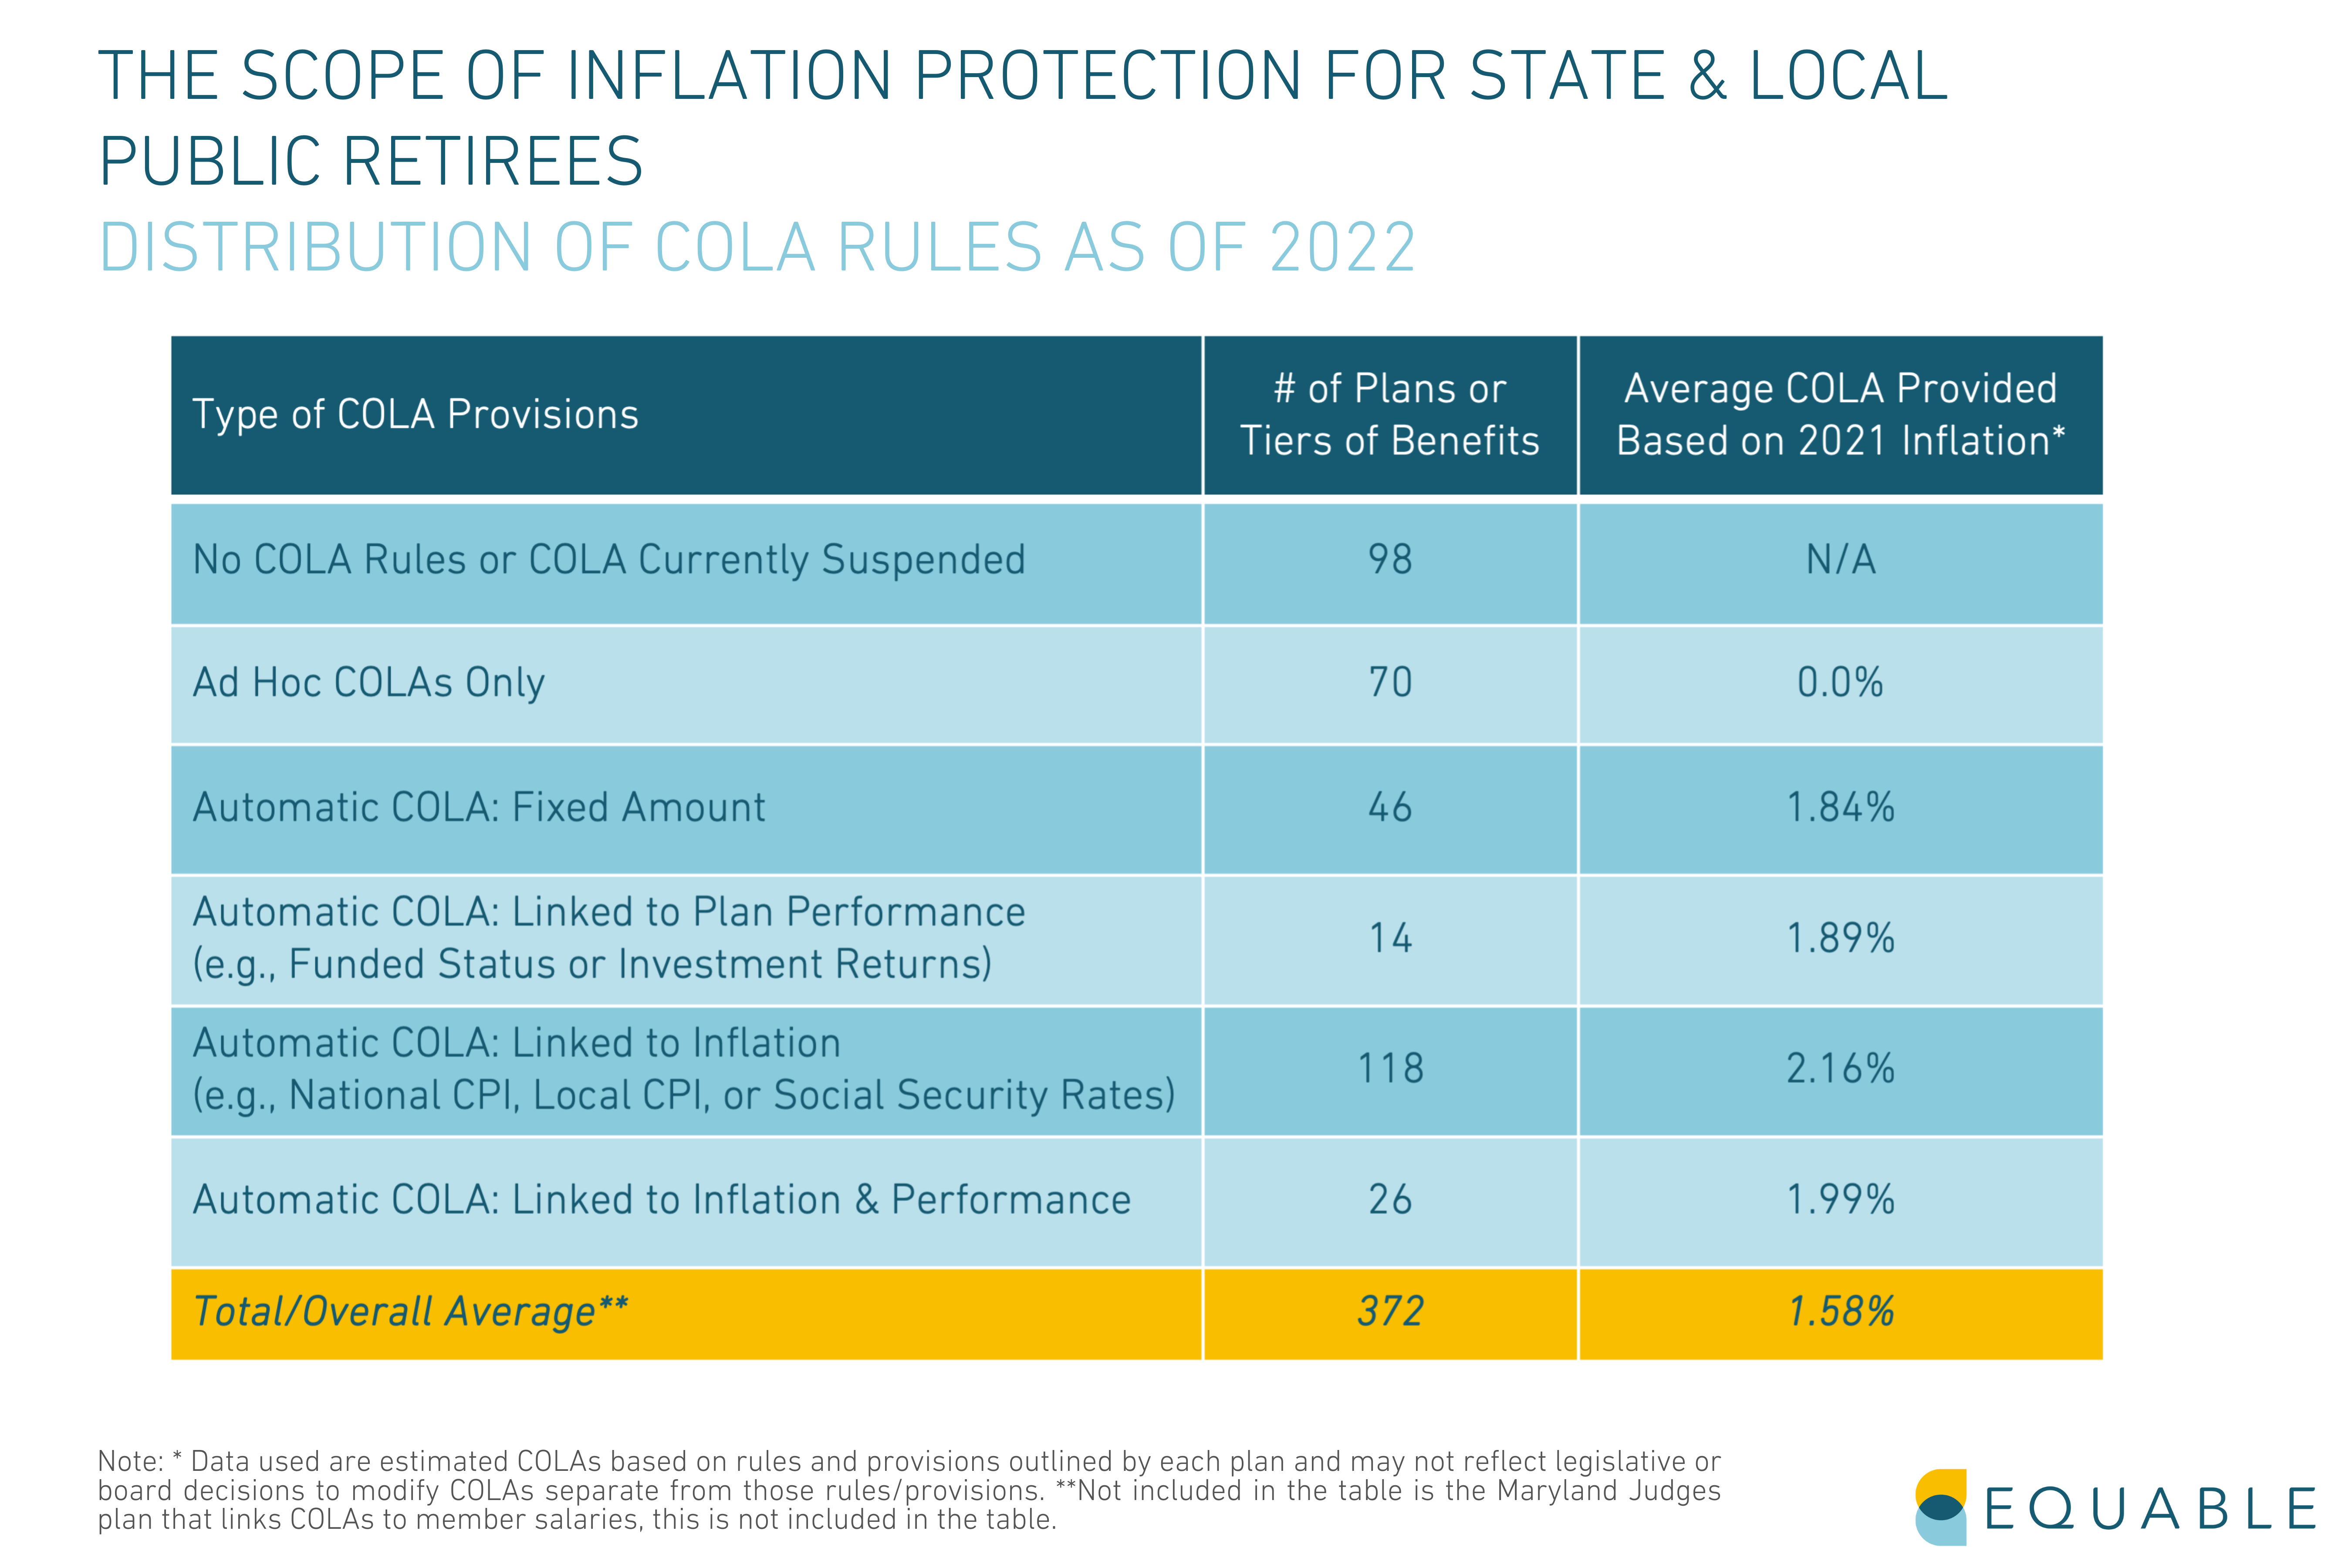
  • Impact of Inflation: Public retirees may be more exposed to inflation than many assume, given the limited cost-of-living adjustment provisions that are available across the country. 168 plans included in our database do not offer or guarantee retirees a COLA. For plans that do offer inflation protection, the average COLA is 1.58% in 2022, which is significantly less than the estimated 8.6% rate of inflation (CPI as of May 2022) nationally. 
  • Contribution Rates: Negative trends from the past decade continue to persist for both member and government employer contribution rates. 
  • Cash Flows: As demonstrated by the first half of 2022, it is going to be harder and harder to earn large investment returns going forward. This will put a lot of pressure on state retirement plans that are cash flow negative from growing benefit payments.

The Effect of On-Going Global Conflict

Prior to Russia’s invasion of Ukraine in March 2022, state and local pension funds held assets, securities, real property, and other financial interests directly invested in Russian or Belarusian markets worth an estimated $5.7 billion

Efforts to divest from Russian assets were formally adopted in 23 states, including:


  • 24 retirement system boards or state investment boards that voluntarily voted to divest.


  • 3 state treasurers or comptrollers who ordered divestment as sole fiduciaries. 


  • 6 state legislatures that adopted legislation directing divestment by all state pension funds.


The primary effect of the Russian-Ukraine war has been to put downward pressure on financial markets generally.

National Trends

State and local pension plans have reached historic levels of investments in private equity and real estate — doubling down on what has become a high-risk, high reward dilemma for trustees.

This paid off in 2021 but caused a lot of pain in 2022. In an era of volatile financial markets, pension funding is all about risk exposure and riskmitigation.


Asset allocations have shifted away from relatively safe fixed income investments into riskier categories in a search for stronger investment returns.

Notably, private equity investments are now more than 10% of portfolios — or, at least, they were at the end of 2021 before valuations crashed over the last six months.


Average investment returns were consistently below assumed rates of return over most the past decade. This contributed to the growth in unfunded liabilities for public plans.

We estimate 2022 returns will average -6.0% (for plans through June), which would be the first time since 2009 that state and local plans will post a negative average. Combining 2021 and 2022, the average ten-year return is 7.5%, which is fortunately still above the average assumed return (6.9%).

Fortunately, since 2019 the 10-year average return has remained above assumed returns, and this has helped stabilize funded levels.


The aggregate funded ratio for statewide and municipal plans collectively has lost about half of its gains since 2021. This is the largest single year decline in funded ratio since the Great Recession. 

The change in funded ratio over the past three years is also the sharpest period of volatility since the financial crisis.


The pension asset shortfall for statewide plans declined in 2021 to the lowest amount since the financial crisis but then grew in 2022 to again eclipse $1 trillion in total unfunded liabilities.

Total unfunded liabilities for state and municipal plans exploded from $248.8 billion in 2007 to $1.35 trillion at the end of 2009. The funding shortfall increased to a peak of $1.70 trillion in 2020 before dropping back to $933.0 billion in 2021.

We estimate that unfunded liabilities will increase again up to $1.45 trillion in 2022 due to market underperformance.

State and local employee contributions to their own retirement plans have been steadily increasing.

Public sector workers who are also enrolled in Social Security paid 160 basis points more(a 36.5% increase) during the 2022 fiscal year than they did during the 2001 fiscal year and 23.7% more than they did in 2008 before the financial crisis.

Those who do not participate in Social Security paid 14.3% more this year than in 2001 and 10.1% more than 2008.


Note: Public employees are not uniformly covered by Social Security. Some states never opted into Social Security, and therefore typically have higher valued benefits and relatively higher contribution rates than for statewide systems where members also have access to Social Security benefits.


Government employer contributions have steadily increased over the past two decades, mostly because of increased unfunded liability amortization payments.

Combined state and local employer contributions in 2001 were 9.02% of payroll. During the fiscal year ending 2022, employer contributions are 30.43% of payroll.


Negative net cash flows from contributions and benefit payments have steadily increased over the past two decades, reflecting more “mature” pension plans.


There are 64 plans with assumed rates of return above the current 6.9% median, including 21 plans with a 7.5% returns assumptions or higher.


There are 80 plans with a 7% assumed return, a category that included CalPERS until July 2021 (when they announced a shift to 6.8%).

Among the 84 plans that are ahead of their peers in adopting more conservative return assumptions, just 34 have assumed returns 6.5% or less.

Within the Trends: State & Local

Some states are performing better on their funded status than others. Factors among the better performing states include: ramping up contributions, adopting risk-sharing policies for pension plans, and historically strong funding policies.


The state by state weighted average funded ratios as of the fiscal year ending 2021 looked as strong as they’ve been in more than a decade.

Among all statewide plans, 153 out of 167 have reported their final 2021 figures. Among local plans 42 out of 61 have reported their 2021 data.


There is likely going to be a considerable decline in funded status among most state and local pension funds in the 2022 fiscal year, leading to a decline in aggregate state funded ratio averages.

Of the 94 plans with a funded ratio above 90% in 2021 reported data, we estimate 23 will decline into the 80%s or 70%s.

We also estimate there will be 3 plans that fall from Fragile into Distressed funded status based on 2022 returns.


Financial market volatility has meant most plans saw reduced funded ratios from 2019 to 2020, then sharp increases in 2021, and now a balancing out with weak 2022 investment performance.

There will be varied levels of funded ratio change from 2019 (pre-pandemic) to 2022 once final plan numbers are available. However, it’s likely that in 2022 most aggregated state funded ratios will be in a better condition compared to 2019.

The funded ratio is a quick first look at the health of a pension plan but isn’t the only factor to measure. Actuarial assumptions, funding policies, and governance also matter.

A pension plan’s funded ratio might have dipped because the pension board adopted more realistic actuarial assumptions.
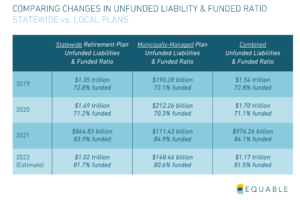
 

The funded ratios for state and local plans also have tended to move together, as the same dynamics of underperforming investments and changes to actuarial assumptions have influenced overall finances.

Most public pension unfunded liabilities reside within statewide retirement systems, primarily because they are simply larger, with more members and more promised benefits.


The aggregate funded ratio for municipally-managed plans in 2021 was collectively near its highest point in recent history.


The aggregate funded ratio for statewide plans collectively is below 2008 levels. However, the trend from 2019 to 2022 still shows improvement, even despite losses in 2022.

Spotlight: State of Inflation Protection

Are COLAs Keeping Up With Inflation?

Among the states that do have COLA rules, only a select group of public retirees have a reasonable hope that their pension benefits will keep up with inflation: those with automatic fixed-rate COLAs or automatic COLAs linked to inflation.

There are generally three policy frameworks for those who do have automatically granted COLAs:

  • Fixed-Rate COLAs: A pre-fixed specific percentage of benefit increase (or minimum dollar amount).
  • COLAs Linked to Inflation: A percentage increase to benefits based on the national consumer price index (CPI), a local CPI, or the Social Security inflation rate. The actual amount is typically “up to” a maximum rate, such as 2% or 3%.
  • COLAs Linked to Plan Performance: A percentage increase to benefits that is dependent on the funded ratio and/or investment performance of the underlying pension plan. The actual amount is also typically “up to” a maximum rate, but that maximum rate is determined by the specific provisions around plan performance. For example, the maximum COLA rate may be cut in half or suspended if the pension fund is under 80%.


Inflation protection is important for ensuring benefits continue to provide retirement income security as intended.

State and local pension plans and hybrid plans currently provide a wide range of cost-of-living adjustment (COLA) rates and rules. Most plans have linked COLA rates to inflation, but roughly 168 of state and local pension plans do not have automatic COLAs.

Looking to the Future

We anticipate contribution rate increases continuing to grow as states, cities, counties, and school districts try to grapple with their unfunded liabilities. One of the drivers will be a continued decline in the average assumed rate of return — a policy move that will be positive for state and local pension plans in the long-run, but budgetarily painful in the short run. Demographic turnover will continue to put pressure on cash flows, which could lead to added budgetary challenges too.

Two factors that remain unclear at this time: 

1) Whether public pension fund investment managers will continue to push into alternative investment categories like private equity, or if the lower assumed return rates will lead to a reassessment of how assets are distributed; and 

2) Whether the numerous supplemental payments made by states into their pension funds over the past year will have a meaningful influence on the trajectory of plan funded status.

We're here to help. Contact us for more information.

Additional Resources

State of Pensions 2022 Downloadable Data
Interested in exploring our data set? Download the raw data from the third edition of State of Pensions.
Read More
State of Pensions 2022: FAQ
Have questions about our findings and methodology? Read our FAQ.
Read More
State of Pensions 2022: October Update Data
Download the updated data covering funded ratio, unfunded liabilities and investment returns from the State of Pensions October Update.
Read More
State of Pensions 2022: Year End Update Data
Download the updated data covering funded ratio by state and by plan, unfunded liabilities and investment returns from the State of Pensions Year End update.
Read More