Share

State of Pensions 2020
The fragile state of public sector pension funds coming into 2020 has left them exposed to the pandemic’s financial effects
What is the State of Pensions in 2020?
This an annual report on the status of statewide public pension systems, put into a historic context. State and local governments face a wide range of challenges in general – and some of the largest are growing and unpredictable pension costs. The scale and effects of these challenges is best understood by considering the context of multi-decade financial trends that have brought public sector retirement systems to this moment.
While the concrete effects of the COVID-19 pandemic are not fully known, we can’t ignore the reality that the pandemic will have a negative influence on pension plans. There will be economic effects on state governments that lead to underfunding of employer contributions. There will be (and have been) financial effects on pension fund investment returns. To anticipate how the novel coronavirus will exacerbate financial threats to public pensions, this report also looks at patterns of behavior following the Great Recession as a guide to what might happen in the coming decade.
The figures shown below have been updated to reflect preliminary investment returns through September 30th, published in the December Update to State of Pensions 2020.
So what are the trends in public pension funding in 2020?
- The total funded ratio for statewide pensions is near its lowest point in modern history. This is despite a decade long bull market from 2009 to 2019 driving up pension assets and record levels of contributions into those pension funds.
- While a few statewide pension plans recovered from the Great Recession, the majority of retirement systems have entered this next recession in a weaker position than they were going into the last recession.
Positive Trends
- Funding Policies: Some states have been making strides toward improving the resilience of their pension plans, adopting various kinds of risk-sharing policies and contribution rate ramp-ups.
- Paying the Bills: Plus, after decades of states failing to ensure they were paying at least the actuarially determined contribution rates, in 2019 states as a group paid nearly 100% of required contributions.
Negative Trends
- Contribution Size: However, those contributions represented the highest actual employer contribution rates in history (27.94% of payroll), and employee contributions have also grown to 6.7% of payroll.
- Interest Rates: The decline in interest rates over the past few decades has had significant, negative effects on pension plans. Returns from relatively safe fixed income investments have declined, leading to states shifting their asset allocation to private equity, hedge funds, and real estate.
- Assumed Returns: Meanwhile, the average assumed rate of return has declined relatively slowly. Only a few states have made meaningful steps away from relatively high assumed returns.
- Cash Flow: It is going to be harder and harder to earn investment returns going forward. Most major capital market forecasts project a decade of average returns well below the 7.2% statewide pensions are assuming. Plans are cash flow negative from contributions and benefit payments. And the available asset base to earn investments from is trending down.
The National Trends
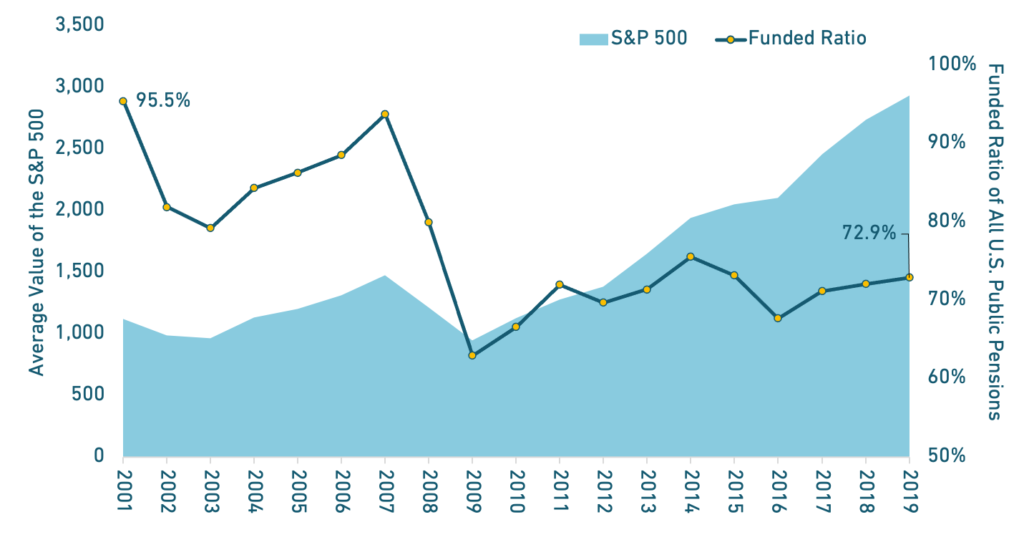
The aggregate funded ratio for statewide plans collectively is near its lowest point in modern history.
We estimate the average funded ratio will decrease from 72.9% in 2019 to 69.4% in 2020. This sharp decrease in funding can be attributed to market losses caused by the COVID-19 pandemic.
The pension asset shortfall for statewide plans keeps growing. At the end of 2019, there was no net recovery from losses during the Great Recession and Financial Crisis.
Total unfunded liabilities for statewide plans in 2001 were roughly $100 million. The shortfall was $1.16 trillion at the end of 2009, and $1.34 trillion in 2019.
States with some of the most visible pension funding challenges, like New Jersey, Kentucky and Illinois have the largest unfunded liabilities relative to their state’s GDP.
Funded ratio and unfunded liability levels on their own are not perfect indicators of plan health.
Understanding the size of unfunded liabilities relative to the size of a state’s economy gives a sense of what scale of resources will be needed from a local tax base to improve funded status.
Average investment returns were consistently below assumed rates of return over the past decade. This contributed to the growth in unfunded liabilities for public plans.
Strong returns during the past few years increased the 10-year rolling average above the assumed return line.
Asset allocations have shifted away from relatively safe fixed income investments into riskier categories in a search for stronger investment returns.
“Alternative” investments include private equity, hedge funds, real estate, commodities, and tactical asset allocations.
Employee contributions to their own retirement plan have been steadily increasing.
Cumulatively, public sector workers are paying 130 basis points more (an 18% increase) during the 2020 fiscal year than they were during the 2001 fiscal year.
Government employer contributions have steadily increased over the past two decades, reaching 20.9% of payroll in 2020.
Growing unfunded liability amortization payments have driven the rise in employer contribution rates.
Negative net cash flows from contributions and benefit payments have steadily increased over the past two decades, reflecting more “mature” pension plans.
Negative cash flows have increased from -$30 billion in 2001 to -$101 billion in 2019.
Effects of COVID-19
The COVID-19 pandemic will have two effects on public retirement systems:
- First, financial losses and general volatility will prevent pension funds from earning their assumed rates of return. This will add unfunded liabilities.
- Second, the economic recession will reduce tax revenue for state and local governments, putting pressure on their budgets while public health costs are increasing. This will lead to states and cities taking actions that reduce their near-term pensions costs:
-
- Reducing government contributions into pension funds
-
- Increasing contribution rates from employees
-
- Reducing benefits (where legal), such as cutting retiree COLAs
States with higher funded ratios were affected by the March 2020 market crash more than poorly funded states because the better-funded plans had more assets to lose. Many plans bounced back from the asset shock, but they will likely report underperforming against their assumed returns for the fiscal year ending 2020.
Equable estimates the average investment return for statewide plans as of June 30, 2020 is -1.1% based on the most recent asset allocation reports from each plan. This is 600 basis points below the average 7.17% assumed return for the fiscal year.
Funded Ratio Relative to Post-Great Recession Bull Market
Despite the run-up for financial markets between 2009 and 2019, statewide pension funds are entering the COVID Recession at a lower funded status than going into the Great Recession.
It is reasonable to expect over the next few years similar patterns of state budgeting behavior that was seen after the Great Recession. This means statewide plans are facing a very real risk of further funding status erosion even if financial markets bounce back.
Historic Context: Post Great Recession Trends
- From 2008 to 2010 there was a drop off in the percentage of required contributions that was actually paid by state governments (Page 36), driven by low tax revenues and budget constraints.
-
- States began to improve their funding practices in 2013 and 2014, around five years after the recession ended.
- Unfunded liabilities jumped because of losses during the Financial Crisis and grew steadily in the decade that followed. This led to a steady increase in employer contributions, doubling from 14.01% to 28.05% as a percentage of payroll between 2009 and 2019 (Page 11).
-
- The funded ratio average leveled off between 2011 and 2019. But remaining perpetually underfunded has contributed to ever growing costs.
- States turned to member contributions to help pay for increasing costs following the Great Recession (Page 10).
-
- Within six years of the Great Recession, employees were paying 0.5% (50 basis points) more from their paychecks for the same (or lessor) benefits, with the average increasing from 5.84% to 6.33% of payroll.
- A positive trend (from the perspective of long-term resilience) was in the decline of assumed rates of return (Pages 27, 29, 30). But states did not start making these moves until around three to four years after the end of the Great Recession.
- States increased their asset allocations to higher risk, higher reward investments, starting in 2008, to try and increase returns (Page 9).
- States also pursued various changes to benefits that would reduce their long-term costs, including the reduction or elimination of cost-of-living adjustments.* Sometimes these changes were for new members, other times (where legal) they were for active employees and/or retirees.
So, What Does Post-COVID 19 Pension Funding Look Like?
- We expect that the negative effects of the pandemic on pension funds will accelerate the upward trends of:
-
- Unfunded liabilities (lower returns compared to investments; states reducing actual contributions),
-
- Unfunded liability to GDP ratios (both because of growing pension shortfalls and economic contraction),
-
- Asset allocations shifting to riskier investments (in a search for better yields),
-
- Actuarially required contribution rates (because of increased unfunded liabilities), and
- Retiree-to-active member ratios (because states are likely to lay off employees or slow down hiring amid the recession).
- The pandemic will also accelerate the downward trends of funded ratios, investment performance, and COLA distributions.
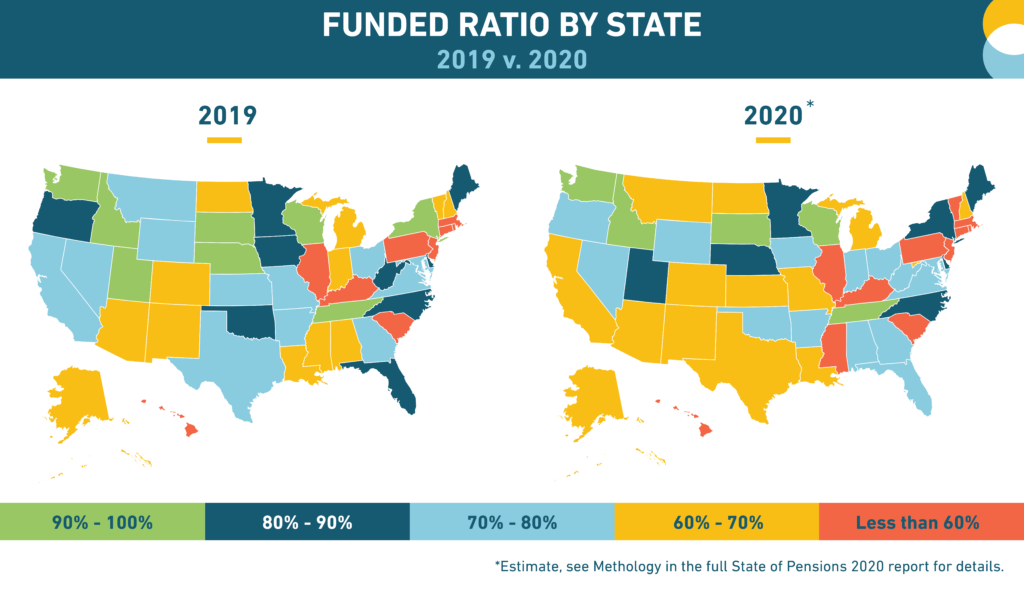
Within The Trends: Funded Status
While nationally, the funded status of public pension funds has trended downward in the aggregate, funded ratio and unfunded liability levels vary considerably from state to state.
Funded status matters because it reflects both the solvency of a pension fund and the underlying costs of providing the benefit.
There is no inherent reason that a pension fund needs to be exactly 100% funded every year. The funded level of a plan will fluctuate over time. However, if a pension fund remains at 70% or 80% funded perpetually, the costs of funding benefits will grow.
A small group of states have historically Resilient statewide pension systems — including SD, WI, NY. There are also a few recently created pension plans with strong funded status (ex. AZ Public Safety “Tier 3” and MI Teachers “Pension Plus 2”) that are a part of otherwise fragile or distressed retirement systems. But less than a quarter of major statewide plans (23%) as of 2019 are above 90%.
Most statewide plans (58%) as of 2019 are Fragile, with a funded ratio between 90% and 60%. Most of these plans took a hit during the 2008-09 financial crisis and while their assets recovered, they didn’t recover fast enough to catch up with still growing liabilities. The fact that only a third of plans below 90% as of 2009 were able to rebound from their asset shock suggests a structural vulnerability to additional asset shocks, like the COVID-19 market crash in March 2020.
A handful (18%) of statewide plans are Distressed and face a considerable uphill climb to recovery. The costs of paying down unfunded liabilities for these plans (e.g. IL Teachers, KY State) are challenging for state budgets, but the costs of insolvency and shifting to “pay-as-you-go” could be even more expensive.
The five largest states by unfunded liabilities have a shortfall ($691 billion) that is roughly the same the rest of the country combined ($653 billion).
Unfunded Liability History Grouped by State, 2001-2019
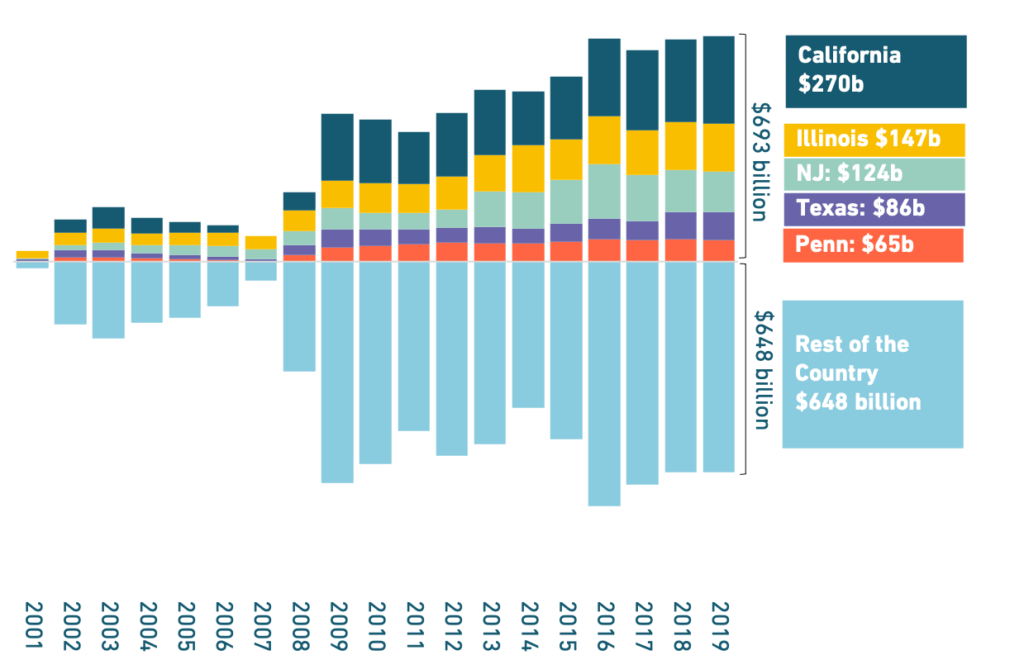
CalPERS unfunded liabilities ($158 billion) are 12% of the nation’s total statewide pension plan funding shortfall. Illinois TRS unfunded liabilities ($81 billion) alone are larger than nearly any other single state’s funding shortfall.
Since the peak of public sector funded status in 2001, there has been a major shift away from funding resilience. Nearly 3 out of 4 statewide plans 90% funded or better in 2001. Today only 1 in 5 statewide plans have that Resilient funded status.
Change In Funded Ratio For Statewide Pension Plans, 2001 – 2019
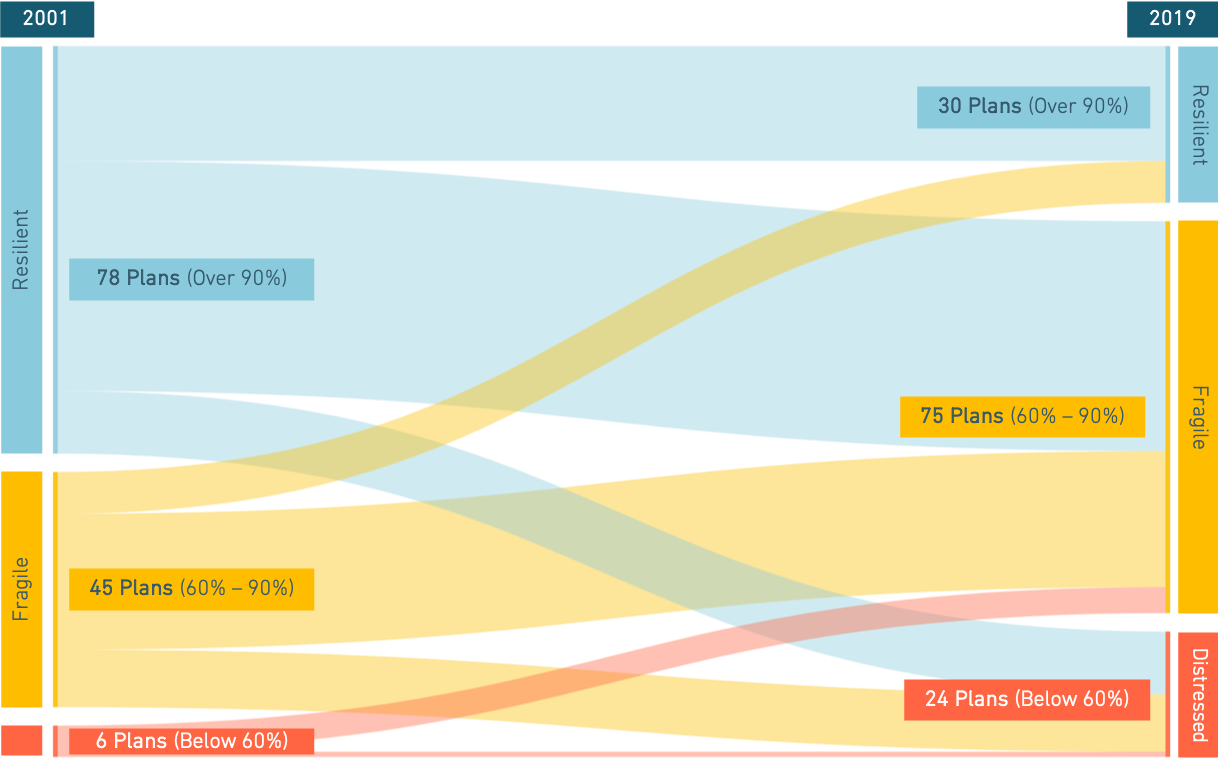
During these two points in time, a number of public plans stumbled after the Dot-Com recession, while some which were slowly recovering before the Great Recession hit have stagnated over the past decade.
Since the Great Recession, most statewide pension funds have either not improved their funded status or have gotten worse.
Change In Funded Ratio for Statewide Pension Plans, 2009 – 2019
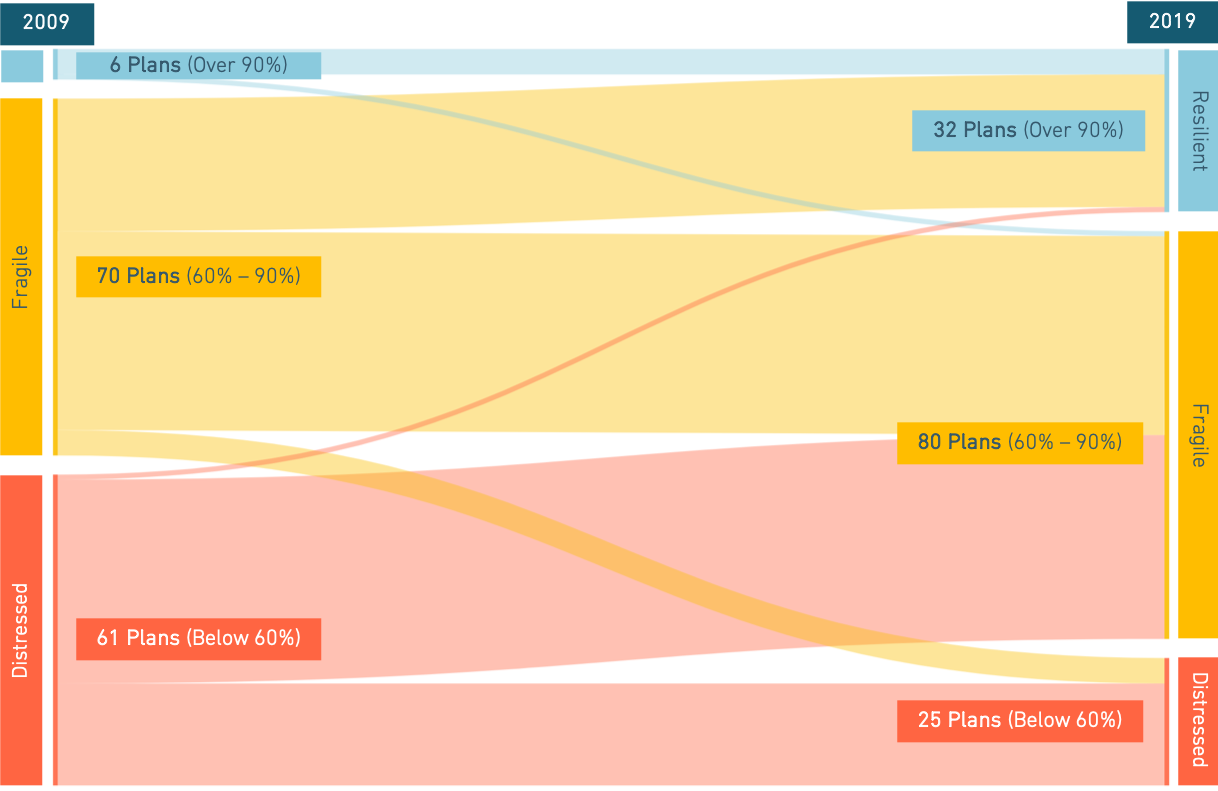
On net, the number of Resilient plans has only improved by three since 2009, while the number of Distressed plans has grown on net by seven.
Download the Full Report to See Details on Each Plan’s Change in Funded Status
Within The Trends: Investment Assumptions
States and pension boards have been slow to reduce their assumed rates of return, relative to declining interest rates.
Assumed Rate of Return v. Interest Rates, 2001-2019
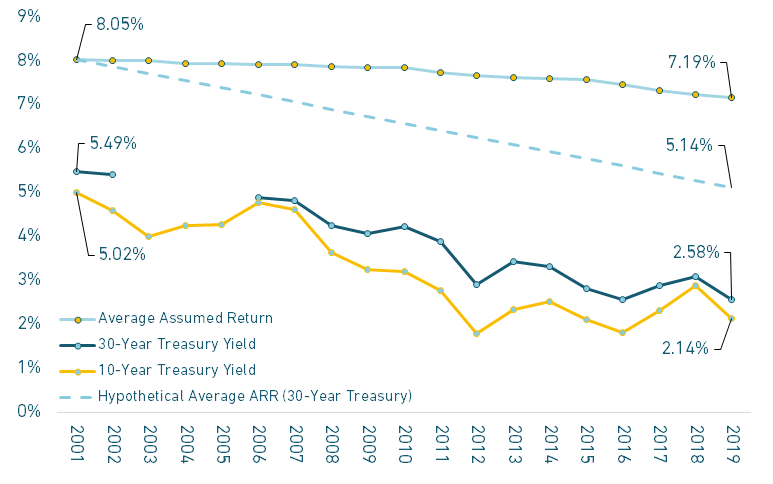
The slow pattern of assumed return reduction relative to interest rates has tacitly meant pension funds are taking on risk. The growing gap between interest rates and assumed rates of return reflects as an increased amount of risk that pension funds are accepting.
If assumed returns had kept pace with declining interest rates since 2001, the average assumption in 2019 would have been around 5.1%.
The decline in interest rates has had significant, negative effects on pension plans.
Interest Rates: Treasury Yields in Decline, 1980-2019 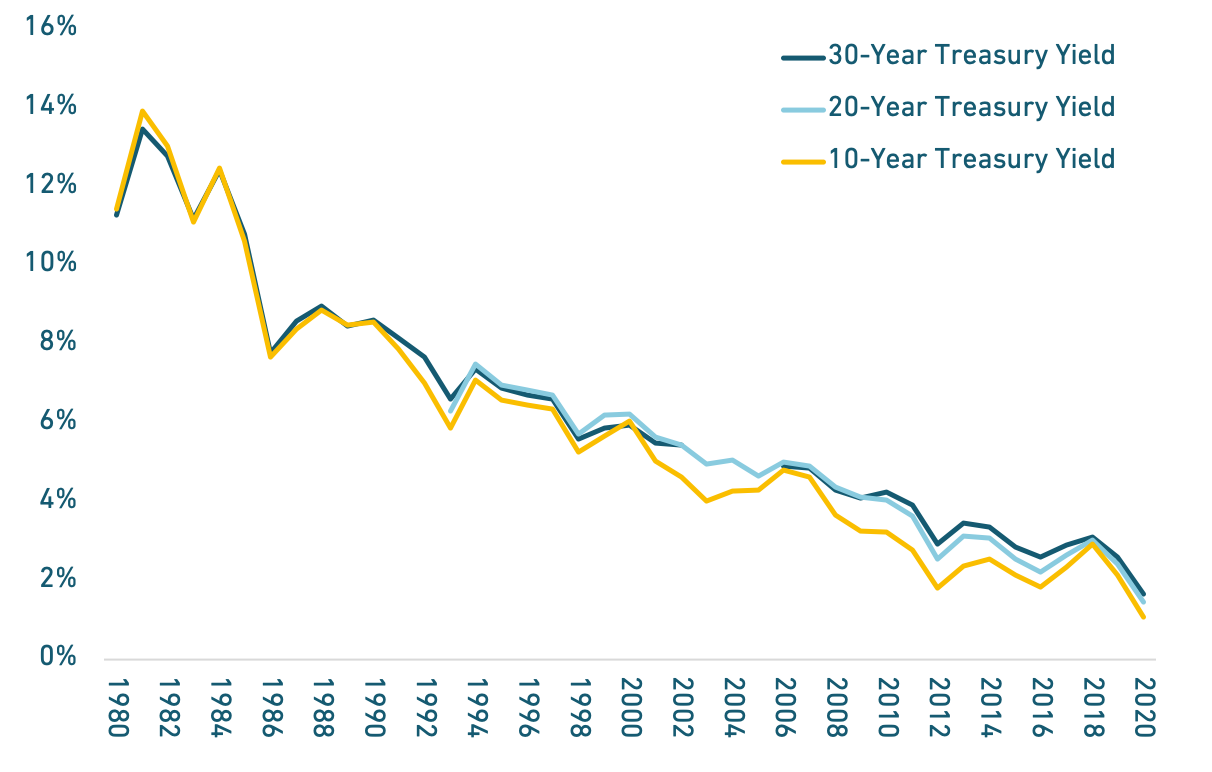
One of the most significant events to influence public pensions over the past 50 years was the steady decline of interest rates.
Assumed Rate of Return v. Interest Rates, 1980-2019
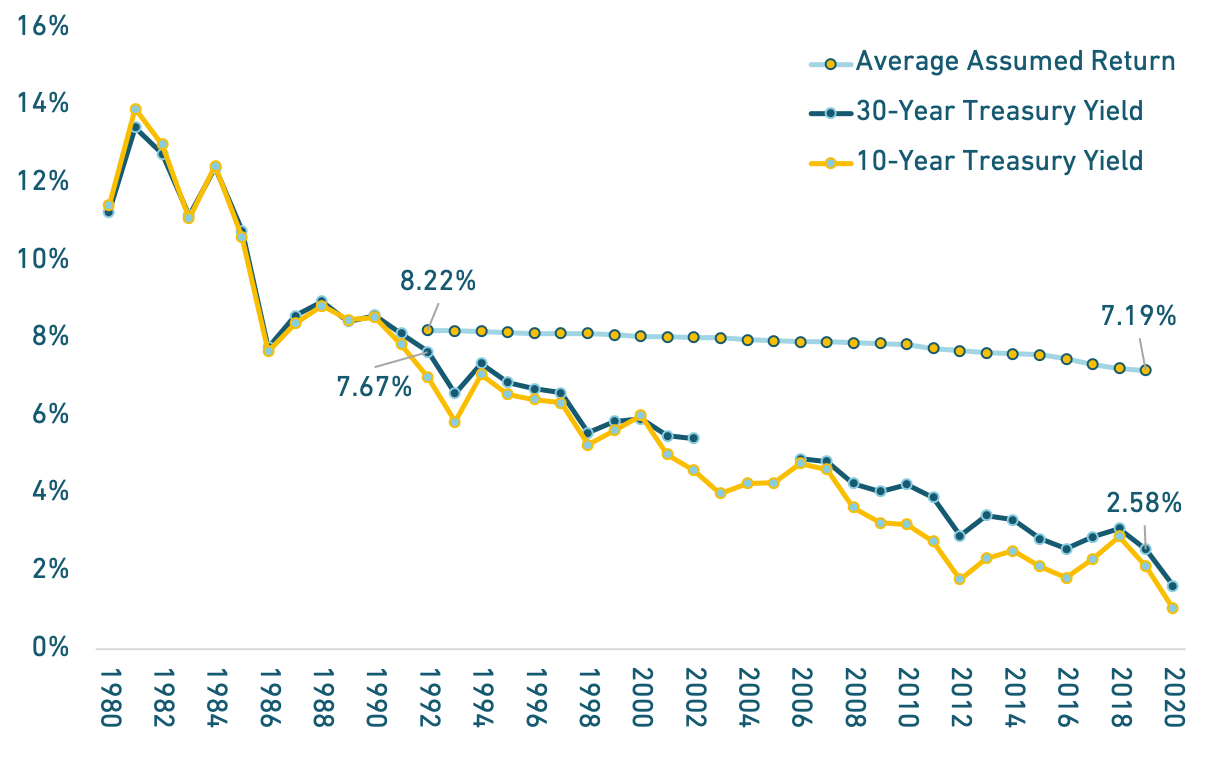
Lower interest rates have raised the costs of financial guarantees, like pensions and life insurance. It has also meant pension funds have earned steadily lower yields on fixed-income investments like bonds
The cost of making financial guarantees has grown over time as interest rates have declined. The cost of guaranteeing payments just 10 years in the future is nearly 10 times more expensive today than in the 1980s.
The states and pension boards for these plans are embracing the highest risks that asset growth will underperform expectations of any statewide pension funds in the country.
States with Assumed Returns Higher than 7.5%, 2019
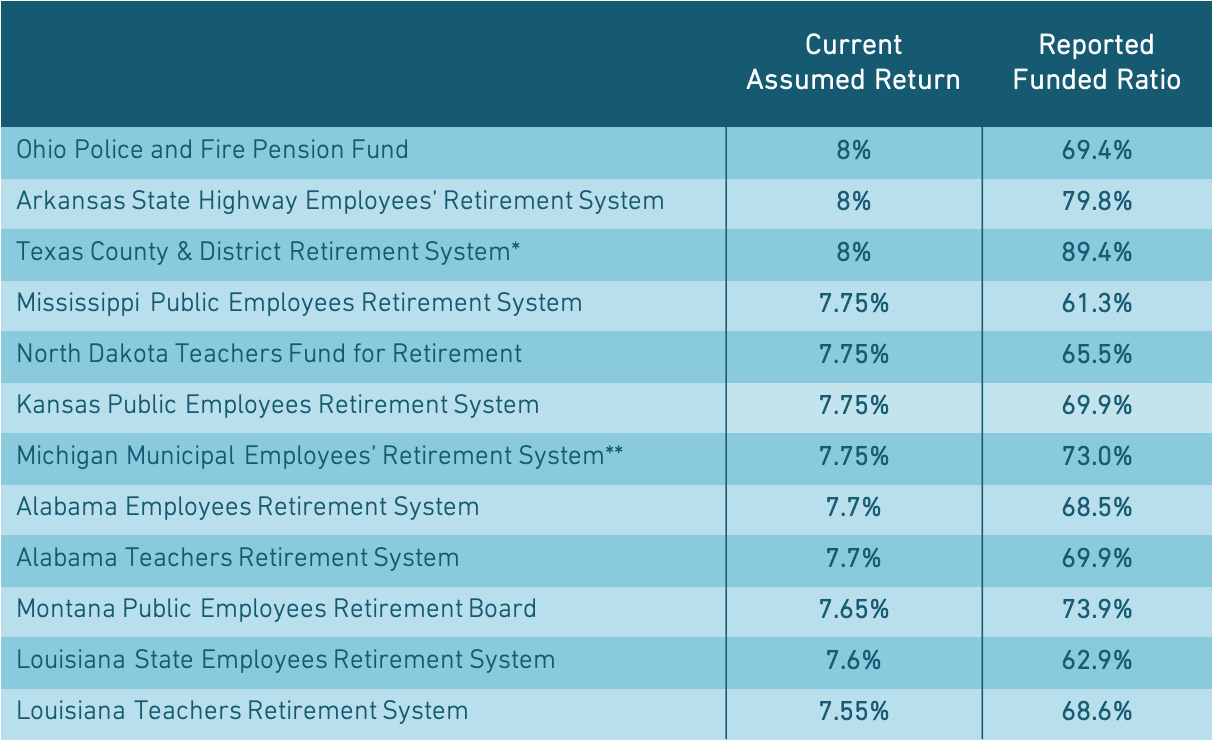
Overly optimistic assumed rates of return also likely mean that the reported value of promised benefits today is too low. Depending on whose capital market assumptions are used, the 50th percentile return for the asset allocation of statewide plans is between 5.5% and 7%. For example, Milliman estimates the expected return for the nation’s largest public plans is 6.6%, which is more than 50 basis points below the average rate being used.
Within The Trends: Contribution Policy
After decades of states failing to ensure they were paying at least the actuarially determined contribution rates, in 2019 states collectively were paying nearly all their bills.
This is a positive trend in funding policy. Actuarially required contributions have grown steadily over the past two decades, and in previous years, states have struggled to keep up.
States have steadily improved their commitment to paying actuarially required contributions over the past several years after reaching a modern low point in 2012, following the Great Recession.
Ensuring the actuarially determined contribution rate is fully paid each year is the minimum states can do if their goal is to ensure resilient, sustainable retirement systems.
There are reasonable debates to be had over public policy priorities for any given state or municipality, including over-allocation of resources to various policy goals and what tax rates are appropriate. Whether or not states should use resources to pre-fund retirement benefits is often a part of these debates.
While state and local leaders might have acceptable arguments for a choice that trades-off fully funding a pension plan, if a state has the goal of maintaining a sustainable retirement system then the bare minimum requirement each year is paying at least 100% of the ADC.
Within The Trends: Ability to Pay Contributions
The larger required pension payments are relative to the size of state budgets, the harder it is for the state to ensure responsible funding policies because of the higher cost burden.
Measuring pension plan sustainability means looking at both solvency levels over time (funded ratios and unfunded liability levels), as well as the costs of providing the retirement plan relative to existing tax revenues.
Actual contribution rates as a share of a state’s general fund provide a sense of how much the cost of a plan is given existing tax policy and spending priorities.
The ability to pay required contributions is a function of political will and whatever the limits are on collecting tax revenues.
Within The Trends: Cash Flows and Maturing Plans
Total retirees passed active members for the first time in 2015. This is driving ever-increasing benefit payments.
The ratio of active workers to retirees provides a signal about cash flows into and out of pension funds.
People are living longer and retiring faster (as the Baby Boomer generation phases out of the labor force). Public sector hiring rates slowed down after the Great Recession. The net result is active member counts have been relatively stable for the past few years, while the total number of retirees collecting benefits has grown.
It is going to be harder and harder to earn investment returns. Plans are cash flow negative from contributions and benefit payments. And the available asset base to earn investments from is stagnating.
The benefit-to-asset ratio is a helpful metric for states and pension boards to monitor whether they are at risk of running into a liquidity crunch. The closer a pension plan is to a 1:1 ratio, the closer they are to running out of cash.
But beyond solvency, there is also an investment concern here: As more of the asset base is being used to pay benefits, there is less money that can be invested in long-term assets to earn returns.
Because investment returns have been less than expected, and asset values haven’t kept up, the ratio of benefits-to-assets has been trending down since 2001. This is a vicious cycle because negative cash flow from contributions puts additional pressure on plan investment returns to meet or exceed expectations.
As that measure of liquidity shifts toward 1:1 pension fund managers will find it increasingly harder to make investment decisions. There will simply be fewer assets that can be invested flexibly.
Looking to the Future
We do not expect these negative trends will reverse without some intervention. Pension funds will not be able to invest their way out of the shortfall relative to growing promised benefits. Contribution levels based on status quo funding policies have not kept up with the growing rate of liabilities. But there is a theoretical limit to the contribution rates that state leaders will accept drawing on their general funds, school district funding, or city budgets. The larger a state’s unfunded liability relative to GDP, the harder it will be for that state’s tax base to pay down the pension funding shortfall.
There are a range of interventions that could help improve the trends outlined in this paper, and like the details within the trends themselves, the specific vary from state to state. States that have fragile, but not distressed pension plans should be looking to make funding policy improvements while the costs of doing so are not prohibitively expensive, as is likely the case for states with some of the worse funded plans. States on the cutting edge of pension plan management (ex. MI, CO, NM) are focused on adopting risk-sharing policies that give pension boards tools to balancing the goals of protecting benefits and ensuring a well funded plan.
Public plans are likely to continue the trend of lowering their assumed returns in the coming years due to lower probable actual returns. The speed at which this change is made will likely influence how much risk persists within public plans. Each year investment returns underperform expectations perpetuates a vicious cycle.
We're here to help. Contact us for more information.
Additional Resources
State of Pensions 2020 Downloadable Data
Interested in exploring our data set? Download the raw data from our December update here.
Read More
December Update: Full Funded Ratio History Infographic
Check out the expanded version of the State Funded Ratio History infographic included in the report.
Read More
December Update: Funded Ratio History Downloadable Graphics
Looking for your state's funded ratio history graphic? Download it here.
Read More
State of Pensions 2020: FAQ
Have questions about our findings and methodology? Read our FAQ.
Read More
Policy Solutions for States
Explore policy options that states can implement to address the public pension policy challenges highlighted in State of Pensions 2020.
Read More
Solutions for Stakeholders
Stakeholder engagement is key to effective public pension policy improvements. Here's what labor leaders, local officials and members can do to take action.
Read More
Great Recession Lessons Learned for the Age of COVID-19
Read more about how the pension trends of the Great Recession are a guide to understanding the COVID-19 Era.
Read More
State of Pensions Explained: Unfunded Liabilities as a Share of State Economic Output
An overview on why looking at unfunded liabilities as a share of state GPD and spending are useful metrics to consider pension plan health.
Read More
Explore More
State of Pensions 2020 Explained: Unfunded Liabilities as a Share of State Economic Output
A common metric for measuring the fiscal health of a pension plan is the . But on its own this metric doesn’t tell us everything […]
State of Pensions 2020: Great Recession Lessons Learned for Public Pensions in the Age of COVID-19
There are many unknowns in the Age of COVID-19, but fortunately when it comes to forecasting what is likely to happen to public pension funds […]
There were some positive steps taken by statewide retirement systems during the decade after the Great Recession. But the strides were not good enough. Most […]