Report
State of Pensions 2021
A year of epic investment returns brings both good news and serious warnings for U.S. statewide pension plans
- What is the State of Pensions in 2021?
- The National Trends
- Public Pension Trends to Watch Beyond 2021
- Within The Trends: Funded Status
- Within The Trends: Investment Assumptions
- Within The Trends: Contribution Policy
- Within The Trends: Cash Flows and Maturing Plans
- Within the Trends: The State of Benefits
- Looking to the Future
- Additional Resources
What is the State of Pensions in 2021?
State retirement systems in America improved from last year, but are still Fragile.
This an annual report on the current status of statewide public pension systems, put into a historic context. State and local governments face a wide range of challenges in general – and some of the largest are growing and unpredictable pension costs. The scale and effects of these challenges are best understood by considering the multi-decade financial trends and funding policy decisions that have brought public sector retirement systems to this moment.
The financial market volatility over the past 18 months of the COVID-19 pandemic has ultimately been a positive investment climate for institutional investors like state pension plans. And the federal government has provided substantial financial aid to states and municipalities, smoothing over what could have been seismic budgetary shortfalls in some jurisdictions due to tax revenue declines. The combined historically unprecedented nature of these events continues to create an unpredictable environment for state pension plans. However, in this report Equable uses patterns of behavior from the past two decades as a guide to what might happen in the coming decade while also a means to identify areas of concern that should be monitored closely or acted upon immediately.
So what are the trends in public pension funding in 2021?
- Preliminary 2021 investment returns for state plans that have reported preliminary results (25.7% on average as of early December 2021) show most far exceeding the average assumed return (7.03% for this year). This is the highest average investment return for public plans this century by a wide margin.
- Investment returns this year have balanced out underperformance from 2020. But they still leave plans with historically high contribution rates and do not change any of the demographic dynamics public plans are facing. Plus, states are realizing they need to use lower investment assumptions (a good thing) and that will mean even more contribution rates in coming years (an unfortunate thing). The range of policy interventions that could help improve the trends outlined in this report vary from state to state, but almost every state has some work to do.
Positive Trends
- Funded Ratio: Record returns have caused a jump our projected funded status of statewide plans nationally to 80.8%. That is positive but still lower than the funded ratios in 2007 or 2008.
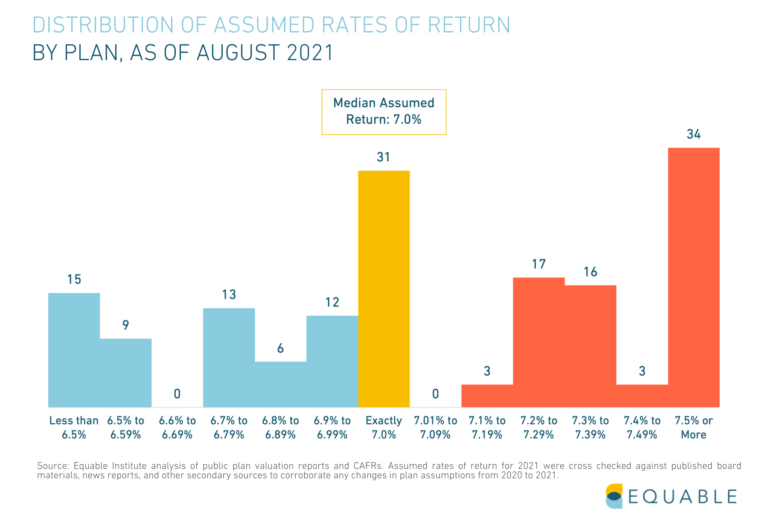
- Funding Policies: More states have lowered their assumed returns in 2020 to more realistic levels. Five plans that had assumed returns over 7.5% lowered their expectations during the past year, leaving just 10 plans above that high-water mark. There are now 24 state retirement plans with return assumptions below 6.5%.
- Paying the Bills: After decades of states failing to ensure they were paying at least the actuarially determined contribution rates, in 2020 states as a group paid nearly 100% of required contributions for the second year in a row.
Negative Trends
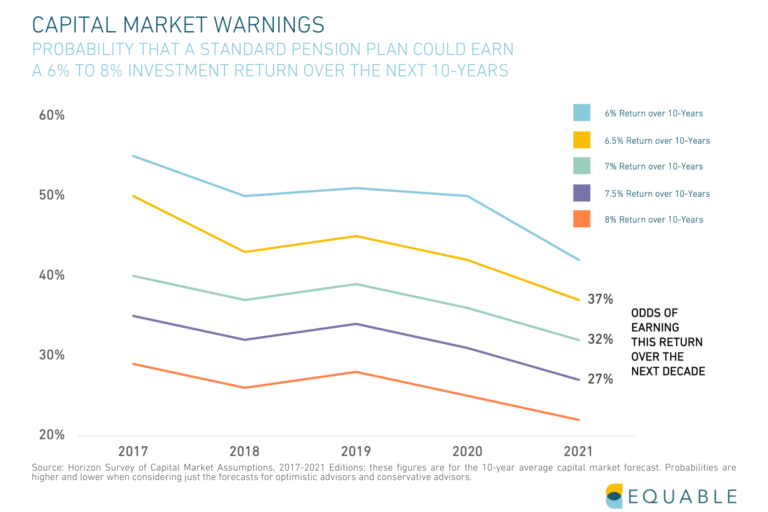
- Market Volatility: While the first months of 2021 has seen record investment returns, it is unlikely retirement systems can expect this trend to continue. Capital market forecasts from the summer of 2021 shows 10-year return forecasts are even lower this year than they were last summer.
- Asset Allocations: Asset allocations continue to shift toward riskier and less transparent alternatives, including hedge funds, private equity, and real estate. The share allocated to hedge fund managers and private equity strategies has grown to 13.1% (from 8.6% in 2008.)
- Contribution Rates: 2021 has seen the highest actual employer contribution rates in history (28.74% of payroll), and employee contributions have also grown to 8.04% of payroll for plans that do not participate in social security.
- Cash Flows: It is going to be harder and harder to earn large investment returns going forward. Most major capital market forecasts project a decade of average returns well below the 7.03% statewide pensions are assuming. This will put a lot of pressure on state retirement plans that are cash flow negative from growing benefit payments that are larger than even record contribution rates.
The National Trends
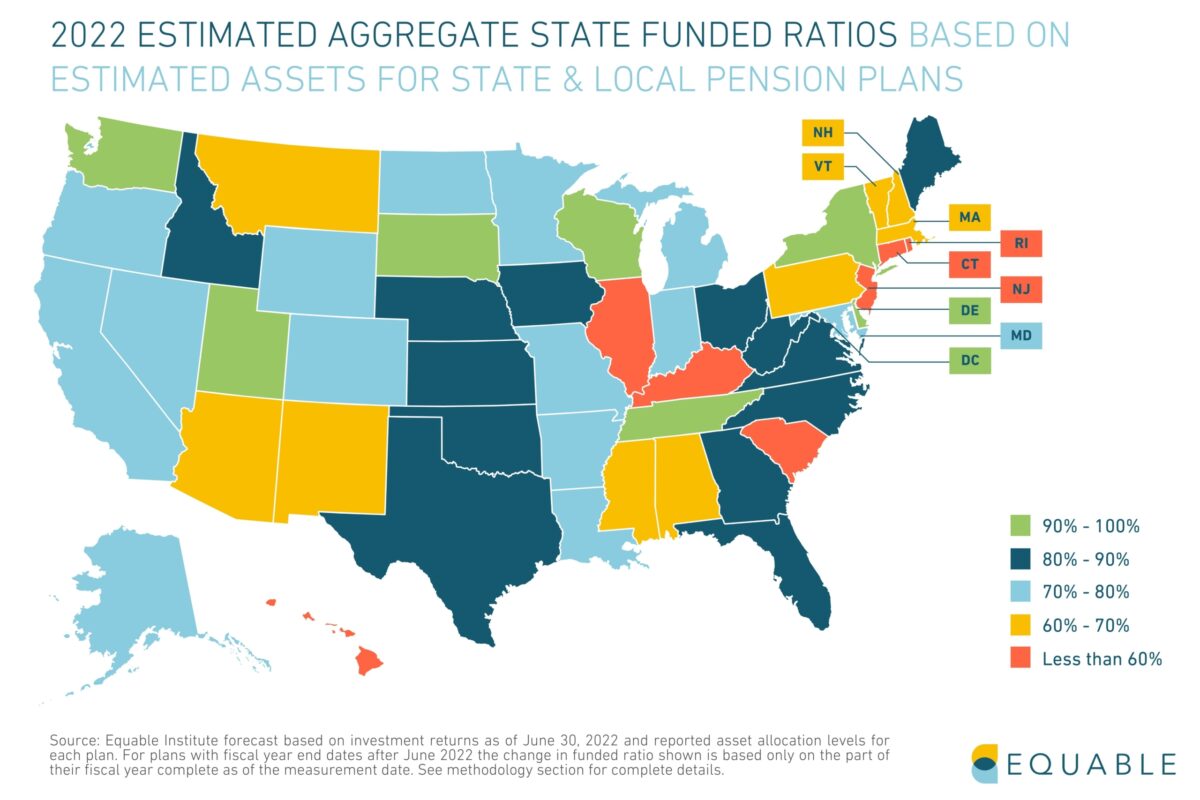
The aggregate funded ratio for statewide plans collectively is at its highest point since 2008 (using market valued assets).
We estimate that the average funded ratio will increase from 70.9% in 2020 to 80.8% in 2021. This dramatic increase in funding levels can be attributed to record investment returns in the volatile Covid-19 market environment.
The pension asset shortfall for statewide plans grew in 2020 (to a historic high) but will improve notably in 2021 (to roughly where unfunded liabilities were in 2009 at the end of the Great Recession).
Total unfunded liabilities for statewide plans back in 2001 were roughly $100 billion. The shortfall grew to $1.15 trillion at the end of 2009 (the bottom of the financial crisis), and hit a peak of $1.49 trillion in 2020.
We estimate that unfunded liabilities will decline to $1.12 trillion in 2021 due to historic market investment return performance.
Several states with significant pension funding shortfalls face unfunded liability levels greater than 15% of their total GDP.
Funded ratio and unfunded liability levels on their own are not perfect indicators of a retirement plan's fiscal health.
Understanding the size of unfunded liabilities relative to the size of a state's economy gives a sense of what scale of resources will be needed from a local tax base to improve retirement plan funded status.
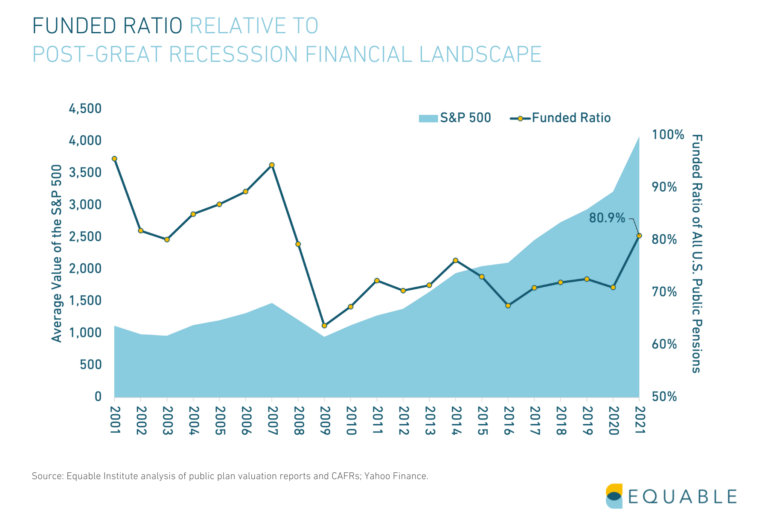
Average investment returns were consistently below assumed rates of return over most the past decade. This contributed to the growth in unfunded liabilities for public plans. The 10-year average return is now well above assumed returns, with one-year returns beating assumed returns five of the last 10 years.
2021 returns (averaging 25.7% through early December) will easily be the best performance for public plans this century. The final return will exceed the one-year return rates from in 2013 (12.6%), 2014 (14.7%), and 2017 (12.7%).
Asset allocations have shifted away from relatively safe fixed income investments into riskier categories in a search for stronger investment returns.
"Alternative" investments include private equity, hedge funds, real estate, commodities, and tactical asset allocations.
Public Pension Trends to Watch Beyond 2021
While the Covid-19 pandemic did not result in a prolonged recession as many feared, the realities of the pandemic economy will continue to affect public retirement systems in the following ways:
- Investment volatility in 2020 meant only two of the 112 state retirement plans with a June 30 fiscal year-end earned their assumed return, and this caused unfunded liabilities to grow. By contrast 24 of the 31 plans with December 31 fiscal year-ends beat their investment assumptions.
- Most plans will far exceed assumed returns in 2021, according to preliminary reports. These returns will improve funded ratios to a better place than 2019; however, depending on how many plans decide to adopt lower investment returns this year, the net effect may be less improvement than currently anticipated.
- Federal stimulus helped most states avoid reducing their contributions into pension funds, however concerns about overall volatility and forecasts of low future returns have meant states are still looking to:
- Reduce benefits (where legal), such as cutting retiree COLAs & lowering future worker benefits
- Reduce assumed return rates, which means recognizing higher unfunded liability levels.
- Utilize alternative investments like hedge funds and private equity to chase higher returns.
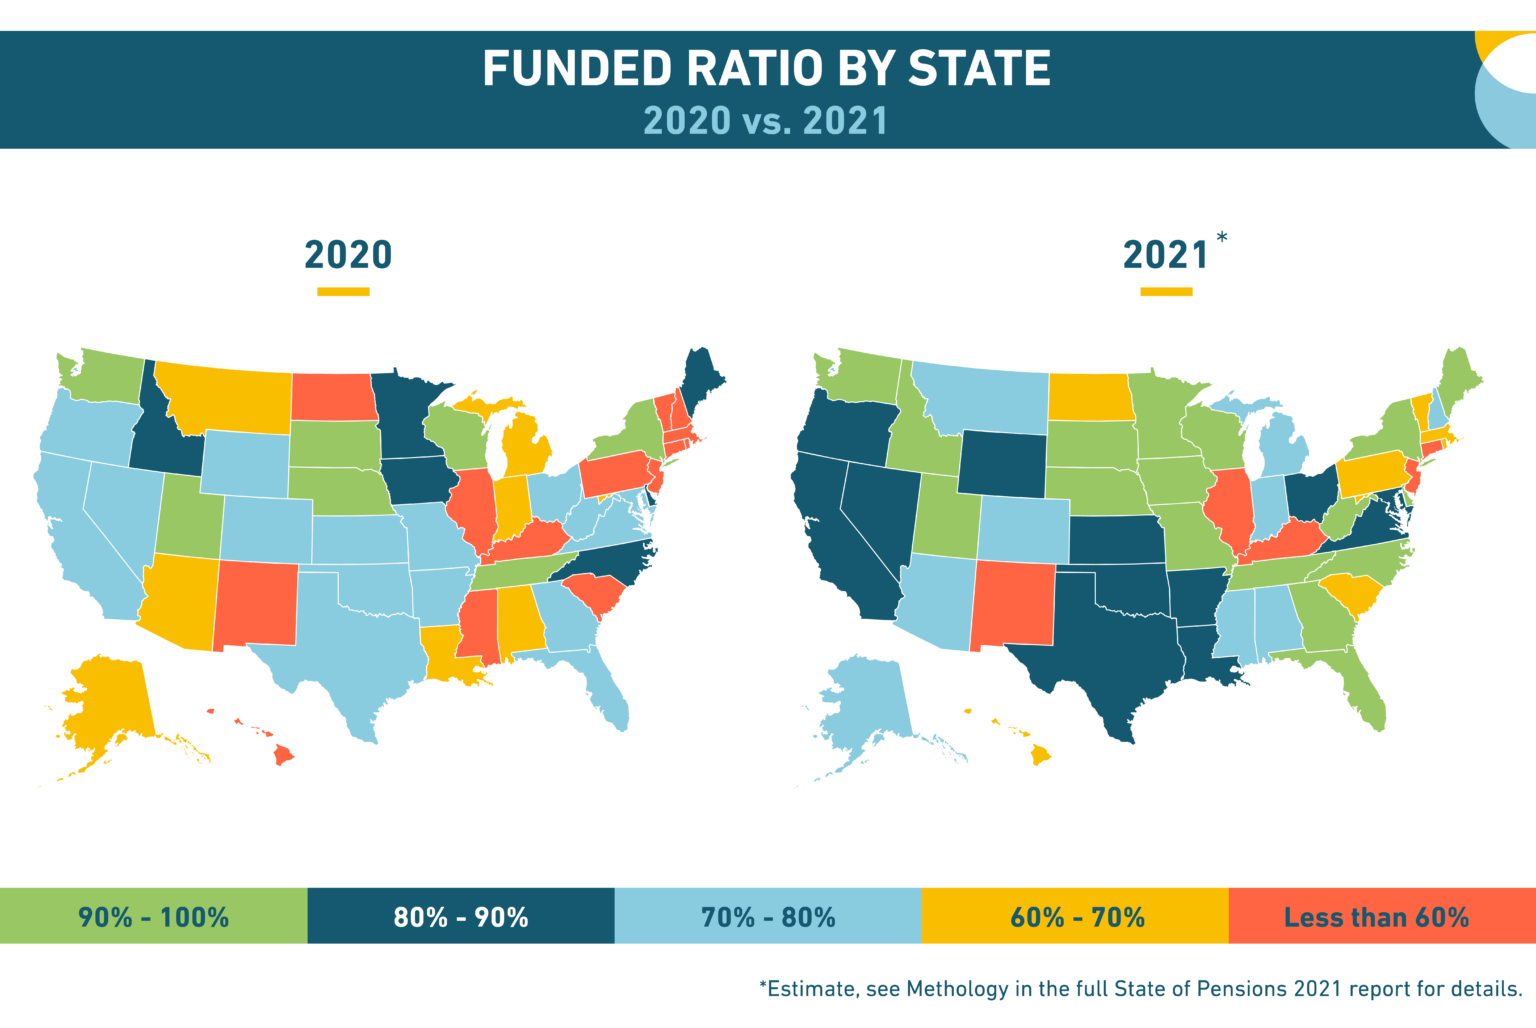
Financial market volatility meant most plans saw reduced funded ratios from 2019 to 2020, but these will be more than balanced out with 2021 investment performance.
We estimate that there will be varied levels of improvement from 2019 to 2021 once final numbers are available. Only New Mexico, North Dakota, and New Hampshire are likely to have their state plans collectively in worse financial condition in 2021 than in 2019 (primarily because of insolvency forecasts for certain pension plans that influence how actuaries account for their unfunded liabilities).
Equable estimates the average 2021 investment return for statewide plans is 25.7% (based on actual preliminary reports. This is 1,867 basis points above the average 7.03% assumed return for the fiscal year.
The funded status for 2020 could have been a lot worse. And returns in 2021 are a huge help for state pension funds. Those positives should not be overlooked. However, the strong investment performance has not saved state pension funds.
Pre-existing unfunded liability levels were high enough that 2021 returns are likely only going to bring funded ratios back to 2008 levels, which was a Fragile funded status.
How Should The Strong Investment Returns for Pension Funds Be Interpreted?
- The bull market between 2009 and February 2020 created large financial gains for institutional investors worldwide, but statewide pension funds still entered the Covid-19 pandemic with a lower funded status (72.6%) than they did going into the Great Recession (93.8%). Following the Covid market crash, markets bounced back quickly in 2020 and surged even more in 2021, which will translate into a sharp increase in funded ratios for statewide pension plans on a market value basis. However, there are reasons to believe plans are unlikely to enjoy record returns in the years to come.
- Capital market forecasts are warning that future returns are likely to be muted, perhaps in part because the double-digit returns this year have "pulled forward" investment returns from future years, reflecting an overvaluing of certain public companies.
- Assumed rates of return are likely to be reduced by retirement systems in the coming years because of the collective evidence and forecasts pointed toward a future of 5% to 6% average returns for public plans — not the 7.0% currently assumed. Lower investment assumptions mean recognizing higher levels of unfunded liabilities, so it is reasonable to expect that the overall funded status for state pension funds is only going to marginally improve in the coming years absent considerable additional funding.
Within The Trends: Funded Status
While nationally the funded status of public pension funds has trended downward in the aggregate from 2008 - 2020, there is considerable variability from state to state on funded ratios and unfunded liability trends.
The funded ratio is a quick first look at the health of a pension plan but isn't the only factor to measure. Check out this essay for a broader understanding of what resilience and fragility look like for public retirement systems.
Actuarial assumptions, funding policies, and governance should also be considered. A pension plan's funded ratio might have dipped because the pension board adopted more realistic actuarial assumptions.
We think about the sustainability of state-managed pension funds in three groups: Resilient, Fragile, and Distressed. No single data point on its own should be used to measure a pension plan's fiscal health, so we use a multi-factor matrix when thinking about plan sustainability. This includes funded ratio, unfunded liability as a share of GDP, the assumed return, share of required contributions received, and availability of risk-sharing tools. For a breakdown about each factor check out this essay.
Within The Trends: Investment Assumptions
States and pension boards have been slow to reduce their assumed rates of return, relative to declining interest rates.
If assumed returns had kept pace with declining interest rates since 2001, the average assumption in 2021 would have been around 4.3%.
The growing gap between interest rates and assumed rates of return reflects as an increased amount of risk that pension funds are accepting.
The average assumed rate of return has gradually declined from 8.05% in 2001 to 7.03% in 2021.
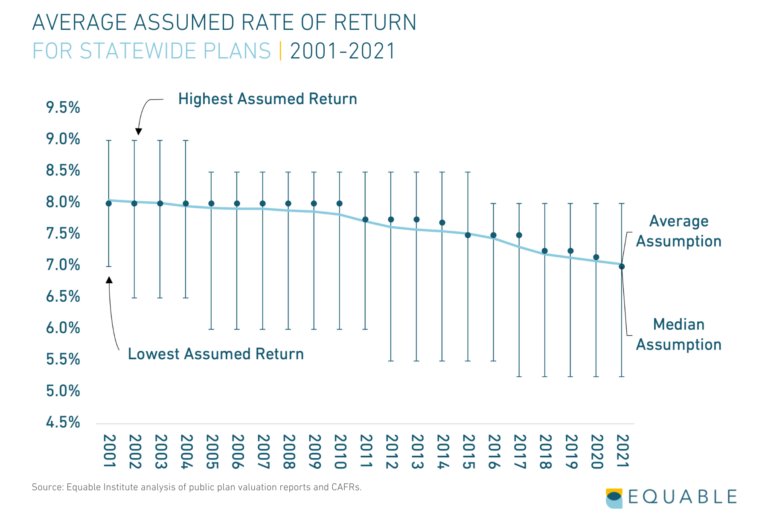
Over the past two decades there has been a wider range in assumptions adopted by plans. The lowest rate adopted by any plan is 5.25%, while the highest rate currently used is 8%.
Within The Trends: Contribution Policy
Actuarially required contributions have grown steadily over the past two decades, and in many years, states have struggled to keep up.
The total dollar amount of required contributions that were not paid between 2001-2020 was $176.9 billion.
States have steadily improved their commitment to paying actuarially required contributions over the past several years after reaching a modern low point in 2012, following the Great Recession.
While a few states did not fully fund their required contributions in 2020, on net states collectively paid closer to the actuarially determined rates than in any year since 2001.
Within The Trends: Cash Flows and Maturing Plans
Total retirees passed active members for the second year in a row. This is driving increasing benefit payments.
People are living longer and retiring faster (as the Baby Boomer generation phases out of the labor force). Public sector hiring rates slowed down after the Great Recession. The net result is active member counts have been relatively stable for the past few years, while the total number of retirees collecting benefits has grown.
It is going to be harder and harder to earn large investment returns. Plans are cash flow negative from contributions and benefit payments. And the available asset base to earn investments from is stagnating.
The benefit-to-asset ratio is a helpful metric for states and pension boards to monitor whether they are at risk of running into a liquidity crunch. The closer a pension plan is to a 1:1 ratio, the closer they are to running out of cash.
Within the Trends: The State of Benefits
Over the past two decades the number of public retirement plans available to new hires has grown, particularly as states add options and design more specific benefits for narrower segments of the workforce.
This expansion of benefit designs generally has focused on adding "Hybrid" plans that combine guarantees with individual accounts, while stand alone Defined Contribution and Guaranteed Return Plans have also increased in availability over the past decade.
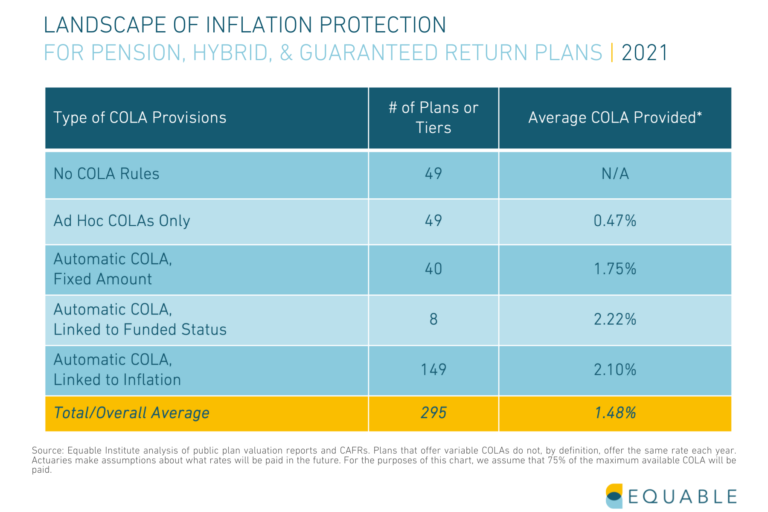
Inflation protection of benefits is important for ensuring they continue to provide retirement income security as intended, but many plans do not provide automatic inflation protection for their members.
But beyond solvency, there is also an investment concern here: As more of the asset base is being used to pay benefits, there is less money that can be invested in long-term assets to earn returns.
Because investment returns have been less than expected, and asset values haven't kept up, the ratio of benefits-to-assets has been trending down since 2001. This is a vicious cycle because negative cash flow from contributions puts additional pressure on plan investment returns to meet or exceed expectations.
As that measure of liquidity shifts toward 1:1 pension fund managers will find it increasingly harder to make investment decisions. There will simply be fewer assets that can be invested flexibly.
Looking to the Future
Looking forward we anticipate that state retirement plans will continue to lower their investment assumptions (though we don't think it will happen as quickly as it should), and this will mean an increase in the measurement of unfunded liabilities. That means contribution rates will continue to increase, which will create political pressure to better manage costs. Funded ratios are, on average, in their best place since 2008. But investment outlooks are modest at best. So, we expect that, in a search for higher yields, public plans will continue to leverage alternative investments like hedge fund strategies — which should create more pressure from stakeholders to demand transparency around how pension fund money is being managed.
In order for America's public pensions to be considered resilient we believe that average funded ratios need to consistently exceed 90% (based on assumed returns that are ideally no higher than 6.5%) with unfunded liabilities that are less than 5% of state GDP. No single metric fully captures the health of public retirement systems, but these metrics together provide a pretty strong signal about the overall health of America's public defined benefit plans.
Based on this framework there still a long way to go before America's pension systems escape fragility. But building on this year's strong investment returns and the downward trend of investment assumptions, there have been positive steps toward resilience. We will celebrate those steps while continuing to warn about the broader negative trends and hope that policymakers, trustees, and stakeholders collectively act quickly to improve the status quo.
State of Pensions 2021
Download the full State of Pensions 2021 report and fact sheets to dive deeper into the trends affecting public pensions.
Additional Resources
State of Pensions 2021 Downloadable Data
Interested in exploring our data set? Download the raw data from our December update here.
December Update: Funded Ratio History Downloadable Graphics
Looking for your state's funded ratio history graphic from our December 2021 Update? Download it here.
State of Pensions 2021: FAQ
Have questions about our findings and methodology? Read our FAQ.
Policy Solutions for States
Explore policy options that states can implement to address the public pension policy challenges highlighted in State of Pensions 2021.
Solutions for Stakeholders
Stakeholder engagement is key to effective public pension policy improvements. Here's what labor leaders, local officials and members can do to take action.
State of Pensions 2021 Explained: Unfunded Liabilities as a Share of State Economic Output
An overview on why looking at unfunded liabilities as a share of state GPD and spending are useful metrics to consider pension plan health.