

“This paper analyses the evolution of the United States’ public sector balance sheet and projects it forward to analyze the fiscal position in a comprehensive manner. Balance sheets are a useful device for assessing the financial health of a household, enterprise, or government. By summarizing all assets and liabilities, they provide a measure of solvency – the extent to which the promises implied by the liability side are backed by real assets and claims on other entities. When assessing the financial position of private corporations, both sides of their balance sheets are equally considered. Fiscal policy analysis, by contrast, is often limited to the evolution of government debt. While, for many countries, this is due to data limitations, the rich data available for the US allow us to conduct a more comprehensive analysis. …
The intertemporal balance sheet underscores the large fiscal adjustment needs. Under our baseline assumptions, we find that current fiscal policies in the US are not viable in the long-term: under existing policies, current financial and non-financial assets combined with future tax revenues are not sufficient to fulfill all the promises made to constituents and creditors. To keep all of its explicit promises (for example, public pensions) without overburdening future generations, the government needs to change policies to either raise an additional 2.6 percent of GDP in revenue per year or reduce some of the implicit promises (for example health care, social security, education) to current generations. …
The materialization of fiscal risks could further impair public sector net worth, that is, the difference between total assets and total liabilities of the public sector. The historical analysis shows how the evolution of public sector net worth has been affected by shocks to asset prices, housing market conditions, and growth. We project the values of individual assets under different shock scenarios to quantify the risk exposure of different assets on the public sector balance sheet. We find that, while risks to the mortgage portfolios of the major two government-sponsored enterprises (GSEs) and student loans held by the federal government warrant vigilance, they are dwarfed by the potential losses through the equity portfolios of state and local government pension funds.
The high quality of public sector balance sheet data allows both for a consolidated overview and for more granular analyses, both of which can provide useful context to ongoing policy debates. For example, quantitative easing (QE) – the Fed’s policy to purchase long-term public debt using reserve deposits issued to banks – has led to an expansion of the Fed’s balance sheet, an increase in its exposure to interest rate risk, as well as an increase in the federal government’s average debt maturity. From a consolidated perspective, however, QE did not lead to an expansion of the balance sheet, and the average maturity of public sector liabilities declined, with interest rate risk being shifted from the federal government to the central bank. In other instances, however, aggregation can obscure channels of risk propagation, since risk sharing between states is limited, as is the insurance against local or regional shocks provided to municipalities by the federal government. Hence, a more granular approach is needed for the analysis of state and local governments.” …
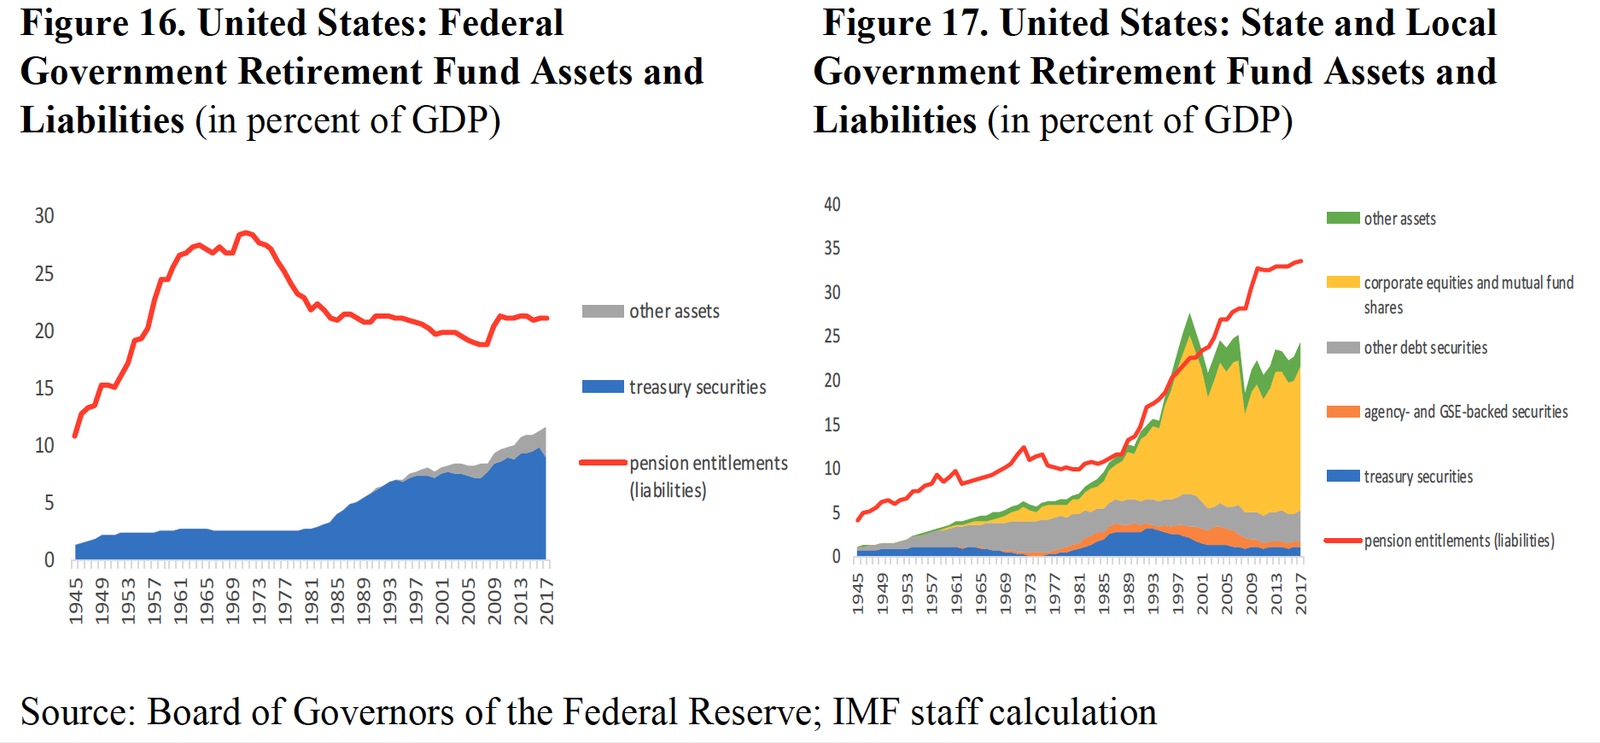
GOVERNMENT EMPLOYEE RETIREMENT FUNDS
“Taken as a whole, government employee pension fund assets are significantly smaller than their fast-growing liabilities16, with general government covering for the shortfall.
- Guarantees provided to federal government pension funds (Figure 16) have been shrinking since the early 1980s when the unfunded Civil Service Retirement System (CSRS) was closed to new entrants and replaced with the Federal Employee Retirement System (FERS) which is legally obliged to remain fully funded, including through a guarantee from the federal government if necessary. It is worth noting that, since CSRS and FERS both invest exclusively in Treasury securities, the distinction between funded and unfunded liabilities is an artificial one. In both cases, all federal pension benefit liabilities, which by far exceed the value of assets held by the federal pension funds, are backed by a promise from the federal government.
- The funding status of state and local government pension funds (Figure 17) has been volatile, as pension liabilities have been on a consistent increase, while assets (equities for the most part) have gone through ups and downs. During the late 1990s, when stock prices soared, pension funds became overfunded, leading to negative claims on governments.
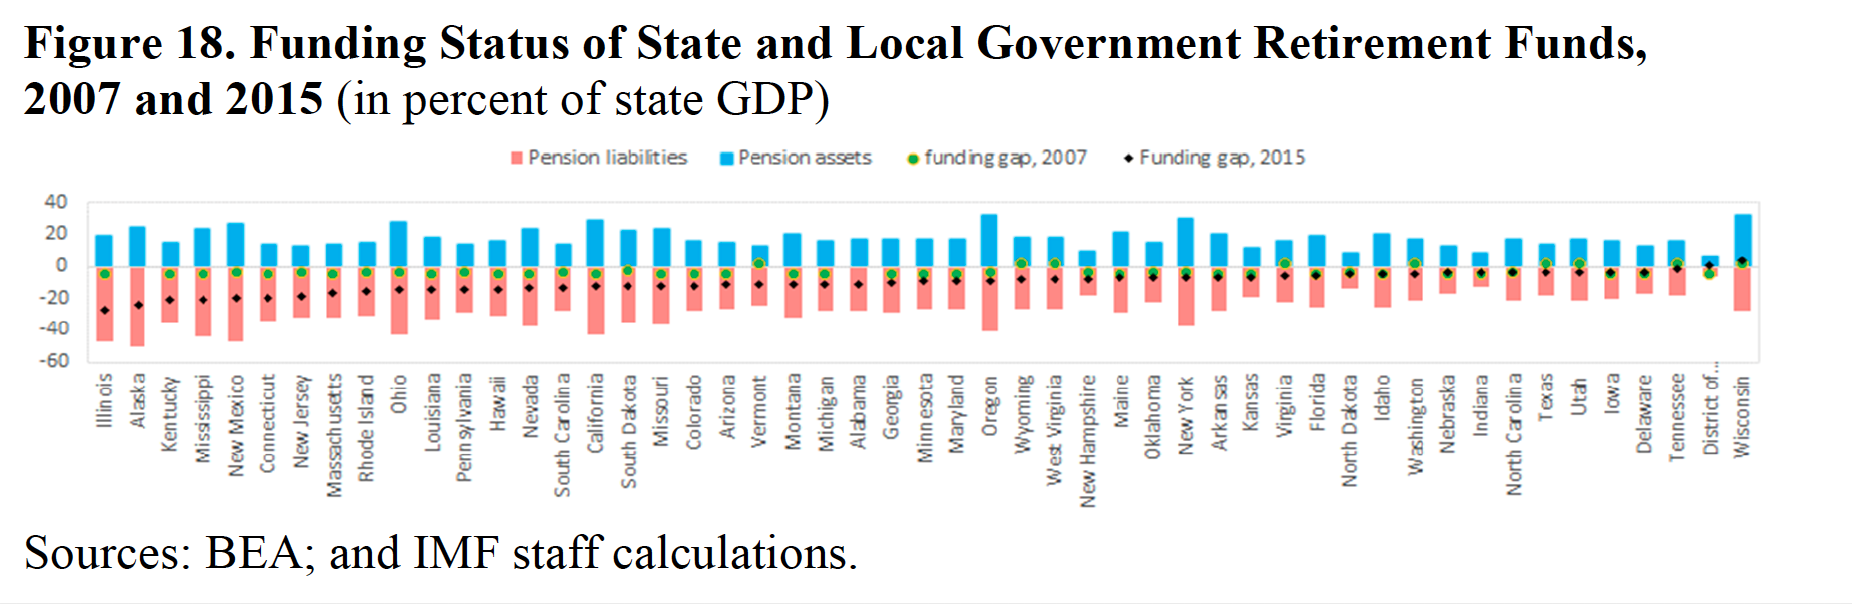
The aggregate current shortfall of state and local pension funds masks substantial heterogeneity in funding status across states. Funding status ranges from a surplus of 4.3 percent of state GDP in Wisconsin to a gap of 27 percent of GDP in Illinois (Figure 18). In most cases, the funding status has deteriorated considerably since 2007, driven by large negative returns during the global financial crisis. There is substantial variation in returns across funds (Figure 19), which account for a considerable share of the heterogeneity in funding gaps. Shoag (2014) reports a within-year standard deviation of returns across state pension plans of 2 to 3 percentage points and a cross-sectional standard deviation in cumulative 20-year returns of nearly 100 percentage points.
_______________
This article republishes selections from “Public Wealth in the United States” by Fabien Gonguet and Klaus-Peter Hellwig, a working paper released by the IMF in July 2019. Content selections are from pages 5-7, 17-18. The whole paper is available here.