
Replacement rates compare the value of a retirement benefit to the value of pre-retirement income.
Definition: Pre-Retirement Income
There are various ways that pre-retirement income can be defined. Public pension plans use a range of approaches. The most common definitions of pre-retirement income used by public pension plans are:
- an average of the last three to five years of salary, or
- an average of the three to five highest years of salary.
Outside of public pension plans, pre-retirement income is usually defined as the amount of money a person was earning right before retirement. Social Security uses an inflation-adjusted way to define pre-retirement income using an average eligible salary over a 35-year period.
Definition: Value of a Retirement Benefit
The value of a defined benefit pension plan is based on a formula based on benefit provisions. Generally, these include:
- The multiplier
- A definition of pensionable salary
- Normal and early retirement benefit eligibility rules, and
- Cost-of-living adjustment (COLA) or other inflation-adjustment provisions.
The value of a defined contribution plan is the account balance that an individual has at any point. This is influenced by contribution rates and investment returns.
The value of hybrid plans and guaranteed return plans (e.g. cash balance plans) are generally based on a mix of the ways defined benefit and defined contribution plans are built.
Comparing Retirement Plans
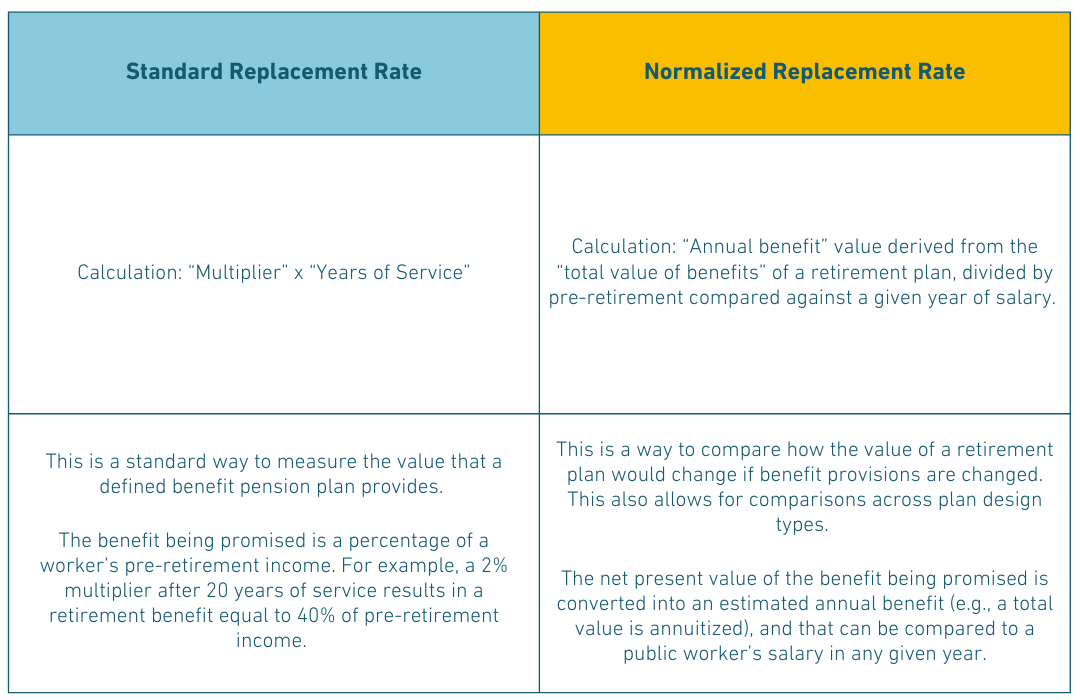
In theory, two retirement plans can be compared by looking at the different replacement rates that they offer. Think about two pension plans that offer different multipliers, like 2% versus 1%. A standard way to compare these two plans would be to measure their replacement rates. In this case, after 30 years the higher multiplier plan offers a better replacement rate benefit, 60% versus 30%, respectively.
However, factors like how pre-retirement income is defined, the age or service requirements for when benefits can be drawn, and whether benefits get inflation adjusted are also very important for comparing benefit values.
For example, a pension plan with a 1% multiplier might actually offer a better benefit than the 2% multiplier plan if benefits can be drawn earlier (like at age 50 versus 65), with a narrow definition of pre-retirement income (like the highest year of salary versus the average of the last five years), and strong inflation adjustment (like adjusting to actual CPI versus no COLA).
To address this and similar cross-retirement plan comparisons we sometimes use a metric called a “normalized replacement rate.”
Definition: Normalized Replacement Rate
The total value of benefits of a retirement plan is the most straightforward way to compare two retirement plans. However, it is not the most intuitive way to understand what a benefit is worth, since it requires understanding some of the assumptions used to get to a calculation like $650,000 or $1.23 million as the present value of a specific retirement plan.
A more approachable way to compare retirement plans is the annual benefit — e.g., $18,000 a year or $42,000 a year. This can be compared to the salary a public employee earned during their career. But, as previously noted, standard replacement rates can hide important factors for comparing the value of two benefits. This includes the total number of payments provided based retirement eligibility rules.[1]
A normalized replacement rate strikes a balance between these concepts. The approach starts with calculating the total value of a retirement benefit (the net present value) and converting that amount into an annualized benefit (using annuitization factors). The result of that arithmetic is an estimated annual benefit. This can be compared to the actual salary a worker is earning at any given year of their career. The estimated annual benefit can then be used to calculate a normalized replacement rate by comparing against the plan’s final average salary.
After one year of service any retirement plan will have a very low replacement rate because very little benefit has been earned relative to the pensionable salary. Over time, the replacement rate will change as the benefit grows and salary changes. This is the “normalized replacement rate.”
A significant advantage of this approach is that it allows for a comparison in how retirement plan provision changes truly affect overall value. Changes to a defined benefit pension plan can be measured, as well as comparisons between pension plans and other types of retirement plans.
Trade Offs: Why this Matters for the Retirement Security Report and RSR Scorecard
The Retirement Security Report is designed to measure each public retirement plan on its own terms against a set of best practices. The baseline standard we’ve set considers if the member of a given retirement plan is on a path to a secure retirement using replacement rates compared against a 70% replacement rate target at age 67. But the project also aims to measure the change in value for a given retirement plan over time, which means comparing benefit provisions.
To solve this problem the RSR adopts the methodology outlined above to convert the total value of benefits into a normalized replacement rate.
This approach has several notable trade-offs:
- The methodology allows for the calculation of estimated annual benefits and replacement rates in a consistent manner across all plan types, different plan features, and in various contexts. These standardized estimated annual benefits and normalized replacement rates are ideal for the comparison of benefits both against our target metrics but also allows for an apples-to-apples comparison across plans (or in our case here, proposed new plans or reforms to existing plans).
- A drawback of this approach is that a normalized replacement rate is not widely understood or immediately intuitive. Moreover, in many cases, the normalized replacement rate approach often shows substantially different estimated annual benefits than a simple pension benefit formula.
These trade-offs mean a balanced way to compare plans that at the same time is not easily comparable to how a given pension plan might define its own value. For example, a pension benefit formula might suggest that a plan should provide a 50%, 60%, or even 70% replacement rate, when the normalized approach might report a much lower rate because of the annuitization factors used and definition of pre-retirement income the benefit is measured against.
The RSR applies this methodology to ALL plans, regardless of plan design or other specific plan provisions. This means that within RSR comparisons all plans are treated equally in their assessment and when comparing changes to plan provisions.
_________________
[1] For example, if the two plans have different retirement ages then there is going to be a different number of annual payments made. This can substantially change what the total benefit is — $15,000 a year paid for 35 years yields a larger payout than $20,000 a year paid for 20 years.