Data
How NYC, LA, and Chicago Influence the Funded Ratio Average of Locally-Managed Pension Plans
The majority of public pension systems in America are managed at the state level, even if the retirement benefits offered are for local workers. However, roughly 10% of promised pension benefits are managed by cities and counties (and a few school districts) for their own workers. The patterns and trends of local pension plans are similar to state pension plans, but underlying that data most of the averages are driven by just a few retirement systems in New York City, Los Angeles, and Chicago.
The “Local Pension Plan” Landscape
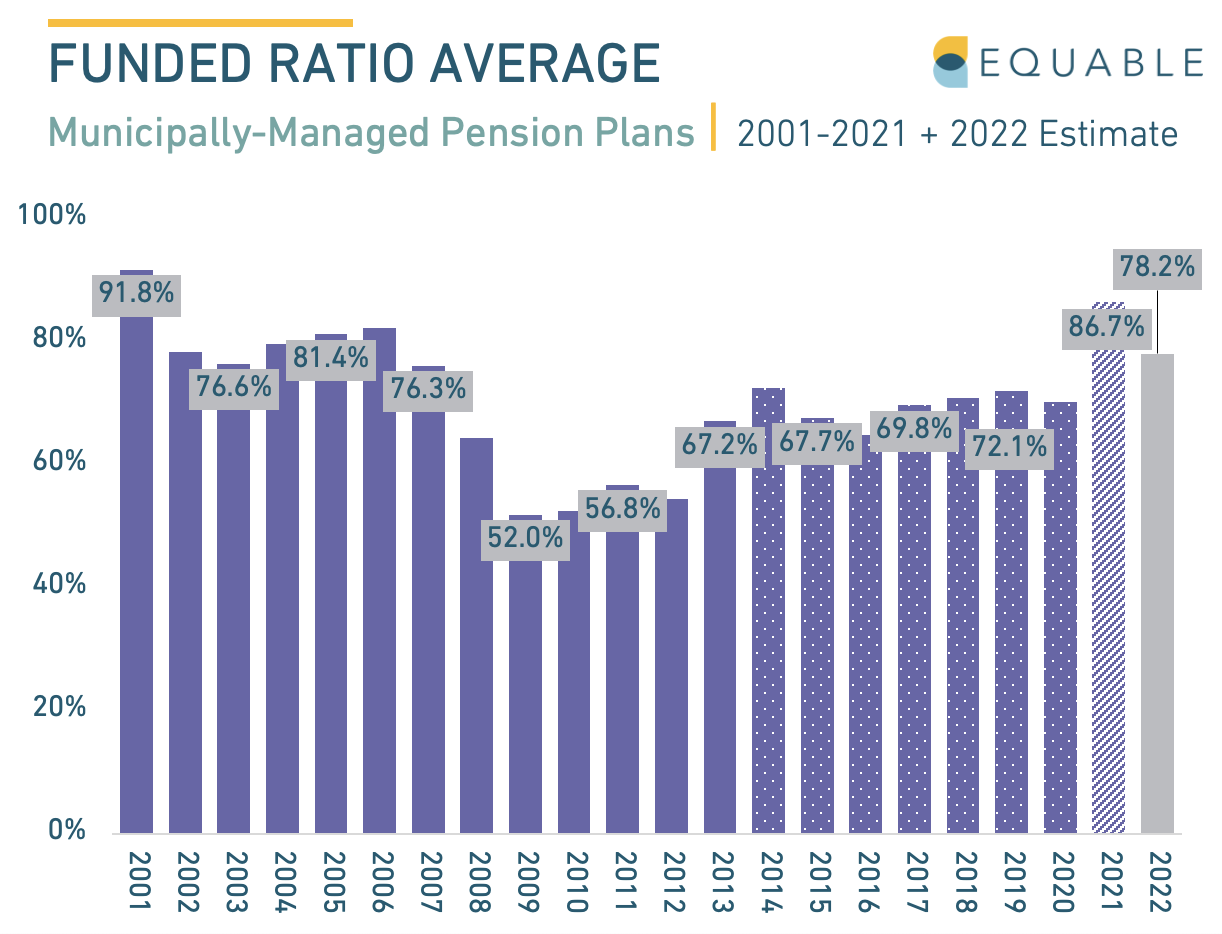
There are currently 61 municipally-managed defined benefit plans — or local pension plans — with over $1 billion in promised benefits (as of 2021). And the funded ratio for these pension plans tends to follow the same pattern as statewide plans, even if the absolute funded levels are a bit lower. For example, in 2009 local pension plans bottomed out at 52% funded while statewide systems were 63.8% funded.
Over the past decade local pension plans as a whole have actually experienced faster growth in their funded status than statewide plans. By 2019, the funded status of local pensions (72.1%) was effectively statistically the same as state pensions (72.8%). And both sets of retirement systems experienced huge gains in 2021.
Similar Market Dynamics, Different Funding Pressures
Local pension plans face the same financial market dynamics as statewide plans. In both cases, pension boards are aiming to earn investment returns that can minimize how much government employers have to contribute.
One area that state and local plans differ is in pressure to make regular contributions. Municipal plans have historically been better at making full required contributions, in part because they have less budgetary flexibility and are more sensitive to reductions in their credit rating that might raise the cost of borrowing.
However, while paying the full required contribution each year is important, there are much larger factors that influence the emergence of unfunded liabilities — such as having an assumed rate of return that is too high or waiting too long on making changes to actuarial assumptions. In turns out that local plans often have higher assumed returns, creating a tacit kind of underfunding even when all “actuarially required” contributions were paid.
As a result, the overall funded status of local plans isn’t meaningfully better on average compared to statewide plans just because they have been better paying their bills.
California, Illinois, and New York
While there are 61 large local pension plans spread across the country, the average funded ratio trends are generally dominated by just a few retirement systems in the New York City, Los Angeles, and Chicago regions.
Just seven retirement systems account for half of the pension benefits promised by largest local plans, all of them in California, Illinois, or New York. These seven are shown in Table 1 below in the first seven rows. The same table shows the 15 largest local retirement systems, also all in the same three large states, which collectively account for roughly 74% of all promised benefits from local pension plans nationwide:
Table 1: Local Pension Plans, Ranked by Amount of Promised Benefits (FYE 2020)
| __ | Retirement System Name | Promised Benefits (Total Pension Liabilities, FYE 2020) | Local Region |
|---|---|---|---|
| 1 | New York City Employees’ Retirement System | $89,884,946,000 | NYC |
| 2 | Los Angeles County Employees Retirement Association | $76,579,594,000 | L.A. |
| 3 | Teachers’ Retirement System of the City of New York | $75,115,996,000 | NYC |
| 4 | New York Police Pension Fund | $51,317,492,000 | NYC |
| 5 | San Francisco City & County Employees’ Retirement System | $32,031,018,000 | SF |
| 6 | Cook County Employees’ Annuity Benefit Fund | $27,634,518,984 | CHI |
| 7 | Public School Teachers’ Pension and Retirement Fund of Chicago | $26,377,865,250 | CHI |
| 8 | Los Angeles City Fire and Police Pension System | $23,969,714,355 | L.A. |
| 9 | New York City Fire Pension Fund | $23,302,435,000 | NYC |
| 10 | Orange County Employees Retirement System | $23,010,450,000 | L.A. |
| 11 | Los Angeles City Employees’ Retirement System | $22,527,195,000 | L.A. |
| 12 | Chicago Municipal Employees’ Annuity Benefit Fund | $17,814,812,242 | CHI |
| 13 | San Diego County Employees Retirement Association | $17,723,895,000 | SD |
| 14 | Chicago Policemen’s Annuity Benefit Fund | $15,494,740,334 | CHI |
| 15 | Los Angeles Water and Power Employees’ Retirement Plan | $14,465,357,848 | L.A. |
| Total Promised Benefits: Top 15 Local Plans | $537.25 Billion | ||
| Total Promised Benefits: Other 46 Local Plans | $186.75 Billion | ||
| Total Promised Benefits: All 61 Local Plans | $724 Billion |
Source: Equable Institute analysis of GASB 67 reports provided by the retirement systems. Data included from Omaha Police & Fire and Atlanta General Employees is based on accrued liabilities, due to lack of available GASB reports.
Because these select few retirement plans account for such a large amount of the promised benefits and funded status of municipally-managed retirement systems, as they go, so goes the average funded status of local pension plans. When looking over the past two decades at the funded ratio pattern for local plans (see the infographic at the top of this article), the pattern is effectively the same for all 61 local pension plans with $1 billion or more in liabilities and the 15 largest of that group on their own.
____________________
Additional Notes about New York City, Los Angeles, and Chicago
- New York City dominates this list of top plans, with $240 billion in promised benefits among four pension plans. (The city also has a smaller, fifth pension plan for department of education members.) On, average NYC’s pension plans were 78% funded, as of 2020. Looking historically, this is better than where the city’s plans were a decade ago, though not substantially different than they were before the financial crisis. While New York’s upstate retirement systems have generally been close to fully funded over the past several decades, New York City’s pension plans — managed separately, with their own investment managers, boards of trustees, and actuaries — have struggled. NYC is also is particularly exposed to financial market volatility due to a special supplemental benefit offered to some employees. However, there are positive aspects of NYC’s pension funding outlook. The collective NYC retirement systems have adopted a strong and conservative funding policy that aims to pay off accumulated unfunded liabilities within a 15 year period of accumulating them. This has resulted in needed contribution increases that will help the city’s pension funding in the long-term.
- The Los Angeles/Orange County region has over $160 billion in promised benefits from locally managed pension plans — and this is on top of benefits for teachers and public school employees through CalSTRS and CalPERS. The largest retirement systems in Los Angeles — for both city and county civilian workers — have generally followed the funded status trend of California’s statewide systems. Like CalPERS and CalSTRS, these civilian employee plans (LA County ERA and LA City ERS) were around full funding before the Great Recession, but crashed with much of the rest of the county and have only had modest improvement since then up to funded ratios in the 70% to 80% range. This stands in contrast to Los Angeles’ retirement systems for public safety employees (LA City FPPS) and water/power employees (LAWP ERP), both which took a similar hit during the financial crisis of 2008-09 but have been more resilient, recovering those losses and returning to near full funding.
- Chicago’s pension plans are uniformly distressed, with a few even facing the risk of insolvency if there are a few more years of negative asset shocks. Table 2 shows the seven pension plans managed by the city of Chicago plus a plan managed by Cook County, Illinois, all of which were facing funded ratios below 60% as of the end of 2020. The funded status of these systems definitely improved in 2021 with strong financial market returns, but then crashed again with losses during the first of 2022 (since most of these plans have fiscal years ending in December it is possible their 2022 funded status might improve from the poor positions measured as of June). Wherever the specific funded ratios wind up at in 2022 they are likely to be slightly better than in 2020, but still well below any reasonable metric of sustainability or resilience. This in turn means large contribution rate requirements that will continue to create pressure for the city of Chicago’s budget.
Table 2: Chicago Region Local Pension Plans, Ranked by Funded Ratio (FYE 2020)
| Retirement System Name | Funding Shortfall (Net Pension Liability, FYE 2020) | Funded Ratio |
|---|---|---|
| Chicago Metropolitan Water Reclamation District Retirement Fund | $1,121,071,432 | 58.5% |
| Retirement Plan for Chicago Transit Authority Employees | $1,832,410,820 | 51.4% |
| Cook County Employees’ Annuity Benefit Fund | $14,984,908,546 | 45.8% |
| Laborers’ & Retirement Board and Employees’ Annuity and Benefit Fund of Chicago | $1,588,591,710 | 44.4% |
| Public School Teachers’ Pension and Retirement Fund of Chicago | $15,440,803,229 | 41.5% |
| Chicago Municipal Employees’ Annuity Benefit Fund | $13,724,573,158 | 23.0% |
| Chicago Policemen’s Annuity Benefit Fund | $12,052,842,455 | 22.2% |
| Firemen’s Annuity and Benefit Fund of Chicago | $5,592,244,401 | 19.0% |