
State and local governments paid a record amount into their public retirement systems in 2023 — 30.4% of the salaries paid to public workers, or $180.7 billion. This fiscal year, 2024, those contribution rates have increased again up to 31.3% of payroll. And this increase is actually a good thing… at least from the perspective of pension fund members.
Consider that contribution rates paid in 2023 and 2024 were nearly double what public employers were paying in 2007 (16.8%) before the Global Financial Crisis (GFC). This dramatic increase is almost entirely due to unfunded liabilities, which persist despite financial markets fully recovering from the GFC and the U.S. Great Recession. Investment returns alone won’t be enough to restore plans to a healthy funded status. More money is needed to pay down these liabilities.
However, from a state budget, taxpayer, or employee benefit perspective, this growth in costs is unwelcome. Nearly two decades after the GFC, state and local governments are paying record amounts into their public pension funds, yet they still face significant challenges:
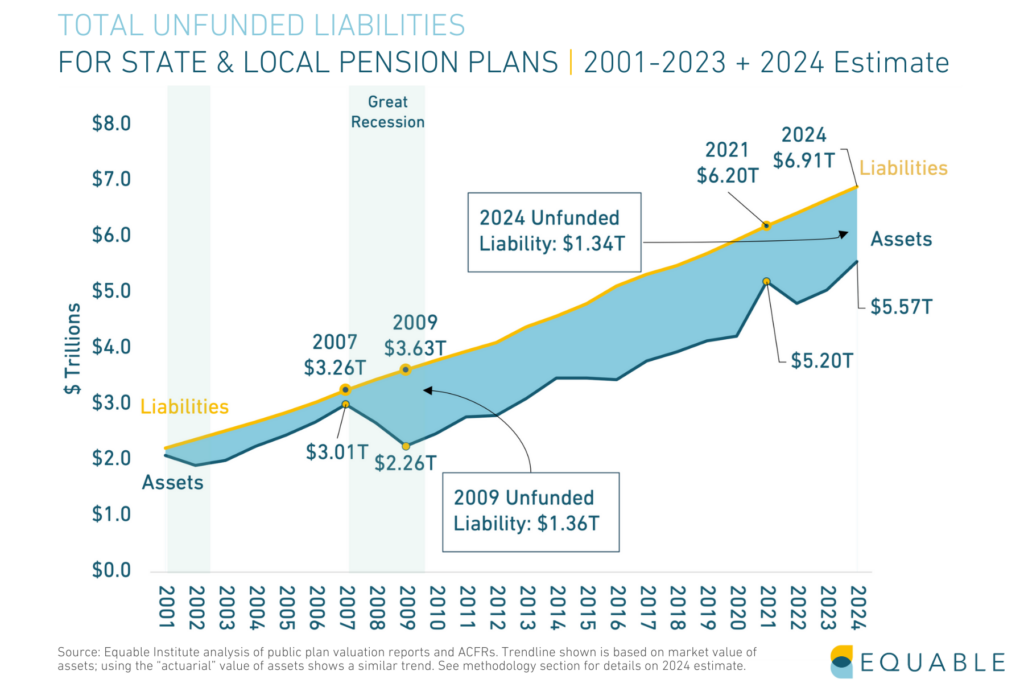
- America’s pension plans still have $1.34 trillion in unfunded liabilities as of June 2024, and unfunded liabilities have been persistently over $1 trillion since 2008.
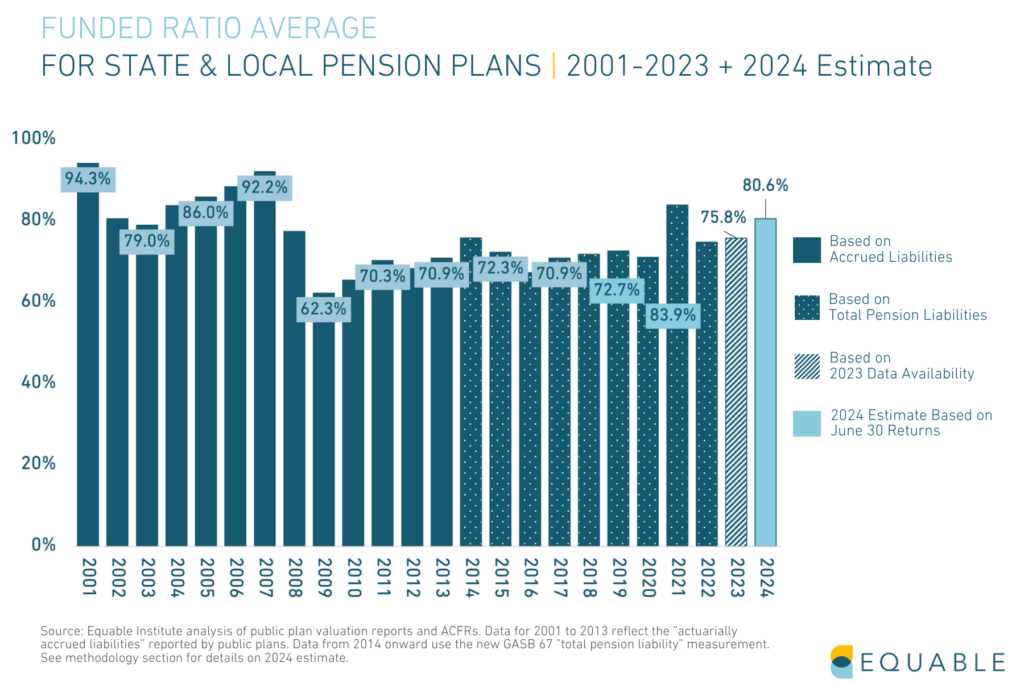
- The average pension plan funded ratio has not rebounded to pre-Global Financial Crisis levels, and is currently at a fragile 80.6% as of June 2024. (And this is the 17th consecutive year of a fragile funded status.)
- The higher contributions paid have not been enough to prevent interest from continuing to accrue on unfunded liabilities — which is the fastest growing contributor pension debt for the country as a whole. This is a particular problem when combined with increasing benefit payments and rising negative cash flows.
Collectively, this is the challenge of pension debt paralysis.
Pension debt paralysis is the state of being where insolvency is no longer a near-term concern, but where public pension plans are stuck with a fragile funded status that will require forever increasing costs without meaningfully moving toward the elimination of unfunded liabilities.
That reality has a rich irony: the only plausible solution to this funded status challenge is more money.
It is reasonable that taxpayers and state leaders aren’t eager to dump even more cash into their state retirement systems given the financial status quo of these plans. And it is admirable that many states have pushed past these concerns anyway with supplemental contributions over the last two to three years. Those additional dollars have helped, but they’ve been drops in the proverbial bucket.
It would actually have been better to use those supplemental dollars to ease the budgetary path to higher contribution rates that would at least ensure interest on pension debt is being paid down each year along with the adoption of more realistic investment assumptions. Sure, state agencies are now, on average nationally, consistently paying 100% of their actuarially determined contributions rates. But that praise can only go so far when the underlying policies that are used to calculate those required contribution rates are using unrealistic investment assumptions and allowing for interest to accrue on liabilities, which contributes to persistent unfunded liabilities.
With insufficient “required” contribution rates, the result is public retirement systems mired in pension debt paralysis. And that paralysis means a steady incremental increase in pension costs which do not provide a long-term path for eliminating the more than $1 trillion shortfall in unfunded liabilities.
Ultimately, the government complacency allowing for pension debt paralysis is harming taxpayers with lower quality public services while public employees experience reduced retirement values, such as inadequate inflation protection of their benefits. America is simply not doing enough to ensure public retirement benefits are affordable for taxpayers while providing adequate and secure retirement income for public employees.
The rest of this essay breaks down all of these points above with historic data from Equable’s State of Pensions 2024 to layout the case for why pension debt paralysis is the national status quo and why it shouldn’t be an acceptable new normal.
Jump to a Section:
- Pension Debt Paralysis Visualized
- Examining the Factors Causing the Pension Debt
- Contribution Rate Increases Have Been Too Slow and Not Enough
- Pension Plan Fragility is Compounded by Negative Cash Flow + Volatility
- Consequences for Public Employees
- Conclusion
Pension Debt Paralysis Visualized
The goal for public pension funds is to be around 100% funded every year. The funded status can bounce around a bit, going above and below 100% from year to year. However, it should never be below 90% for more than three years in a row — pension funds that stick above that mark are resilient, those below that threshold are fragile (or worse).
You can see in these charts that public plans have been nowhere near this 100% funded ratio standard for a long time.
- The funding shortfall — the gap between promised benefits and accumulated assets — is persisting and not meaningfully going away.
- The funded ratio chart shows modest gradual improvement from a low point in 2009, but it is troubling that the funded ratio has only inched back into the low 80%s despite record financial market performance and a doubling of contribution rates.
In any given year, pension professionals will tell you don’t put too much stock in the numbers for a single year. This is partly because pension funds are long-term focused retirement plans, and partially because funded status figures are just a single snapshot in time, usually a picture taken on June 30 or December 31 each year.
But this common wisdom is as important to keep in mind now as ever has been because the volatility in funded status has shot up. The average size of the change in funded status from year to year (e.g., “volatility”) has been notably higher since the Pandemic (technically a “standard deviation” of 5.6% from 2020-24) compared to the period after the Global Financial Crisis (a 3.7% standard deviation for the years 2009-19).
While we can see in this data the high level trend of persistent pension debt, we have to look another layer down in pension data to understand the causes of the paralysis.
Examining the Factors Causing the Pension Debt
Managing pension plans requires a wide range of assumptions about future events: investment returns, mortality rates, workforce turnover, salary growth, inflation, government contributions, and more. There are lots of places where actual experience may not line up with actuarial expectations — leading to unfunded liabilities or improved funding.
Pension funds compare actuarial and assumed experience every year, along with other factors that can change the value of liabilities (this is formally reported as “actuarial gain/loss” data, or a similar term). We can use the data to look at the internal structure of public pension plans and measure exactly which categories are causing the country’s collective unfunded liabilities.
Back in 2000 public pension funds were fully funded, based on the national average (using actuarially valued assets). But between 2000 and 2022, funded status went from being $20.6 billion overfunded to $1.26 trillion underfunded (again, using actuarially valued assets).
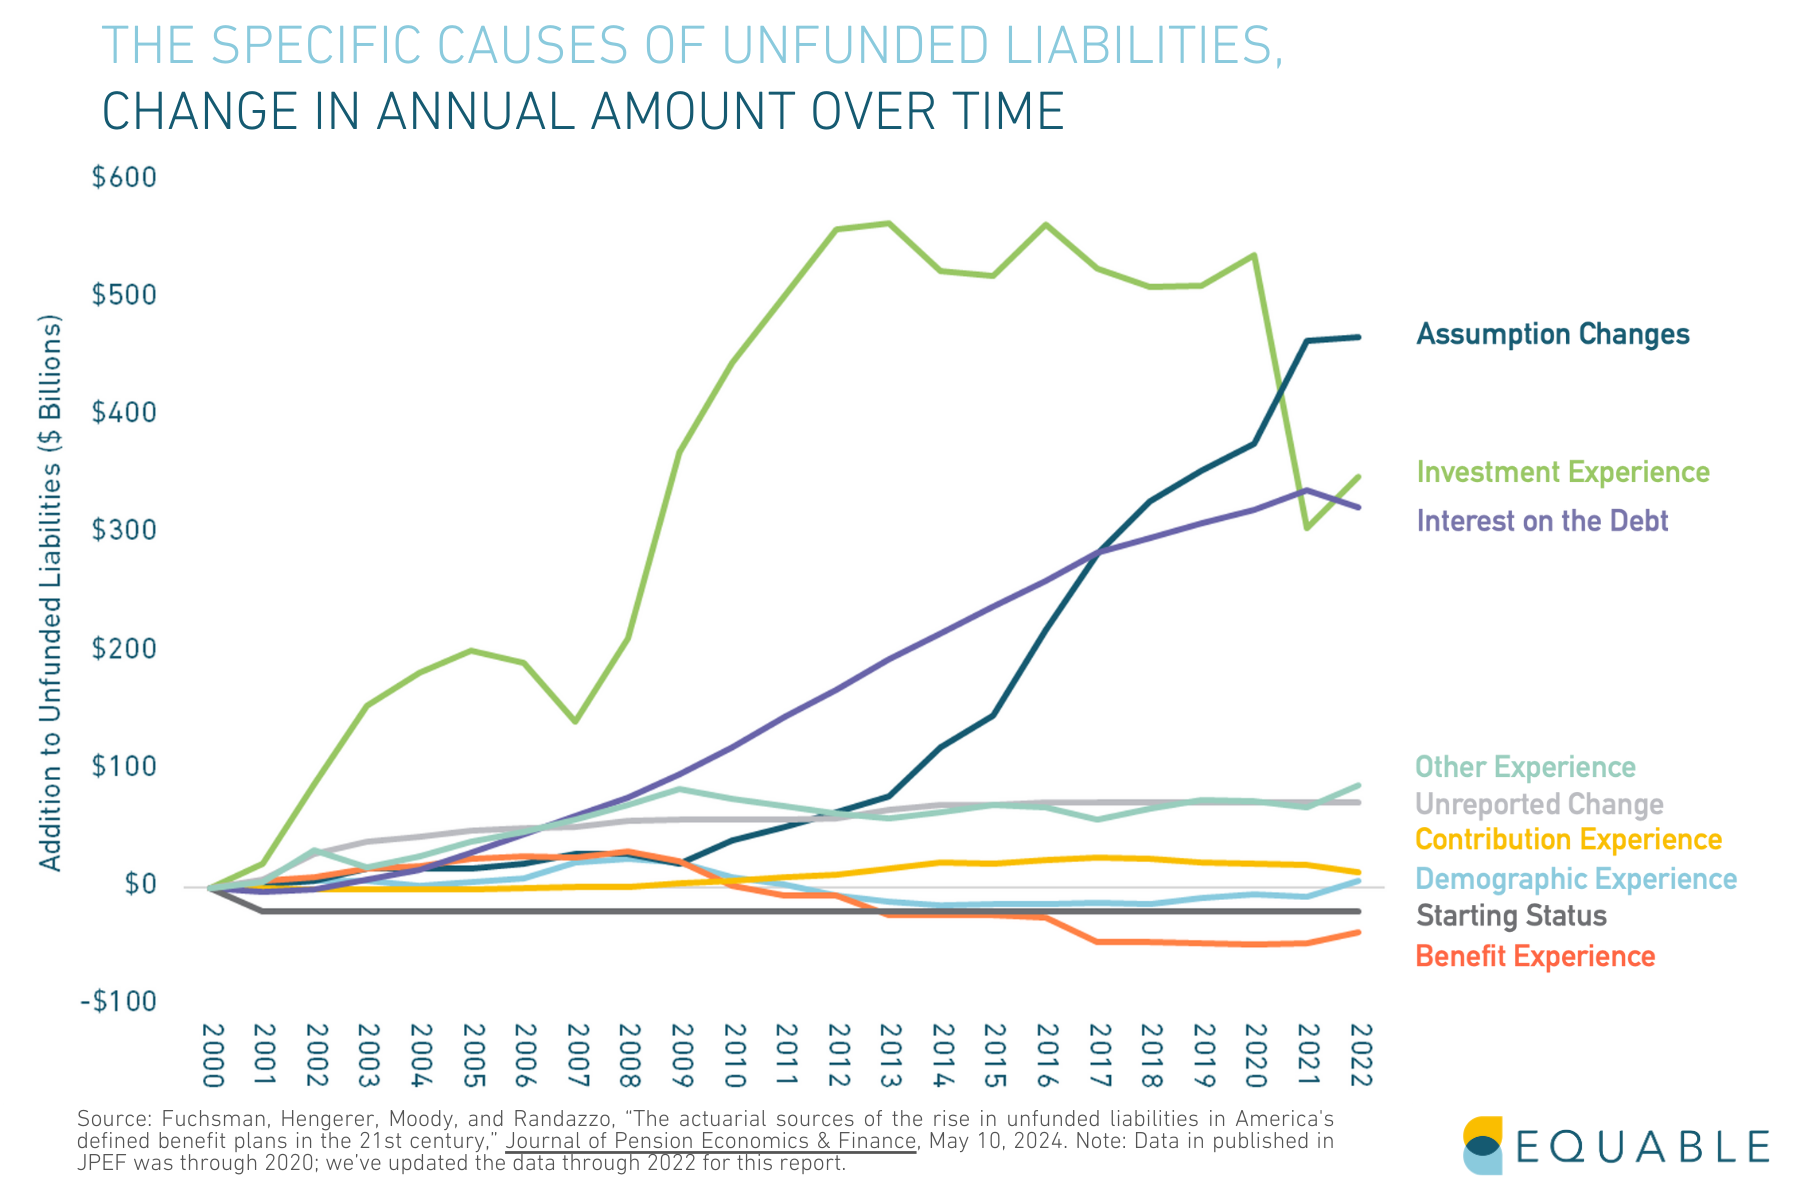
The chart above shows nine categories that have contributed to those national unfunded liabilities between 2000 and 2022:
- Assumption Changes: Changes to liabilities due to adopting new assumptions — e.g., adopting improved, more realistic accounting for future investment returns
- Interest on the Debt: Changes to unfunded liabilities because the expected contributions into the pension fund are greater or less than interest growth on liabilities
- Investment Experience: Changes to assets due to investment returns higher/lower than assumed
- Demographic Experience: Changes to liabilities because actual experience in retirement, payroll, mortality, etc. was different than assumed
- Benefit Experience: Changes to benefit values, COLA experience, or other benefit rules that were different than previously used to measure liabilities or that were assumed
- Contribution Experience: Contributions paid are greater, the same, or less than expected — e.g., if employers pay 100% of the actuarially determined rate, there is no change, but payments above or below this amount will lead to a change in unfunded liabilities
- Other Experience: Changes to liabilities that are reported in a generic “other” category — e.g., the data reported by the pension plan groups a portion of the change in unfunded liabilities into a non-transparent category just deemed “other” (often for small amounts, but occasionally for large amounts that add up over time)
- Unreported Change: Changes to liabilities that are not documented in pension plan reporting — e.g., the pension plan shows a change in unfunded liabilities but fails to report categories explaining all of the categories
- Starting Status: Funded status at the start of a plan’s actuarial gain/loss data reporting
The figure shows that overtime the initial driver of growth in national unfunded liabilities was underperforming investment returns (e.g., Investment Experience being less than actuarially assumed). However, before 2008 there were many other contributors. After the GFC, the dominant causes of unfunded liabilities were investment returns underperforming expectations plus Interest on the Debt (because contribution rates were too low). Starting around 2013, actuarial Assumption Changes started to become a major contributor as well.
Meanwhile, all other categories remained roughly the same in dollar terms as contributors to unfunded liabilities between 2000 and 2022, meaning they declined as a percentage of the factors contributing to unfunded liabilities.
A notable exception was the decline in the role that Benefit Experience played in unfunded liabilities. Between 2000 and 2008, benefit enhancements and COLAs paid above expected rates accounted for as much as $31 billion in unfunded liabilities. Since then, reductions in benefit values primarily due to rules that offer lower COLAs or that cut COLAs all together, have meant net Benefit Experience has helped reduce unfunded liabilities by as much as $50 billion.
Taken together, just three factors explain 90% of the collective $1.2 trillion in state and local unfunded liabilities as of 2022: Assumption Changes, Investment Experience, and Interest on the Debt.
The trendline over time is important for understanding pension debt paralysis. Going forward pension funds will have to not just earn their assumed rate of return every year, but also will need to beat their expectations by enough to contribute more than $300 billion to pension fund assets under management. State legislatures (and city governments managing their own pension funds) will need to adopt contribution rate increases that permanently reverse the growth trend in Interest on the Debt (one step toward this would be to cap amortization schedules at no longer than 20 years) and that pay for the improvement in actuarial assumptions about the future (notably more realistic investment and payroll growth assumptions).
Without seriously addressing these specific things, other changes are likely to just allow for pension debt paralysis to persist.
*Note: Complete actuarial gain/loss data was only available through the fiscal year ending 2022. Some of the specific dollar elements of these trends will likely be slightly different once 2024 data is comprehensively available, but it is unlikely to have a meaningfully different overall picture.
Contribution Rate Increases Have Been Too Slow and Not Enough
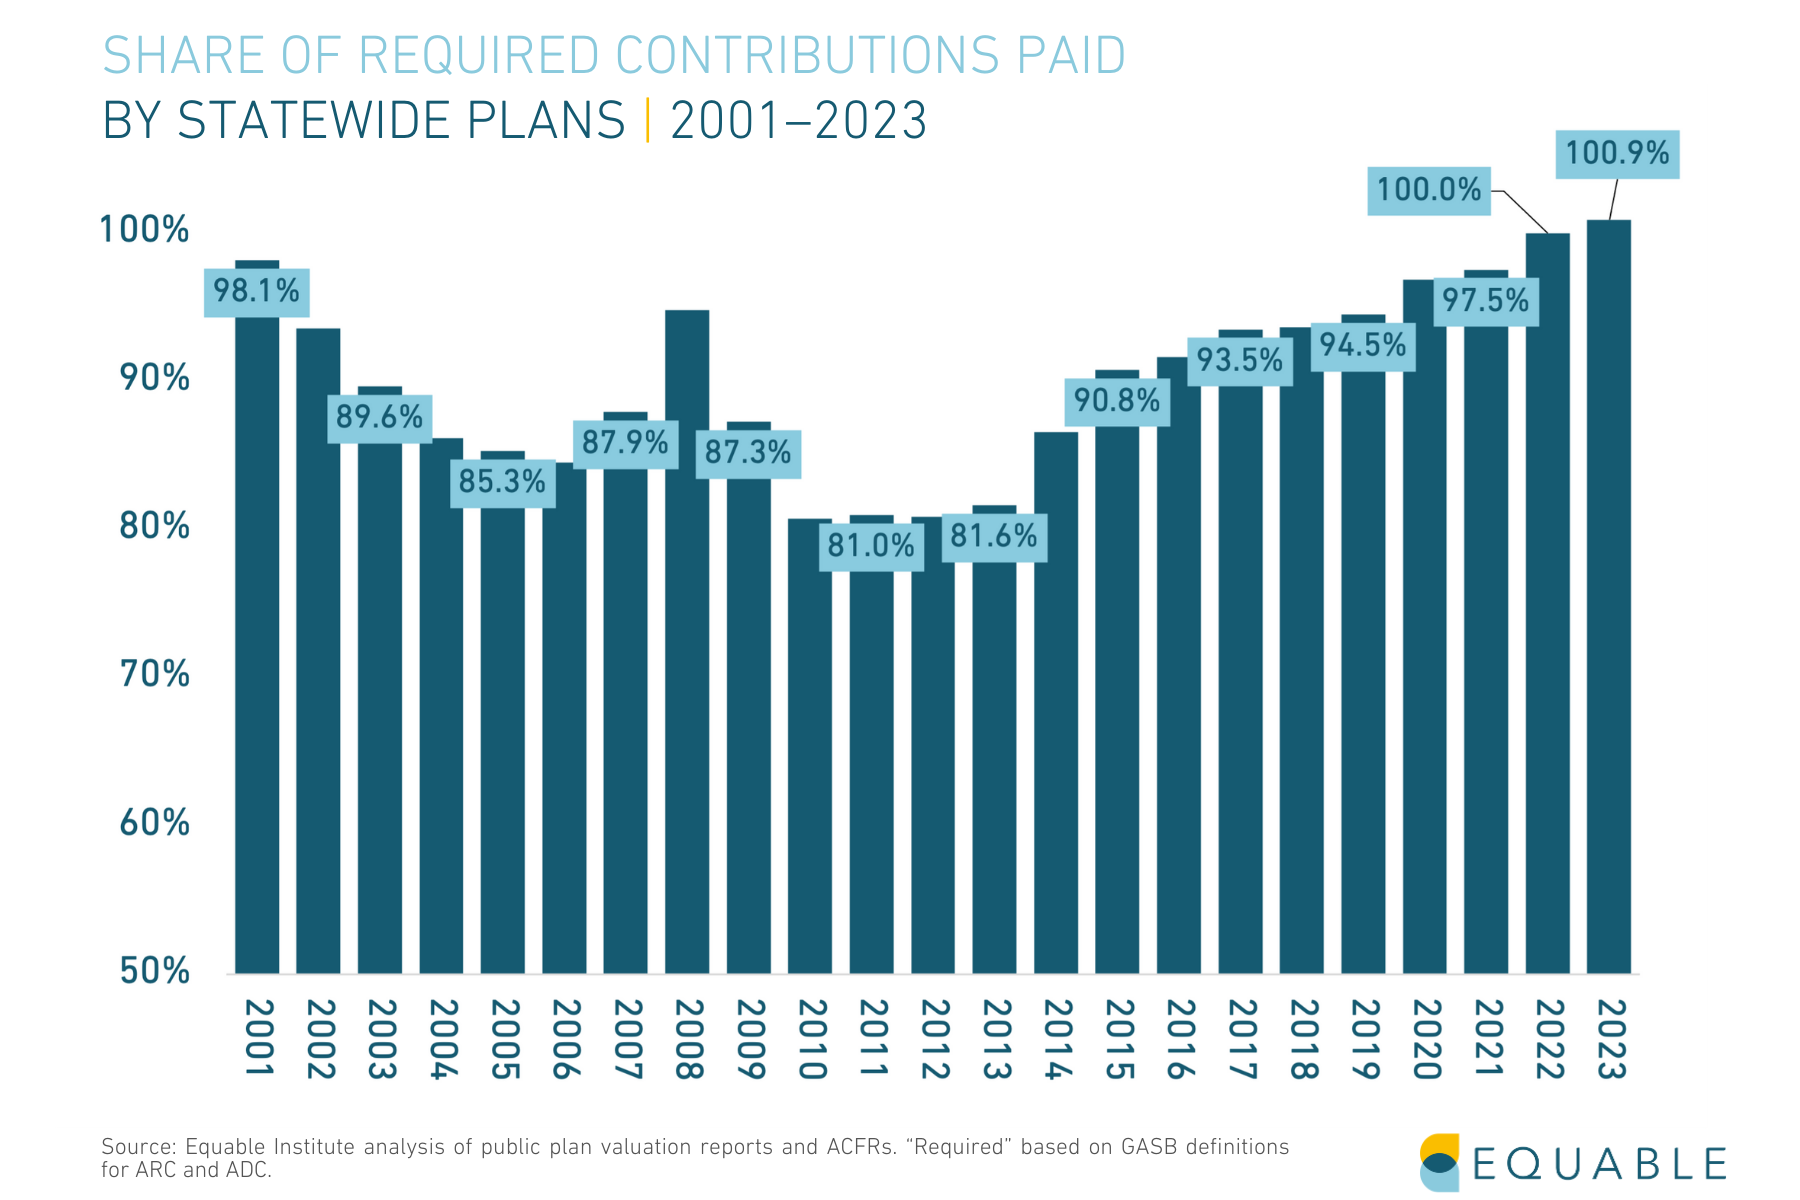
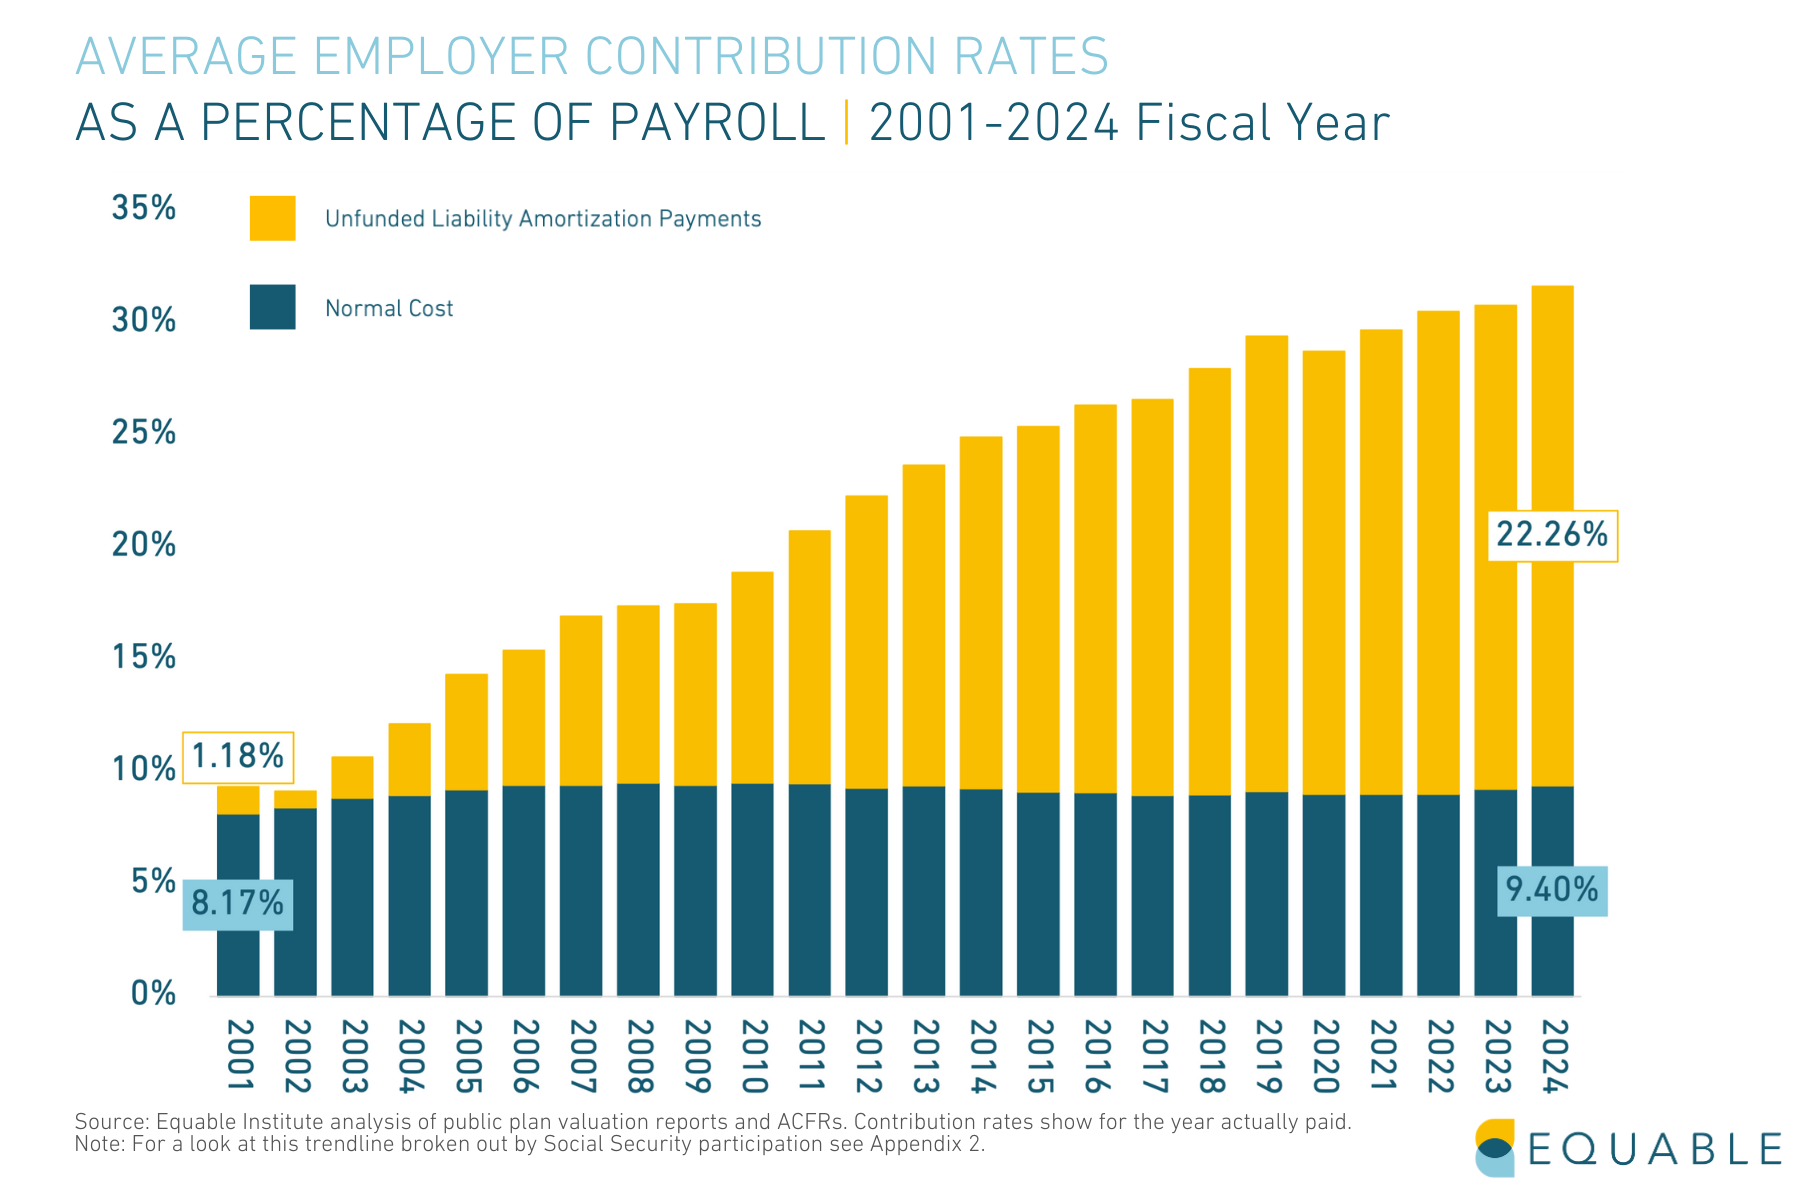
States have finally returned to a pattern of paying 100% of actuarially required contributions — at least, for the national average. There are still some plans where contributions are notably below their actuarially determined rate, such as Texas TRS. And Illinois’ pension plans only target a 90% funded ratio when determining their contribution rate. However, previous bad actors like New Jersey have caught up to their required contribution rates and enough states made supplemental contributions in the past few years to yield total payments slightly above required for the nation as a whole.
The restoration of states paying their pension bills is also notable in that it came in the context of rapidly growing contribution rates. The major reason for the increase has been unfunded liability amortization payments, shown the figure above. And the growth in costs certainly has helped to keep unfunded liabilities from growing even more than they have.
However, despite all of this positivity, interest on the pension debt is still steadily growing — as we showed in the previous section breaking down the factors contributing to unfunded liabilities. This is happening because the funding policies many state pension funds are using to determine their contribution rates are insufficiently designed. For example, states that allow for unfunded liabilities to be amortized over a 30 year period are assuming that in future decades there will be a larger capacity to pay down pension debt, so they count on large future taxpayer help to cover unfunded liabilities that exist today. This allows for an actuarially determined contribution rate to be less than it otherwise would be if pension debt were aimed to be paid of in 15 or 20 years. The net result is that the relatively lower calculated contributions are often less than the interest rate on pension debt that is accruing.
Therefore, even with record contributions being paid into state pension fund coffers that are, on average, at or above actuarially determined levels, there is still upward pressure on unfunded liabilities from interest growth that is allowed for by insufficient funding policies.
Pension Plan Fragility is Compounded by Negative Cash Flow + Volatility
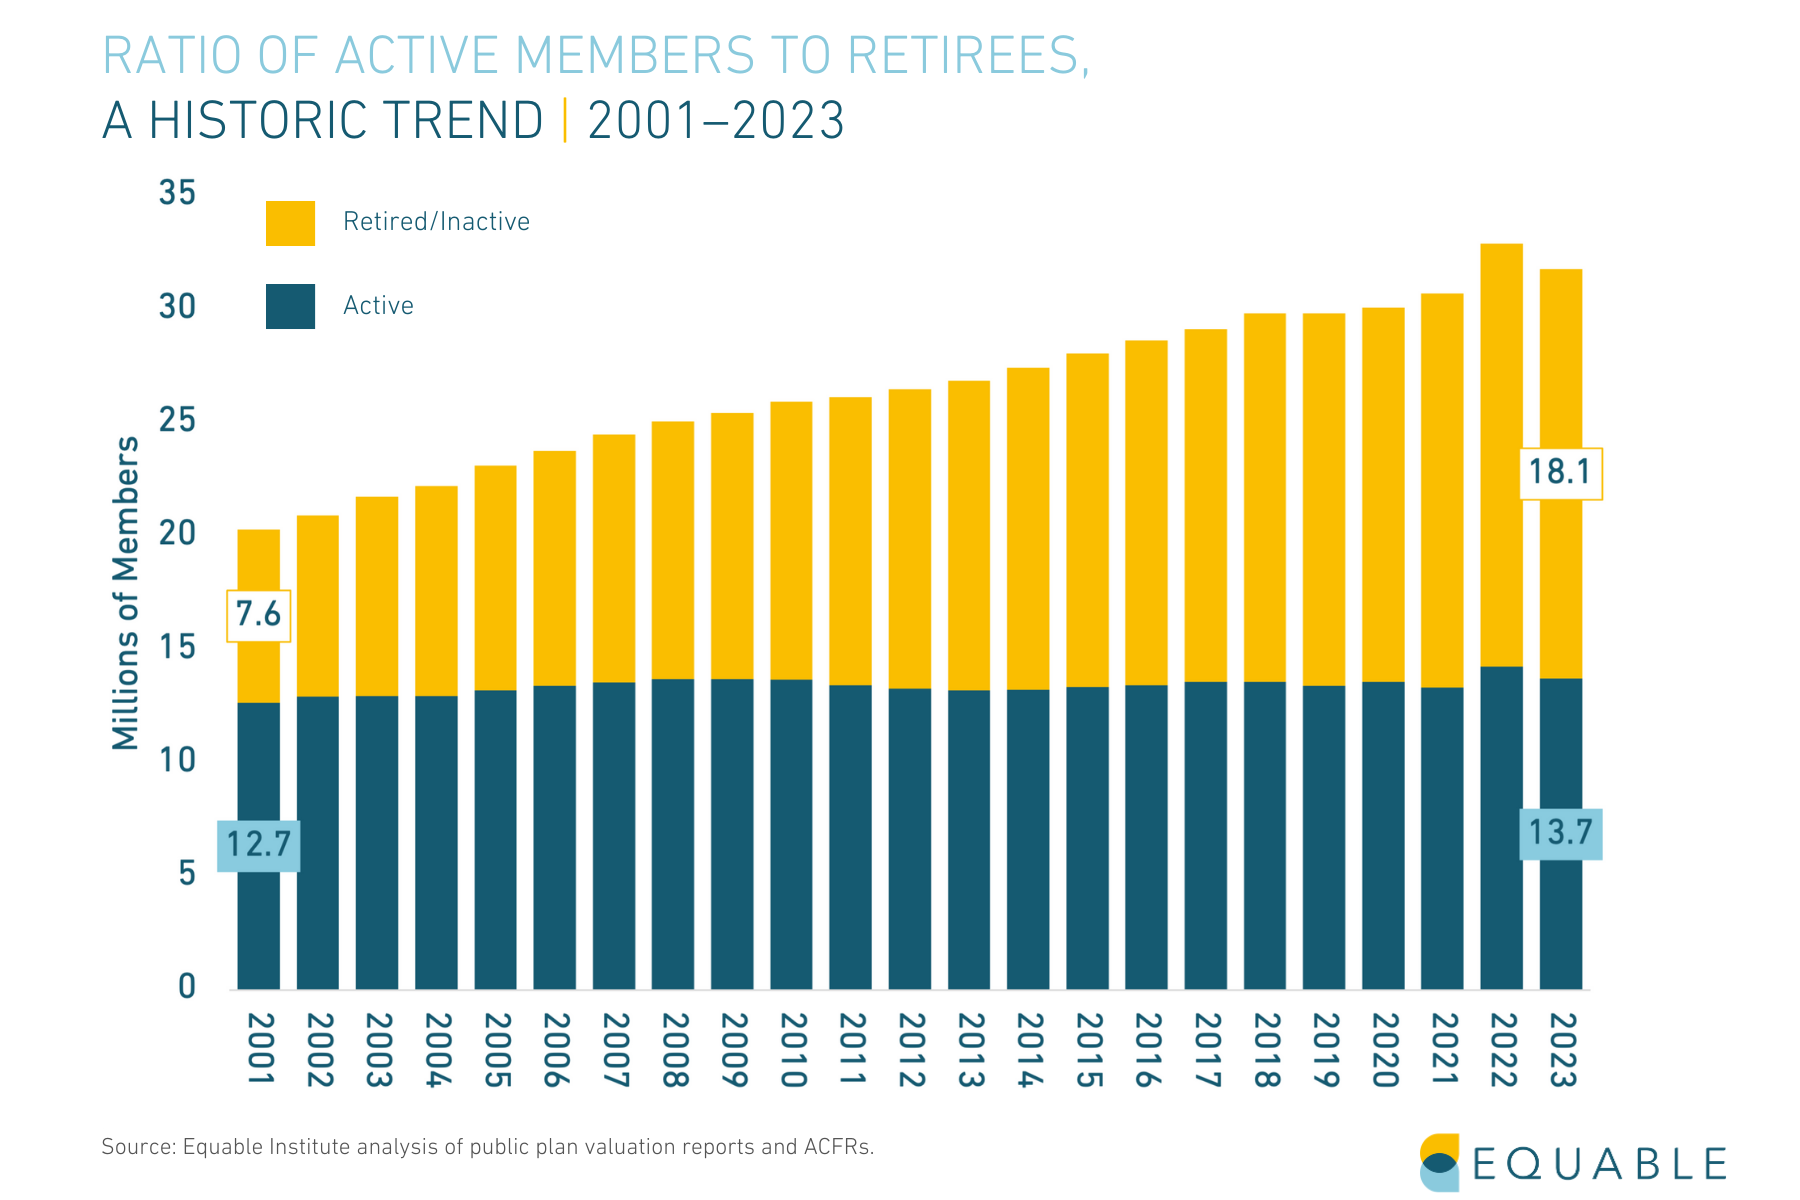
In 2013, the number of retired public employees passed the number of active public pension fund contributors for the first time. Over the 11 years since, the ratio of active to retirees has expanded, as shown in the above figure. Along with this increase in retired members has been an increase in benefit payments.
For fully funded pension plans, this is not actually a problem. Assets for anticipated benefits are in place, and asset allocations are calibrated to ensure contributions for new members are growing to pay their benefits in the future, while cash is available to pay for retired member benefits. But for unfunded plans, negative cash flow can be a problem because it puts pressure on investment returns to overperform expectations.
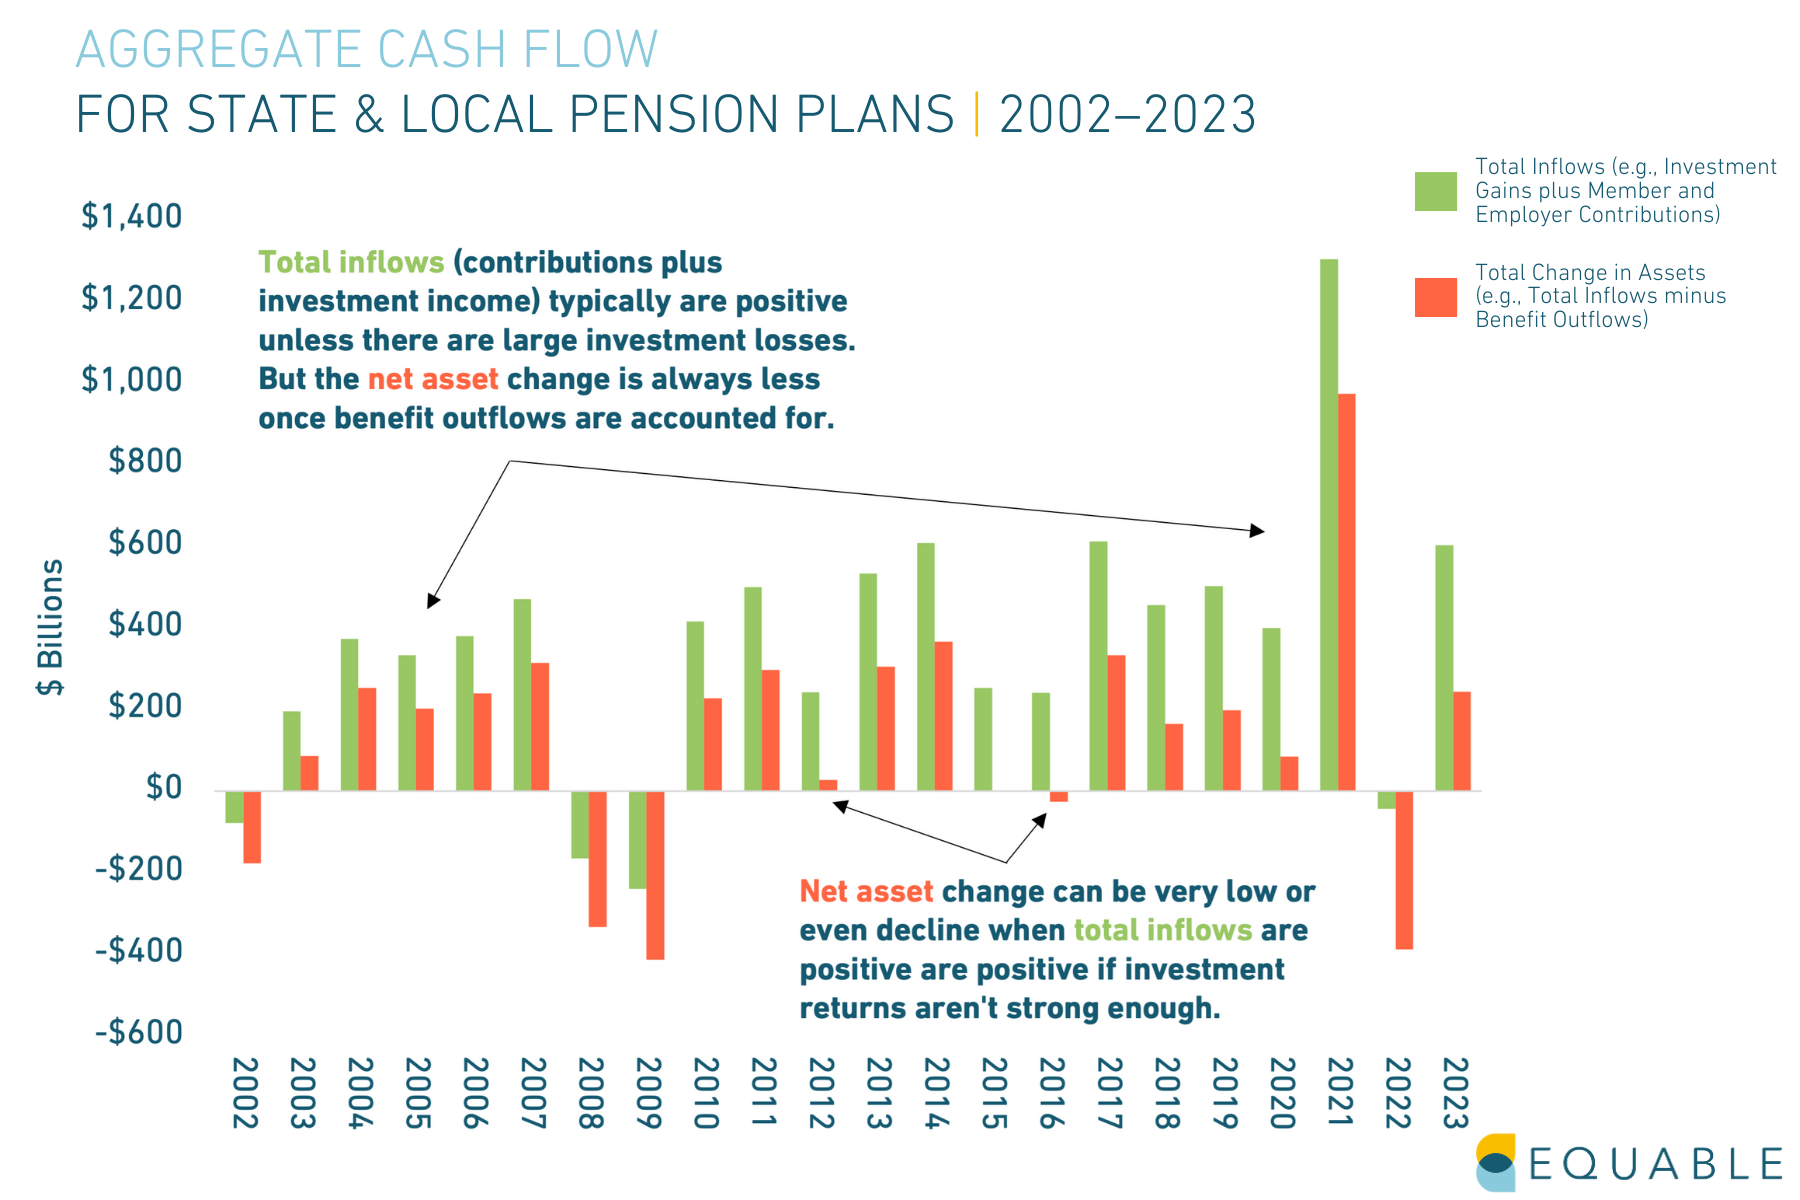
Before the GFC, most years resulted in net asset growth for pension funds — even after accounting for benefit outflows — because of strong investment income. However, since then the size of benefit payment outflows has grown much larger than contribution inflows from members and employers. This has resulted in some years where net assets decline even if investment returns are positive — that is, as shown the figure above — there have been some years where total contributions plus investment returns have been less than benefit payments, on a national combined basis.
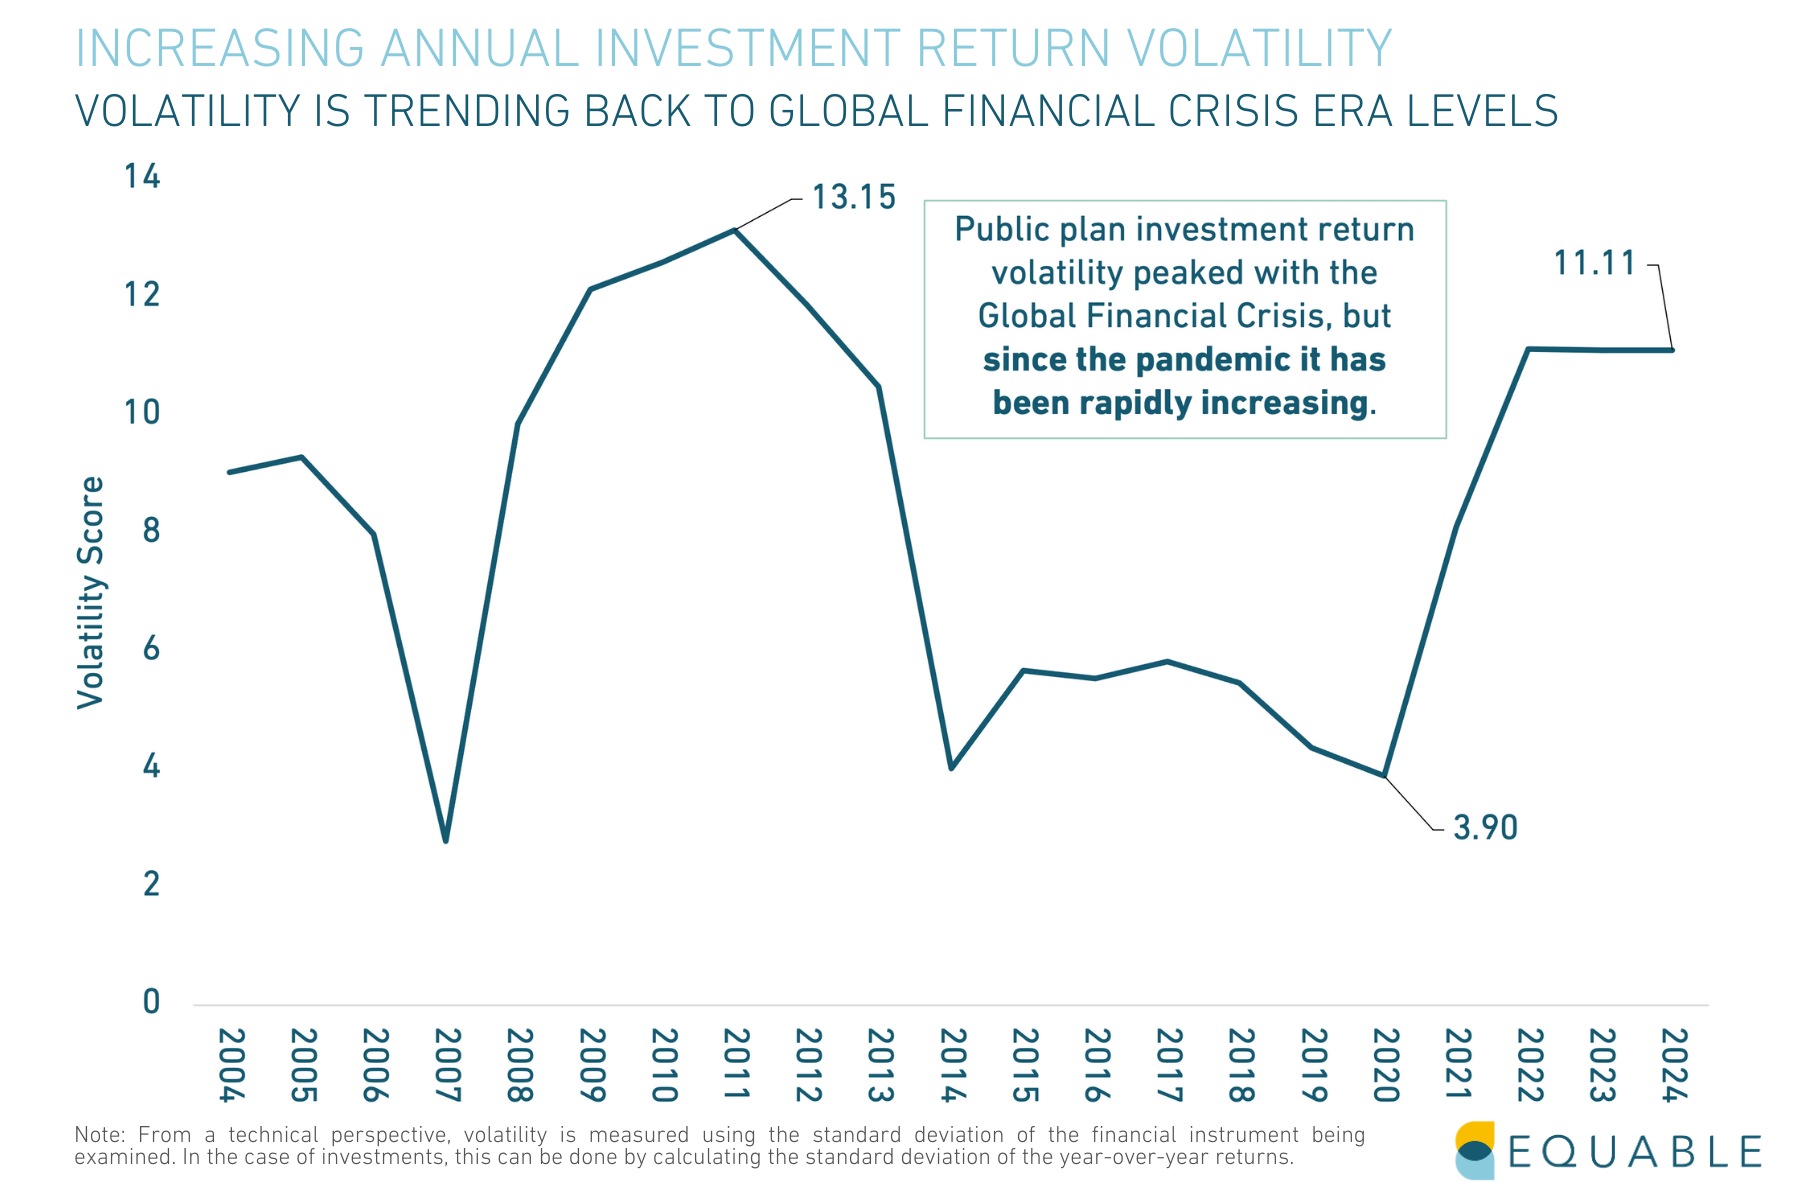
This is a notable concern in the context of investment return volatility, also shown in the above chart. In finance, volatility is a measure uncertainty related to asset prices or investment returns.
Savvy investors can use volatility to their advantage, including some pension funds. However, generally pension funds prefer stability because investment returns are important for determining contribution rates and for managing cash flow with regular required benefit payments.
The figure shows a “volatility score” where the higher the number, the more uncertainty there is around investment return patterns and trends. And since the pandemic struck investment volatility has surged to levels last seen around the GFC. This means in any given year there is an increased probability that net assets will decline even if investment returns are positive, particularly compared to before the pandemic.
A major contributing factor to this level of volatility has been an expansion of pension fund investments in alternative asset classes. The chart below shows that the share of pension fund assets that are deployed to private equity, real estate, hedge funds, and other alternatives to stocks and bonds has grown to 33.7% of the roughly $5 trillion in public plan assets. And these alternative investments generally carry a higher degree of volatility in their rates of return compared to traditional portfolios of stocks and bonds.

Together, all of this means that public plans as a whole are facing a precarious balancing act. They are relying on higher-risk, more-volatile alternative investments to generate needed investment returns. The attempts to generate higher investment yields are in part due to the need to address negative cash flow for underfunded pension plans. But the rate of growth in benefit payments is only going to continue, amping up the pressure on investment returns. To-date even solid returns over the past decade haven’t been sufficient to meaningfully drive pension plans forward toward resilient funded status and its unlikely that on their own they will save pension funds in the future.
Consequences for Public Employees
Over the last decade, pension funds have earned on average 6.85% (2015-2024, including estimates for this fiscal year). This is roughly in-line with the 6.88% average assumed rate of return that public plans are using as of 2024. But to the degree that investment returns have been decent in any given year over the last decade, it is unlikely to have affected a growing chasm between market performance and public employee sentiment about the benefit values they’ve earned. And that’s because while there are visible costs of pension debt paralysis that show up in financial reports — such as growing contribution rates that don’t lead to sufficient funding improvement — there are hidden costs too.
1. A lack of inflation protection of benefits.
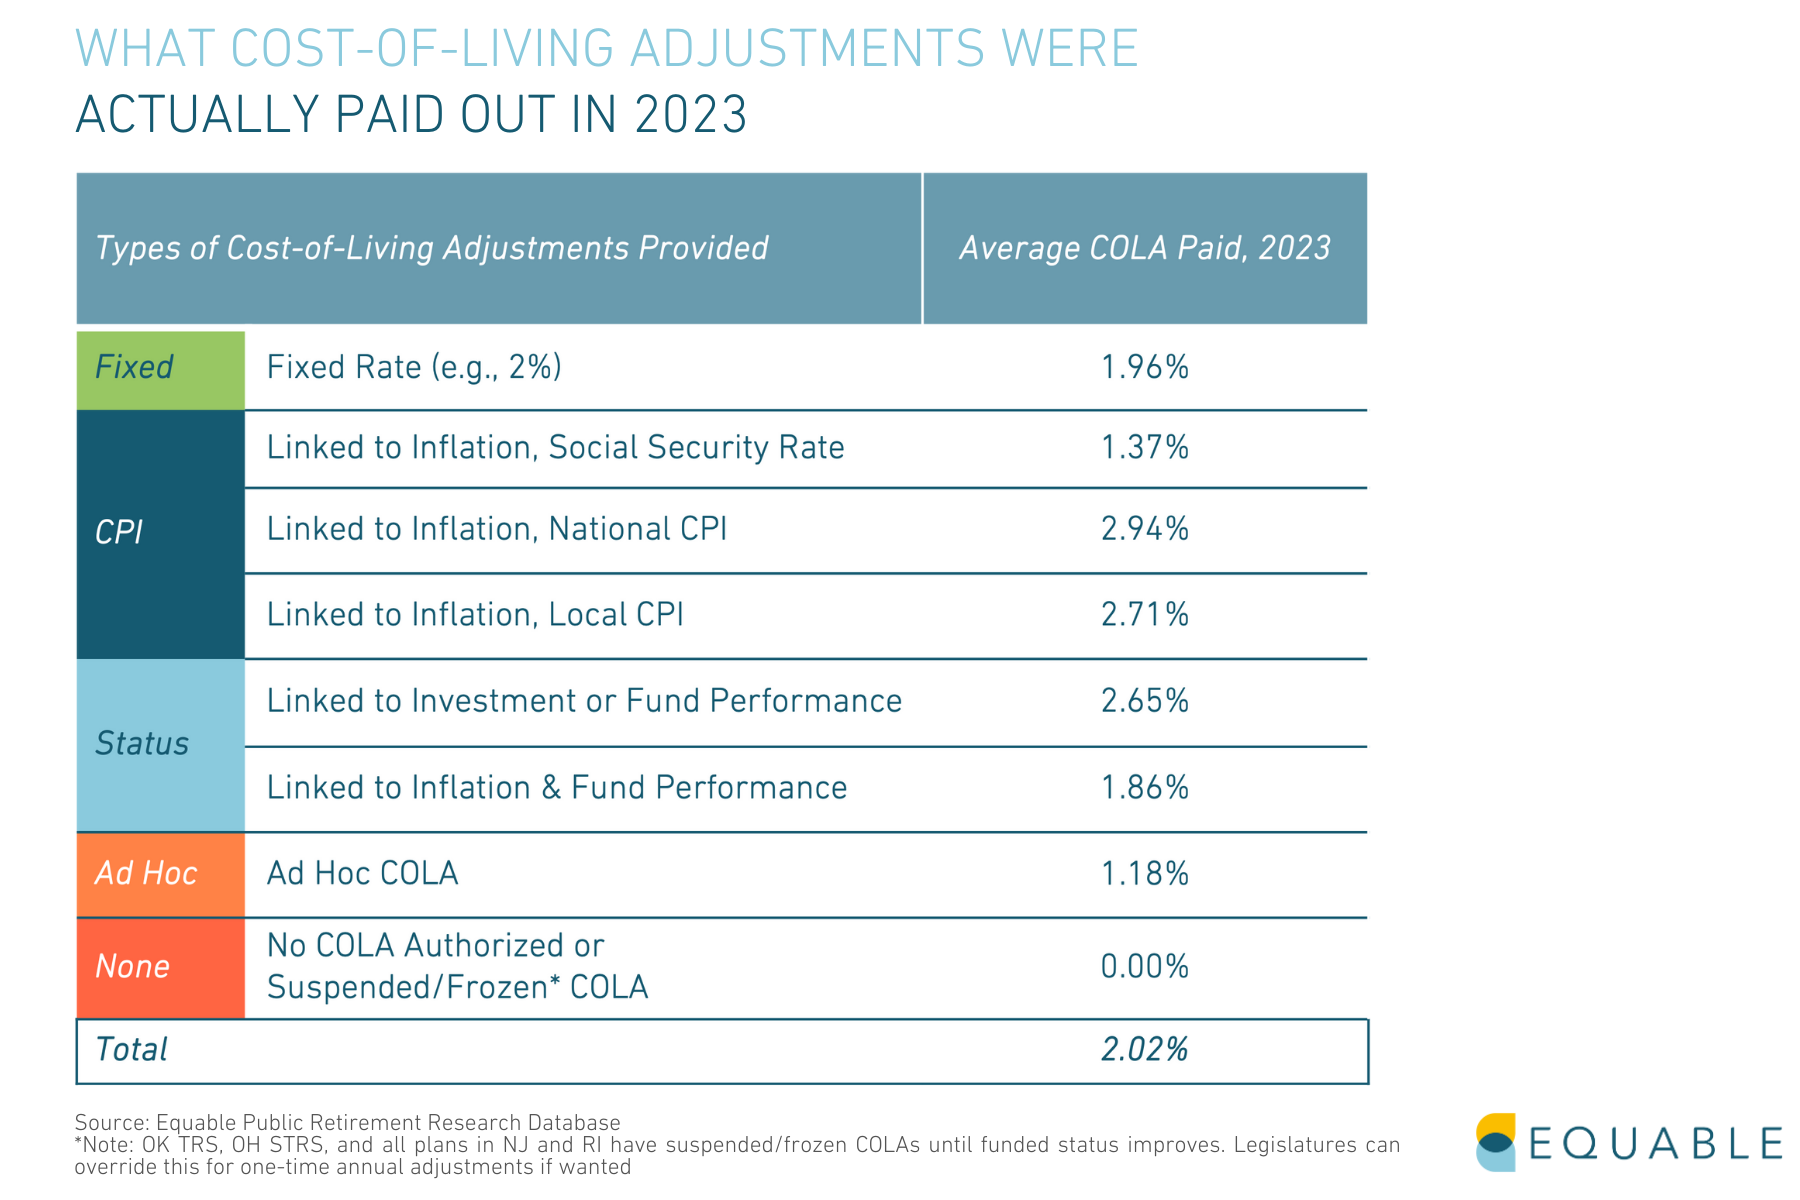
Many state pension plans authorized cost-of-living adjustments for retiree benefits over the last few years to address inflation. However, 31.3% of benefit tiers offered no inflation adjustment at all. And among those plans that did pay a COLA, they were less than actual inflation. The average COLA paid in 2022 at 1.8% was much less than the 9.1% average rate of inflation nationally; and the 2.02% average COLA paid in 2023 was also below 3% actual national inflation.
However, one effect of the persistently high costs of pension debt paralysis is that states and pension funds have less fiscal flexibility to offer larger COLAs that better match inflation (or to offer any COLA at all for public pension plans that are not designed with inflation protection built into the standard provisions).
No matter how the typical COLA provision is structured, on average they do not keep up with inflation when inflation is high. Generally, COLAs are designed to preserve the purchasing power of benefits when inflation is less than 3%. And this problem is only going to get worse overtime as the newly created benefit tiers over the past decade often offer lower valued COLAs due to a change in provisions from the legacy plan such as a lower maximum rate, or no longer offering a compounding COLA.
2. Declining value of benefits for new hires.
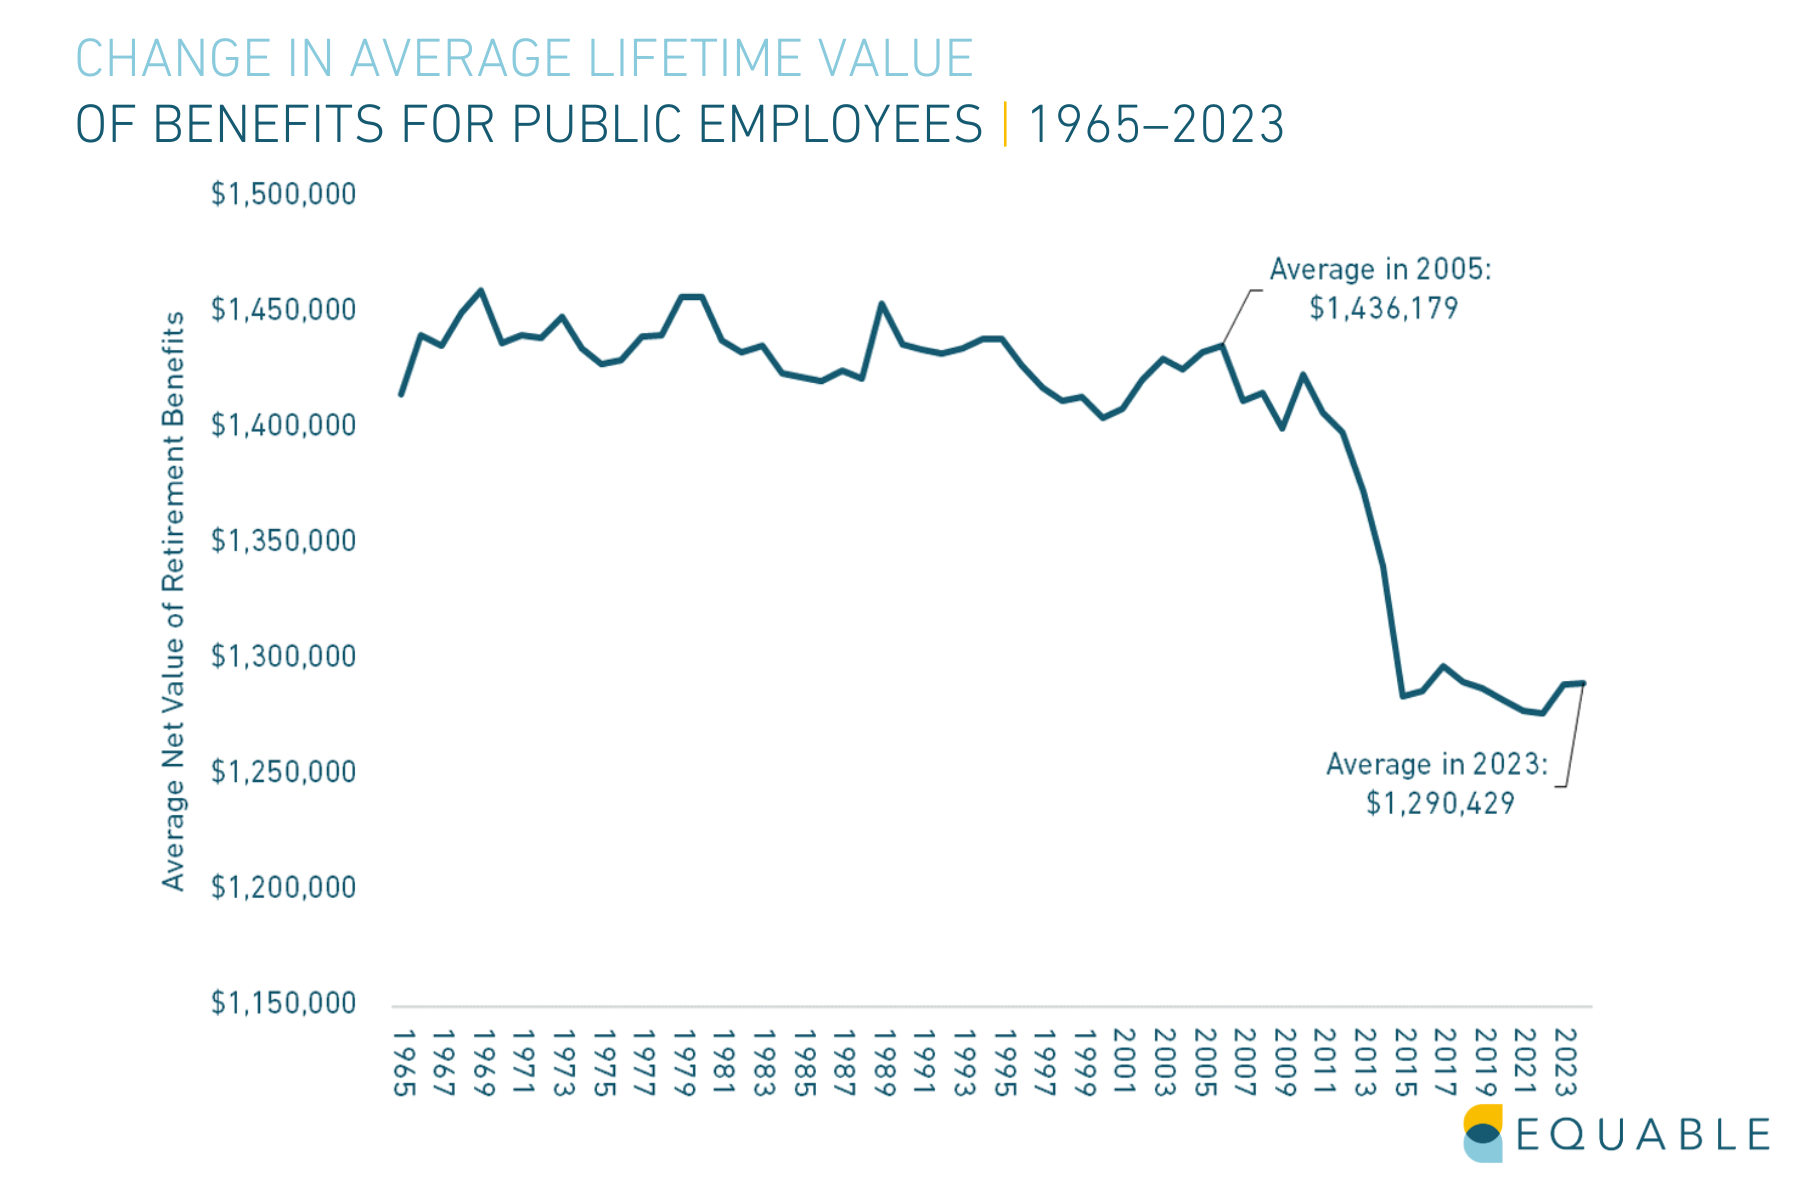
Lower valued COLAs have been a major contributor to the reduction in the value of public employee pension benefits generally. The figure above shows what a 25-year-old new public employee would expect the lifetime value of their pension will be worth based on:
A. the benefit rules offered the year they are hired,
B. working until the plan’s normal retirement age, and
C. earning the average salary for members of their plan, which increases based on the plan’s salary growth assumptions.
The blue line is equal to the expected lifetime value of benefits, e.g., the value of all future pension checks someone would expect to receive during their retired years, measured in today’s dollars. The trend line underscores a dramatic the change in the value of public pension benefits over the last two decades compared to the previous 40 years: A new public employee today would expect to earn a future benefit that is about 10% lower than if they started working in 2005.
3. Hidden funding cuts to public services, like education.
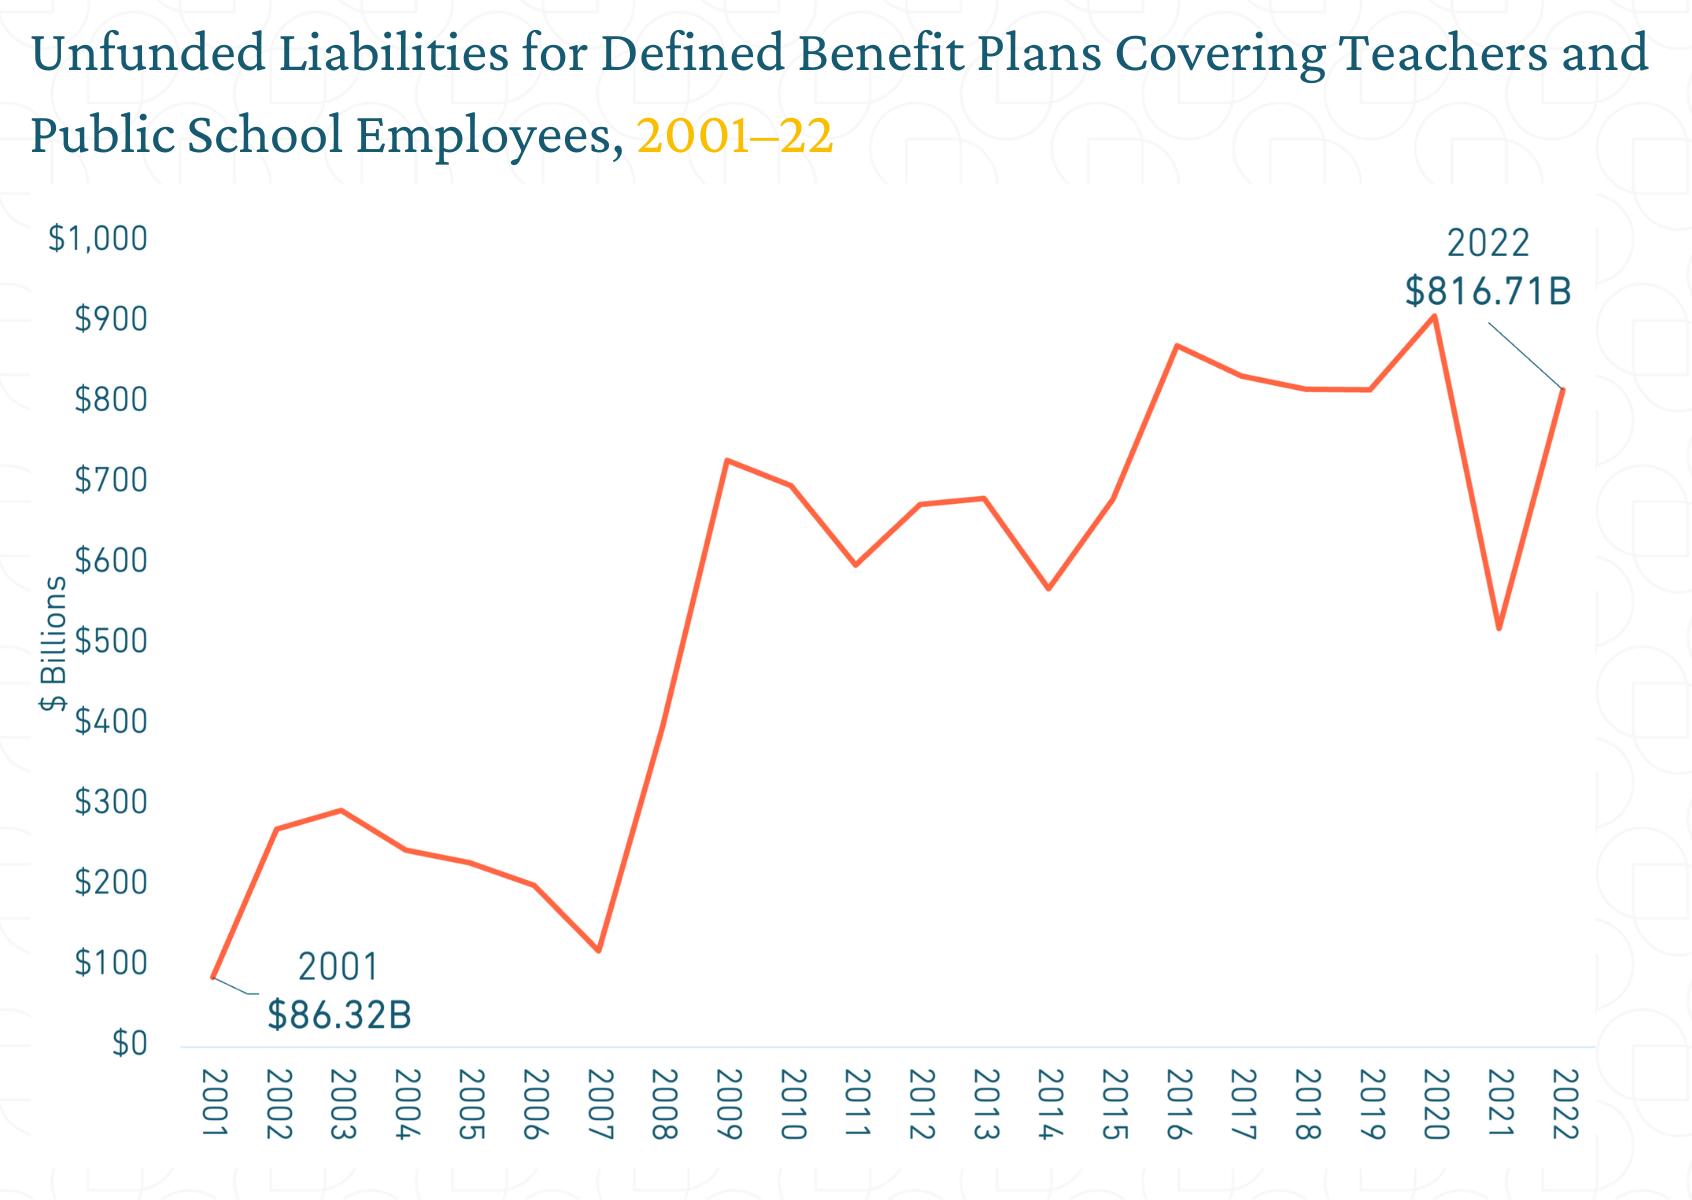
Teacher pension costs have grown significantly faster than K-12 education spending over the past two decades, driven by teacher pension unfunded liabilities. These rising costs have necessitated larger contributions from states legislatures and local school districts’ budgets to fund retirement benefits. As a result, teacher retirement costs have consumed an increasing share of total K-12 education funding, siphoning off money that could be spent on important resources and programs to improve educational outcomes for students and provide better supports for teachers. In fact, growing teacher pension debt has caused retirement costs to triple as a share of state and local education budgets since 2001, as shown in the above figure.
This is a Hidden Education Funding Cut. And it is a very real effect of pension debt paralysis today. The problem isn’t pensions, but the way that states are paying for them.
Conclusion
As pension debt paralysis has set in, we’ve seen a stalling out of progress on an improved funded ratio at around 80% with unfunded liabilities persisting over $1 trillion. The factors contributing to these unfunded liabilities are coalescing around three interwoven factors related to assumptions about investment returns, actual investment returns underperforming what’s needed, and contribution rates being insufficient to stop interest growth on unfunded liabilities.
The irony is that even with a lack of sufficient contributions, the contribution rates that are being paid are at an all time high. There is a steady ticking up of dollars flowing into public pension plans, but not at a level necessary to meaningfully breakthrough pension debt paralysis.
Looking forward there are some clear factors that will put pressure on unfunded liabilities related to growing benefit payments, negative cash flow, and volatility around investment income that is increasingly necessary to ensure pension plan assets are growing from year to year.
The net effect isn’t just a long-term concern about government employer costs or pension fund solvency, but a near-term influence on public worker benefits themselves and taxpayer supported services — e.g. there are hidden costs to pension debt paralysis that don’t show up in an annual comprehensive financial report.
There are ways to adopt solutions to eliminate pension debt paralysis. Some states have adopted serious changes that create realistic paths to pay off unfunded liabilities using improved actuarial assumptions, better “amortization schedules,” and contribution rate minimums. Whatever the needed state by state changes are, though, they require serious conversations and a need to prioritize how to adopt such contribution rate changes in a way that all pension plan stakeholders are involved.