Resource
State of Pensions 2021 Explained: Unfunded Liabilities as a Share of State Economic Output
A common metric for measuring the fiscal health of a pension plan is the funded ratio. But on its own this metric doesn’t tell us everything we want to know about the pension plan. It is also important to consider how good or bad a pension plan’s funded status is relative to the size of the government that created it.
As a Percentage of GDP
For example, a low funded ratio may signal problems for the health of a retirement system. But if the pension fund itself is relatively small compared to the budget of the government sponsor, then the situation may not be as dire as it appears on paper. Arizona’s pension fund for elected officials (closed in 2012) is 31% funded, but is so small that means the unfunded liabilities are “just” $650 million. That’s certainly a lot of money, but compared to the $40 billion state budget or $360 billion state economic output, it is a manageable sum.
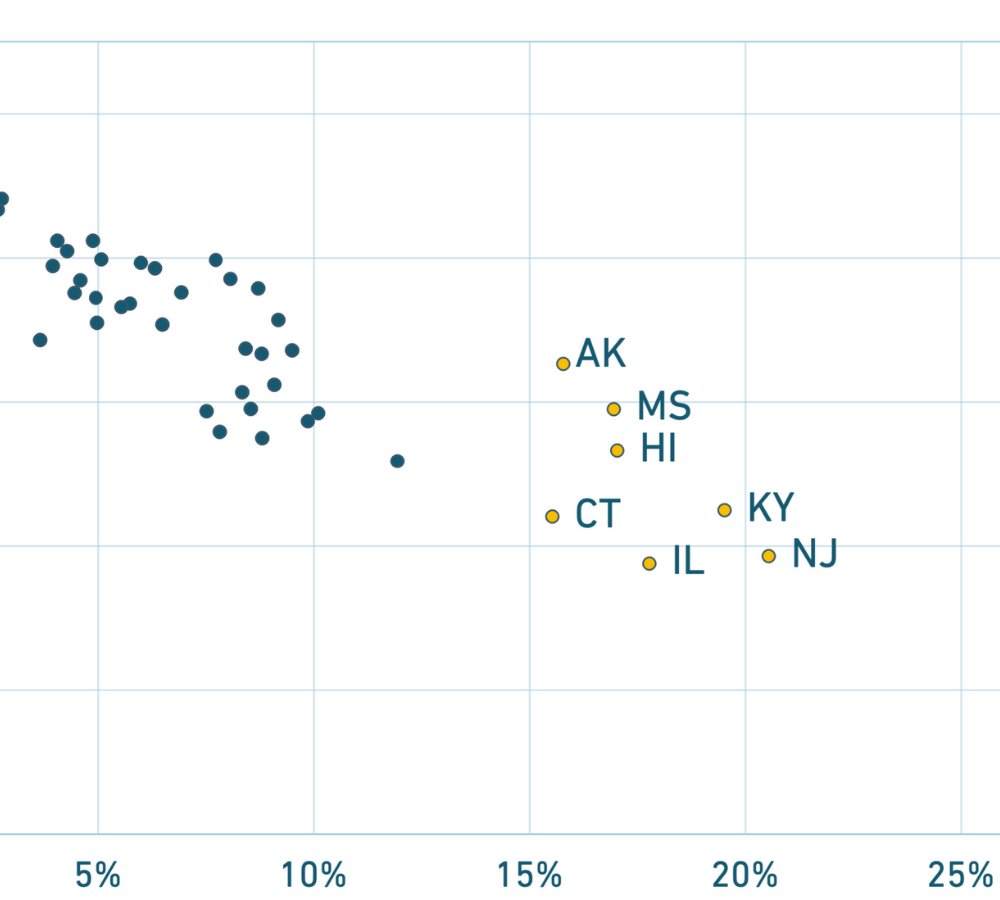
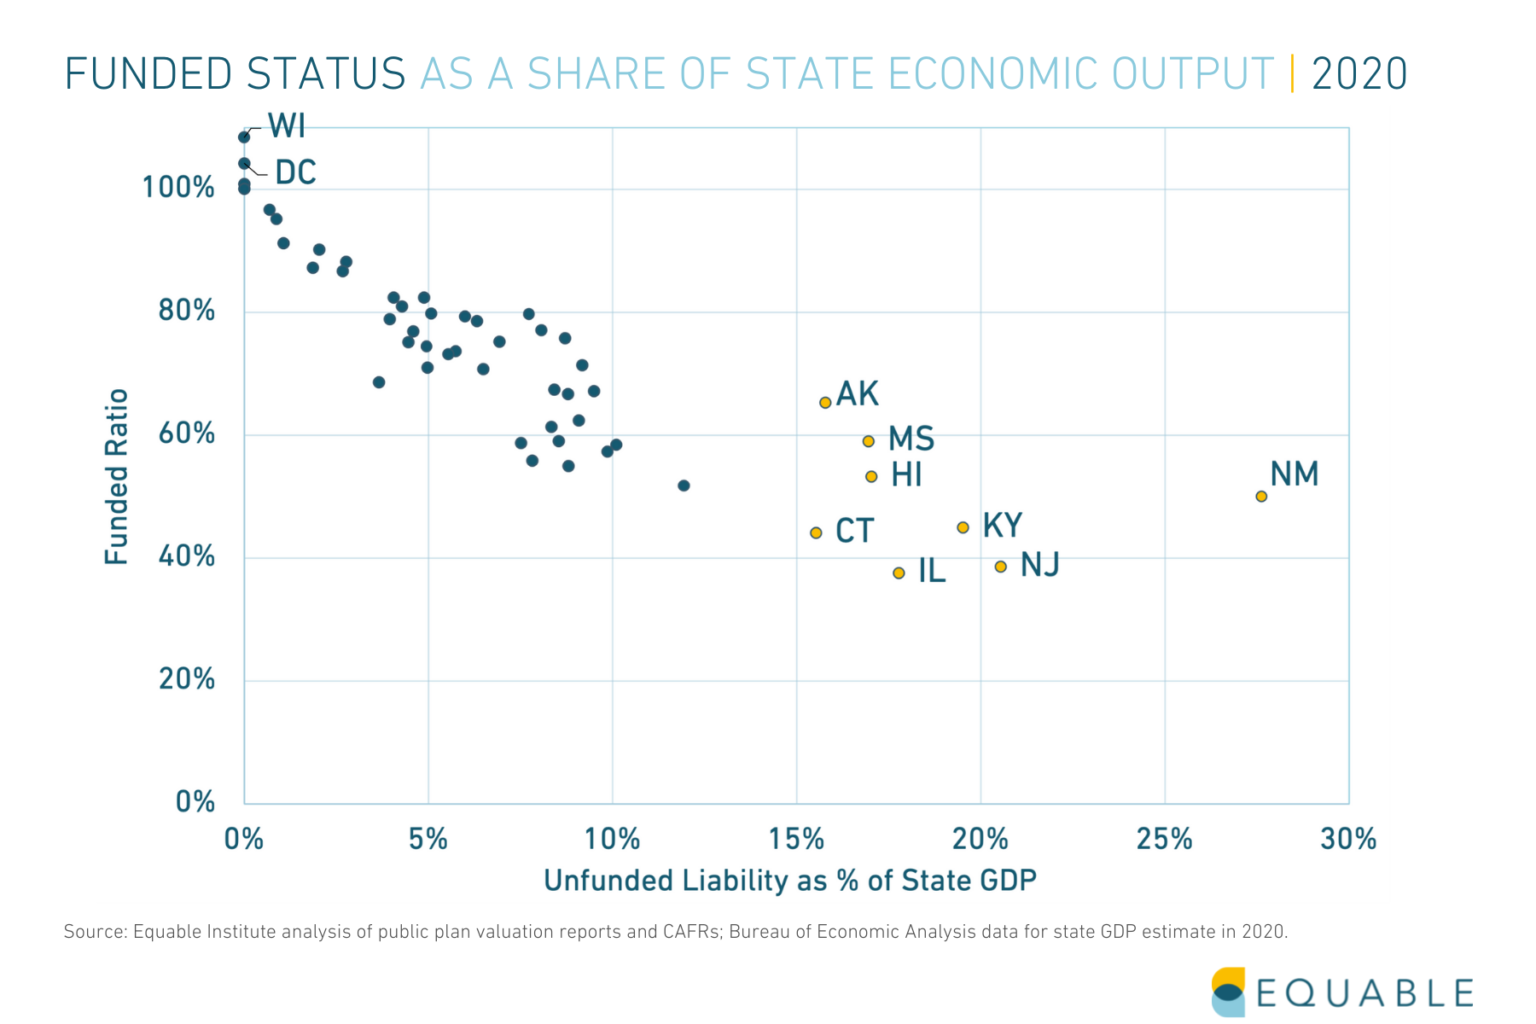
Or for another example, consider this comparison: Hawaii’s total unfunded liabilities are about $15 billion, somewhat comparable to Florida’s $20 billion shortfall. But compared to the size of the state’s economic output, Hawaii’s dollar figure could be much more destabilizing, since the unfunded liability is 17% of annual state GDP; by contrast Florida’s unfunded liability is 4% of local economic output.
Understanding the size of unfunded liabilities relative to the size of a state’s economy gives a sense of what scale of resources will be needed from a local tax base to improve funded status. In 25 states, unfunded liabilities are more than 6% of state GDP; and in 9 states the collective funding shortfall for statewide pension plans is over 10% of state economic output.
Last year we said the pandemic would lead to higher unfunded liability to GDP ratios because of increasing funding shortfalls and economic contraction, but federal dollars from the American Rescue Plan is likely to mitigate much of the expected GDP decline.
As a Percentage of State Spending
Another way of looking at the same issue is to analyze what share of public resources pension funds are consuming. Or what share they would be consuming if 100% of actuarially required contributions were paid each year.
A common metric across all states is “state own-source expenditures” (SOSE). This measures the amount of expenditures a state makes using tax revenue from within its own state, minus any federal dollars received. By comparing actual pension contributions within a state to its own-source spending, we get a sense of the scale of pension costs within that state. Similarly, comparing the actuarially required amount of employer contributions against SOSE provides a sense of the scale of pension costs within that state, should the state’s budget ever be required to take on all pension costs from local employers plus state agencies.
To be clear: this SOSE metric does not always include local tax revenue, and local governments sometimes are the employers making pension contributions. So this metric is not designed to show the actual percentage of the state budget going to pensions, but rather to show the scale of pension contributions relative to the size of a state.
Click Here to read the full State of Pensions 2021 report External Link