America's Hidden Education Funding Cuts
How Growing Teacher Pension Debt Stresses America’s K–12 Education Budgets
Rapidly growing teacher pension debt has caused retirement costs to triple as a share of state and local education budgets since 2001, leaving less money to support classrooms, teachers, and students. These are America's Hidden Education Funding Cuts.
Understanding America's Hidden Education Funding Cuts
Teacher pension costs have grown significantly faster than K-12 education spending over the past two decades, driven by teacher pension unfunded liabilities. These rising costs have necessitated larger contributions from states and local school districts' budgets to fund retirement benefits. As a result, teacher retirement costs have consumed an increasing share of total K-12 education funding, siphoning off money that could be spent on important resources and programs to improve educational outcomes for students and provide better supports for teachers.
This is a Hidden Education Funding Cut.
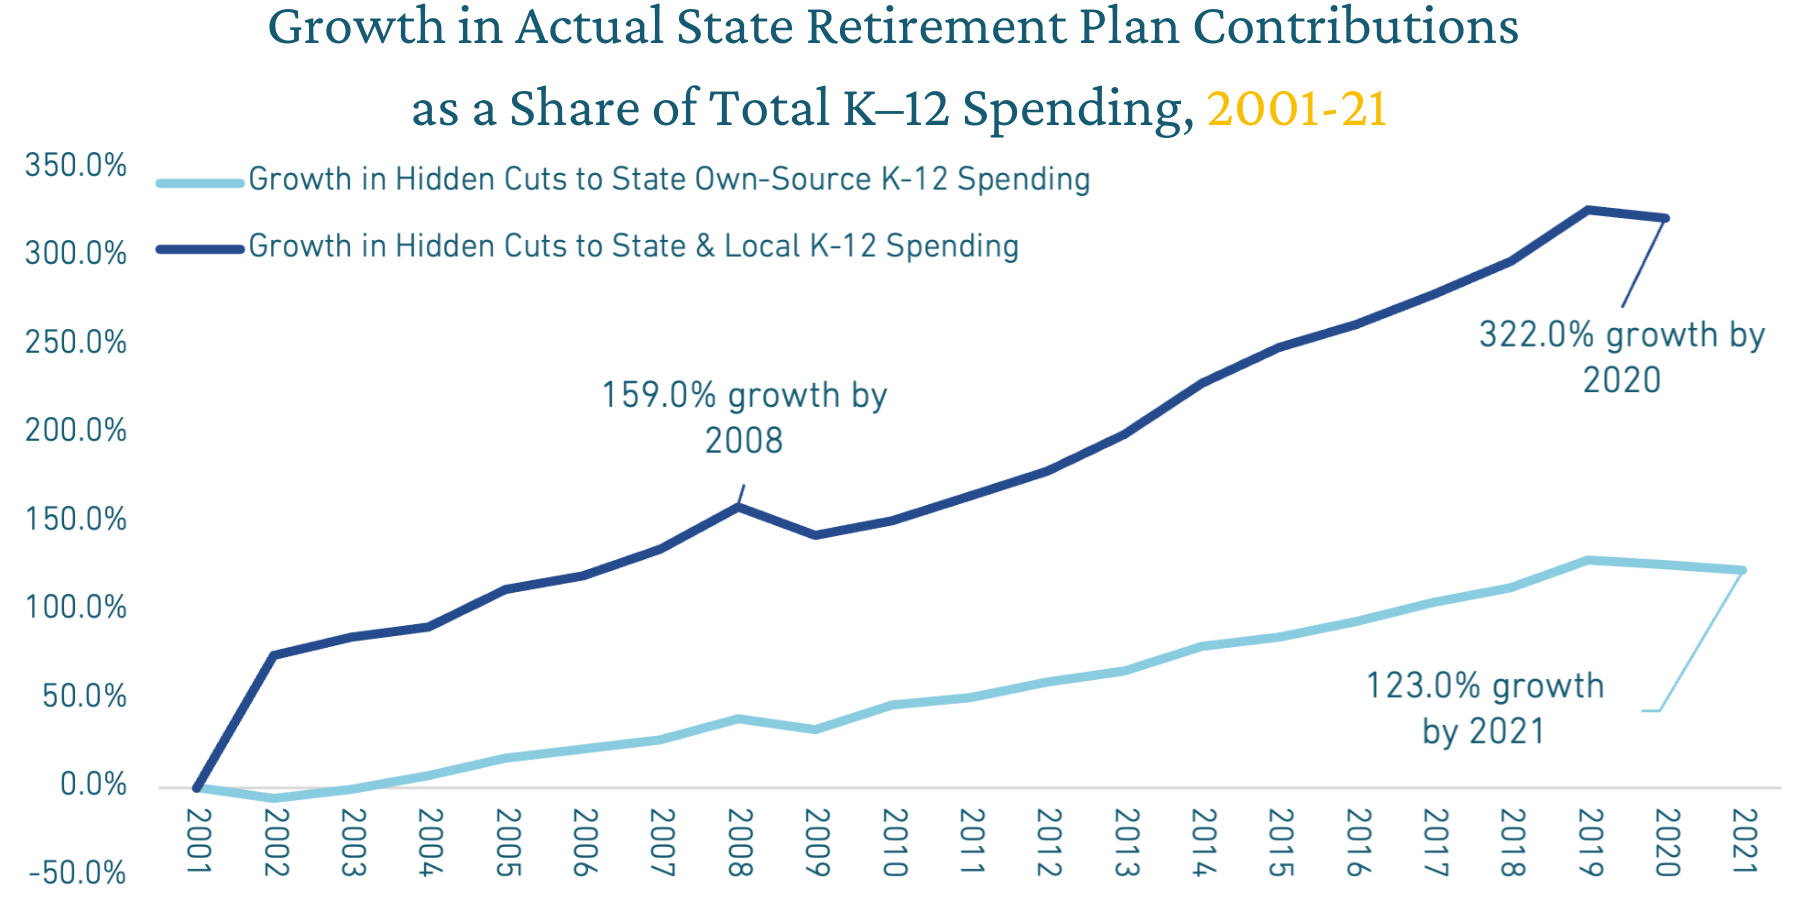
Since 2001, total teacher retirement costs as a share of state and local K–12 spending has increased 322%.
The chart below shows the growth of teacher retirement spending as a share of state and local spending in two ways:
- The light blue line shows the growth in share of state-only education spending going to teacher retirement costs since 2001. Because most states determine retirement spending at the state level, therefore state dollars are a reasonable way to assess hidden education funding cuts.
- The dark blue line shows the growth in share of state and local spending going to teacher retirement costs since 2001. The majority of funding for schools comes from the local level. From this perspective, looking at hidden funding cuts in the context of combined state and local spending provides a more complete understanding of the impact of these hidden education funding cuts.
Retirement benefits are an important part of deferred compensation for educators and spending on these benefits is important and necessary to ensure they remain available to future generations of educators.
That means what is important is the trendline — as in, the trend over time. What is the trend in retirement costs as a share of K–12 spending? Where was it before and where is it going? Right now, the trendline is going in the wrong direction for an overwhelming majority of states.
The primary reason for the growth in these hidden cuts is that retirement costs are growing at a much faster rate than K–12 spending. The main reason that retirement costs are rising is a growth in unfunded liabilities — colloquially known as pension debt.
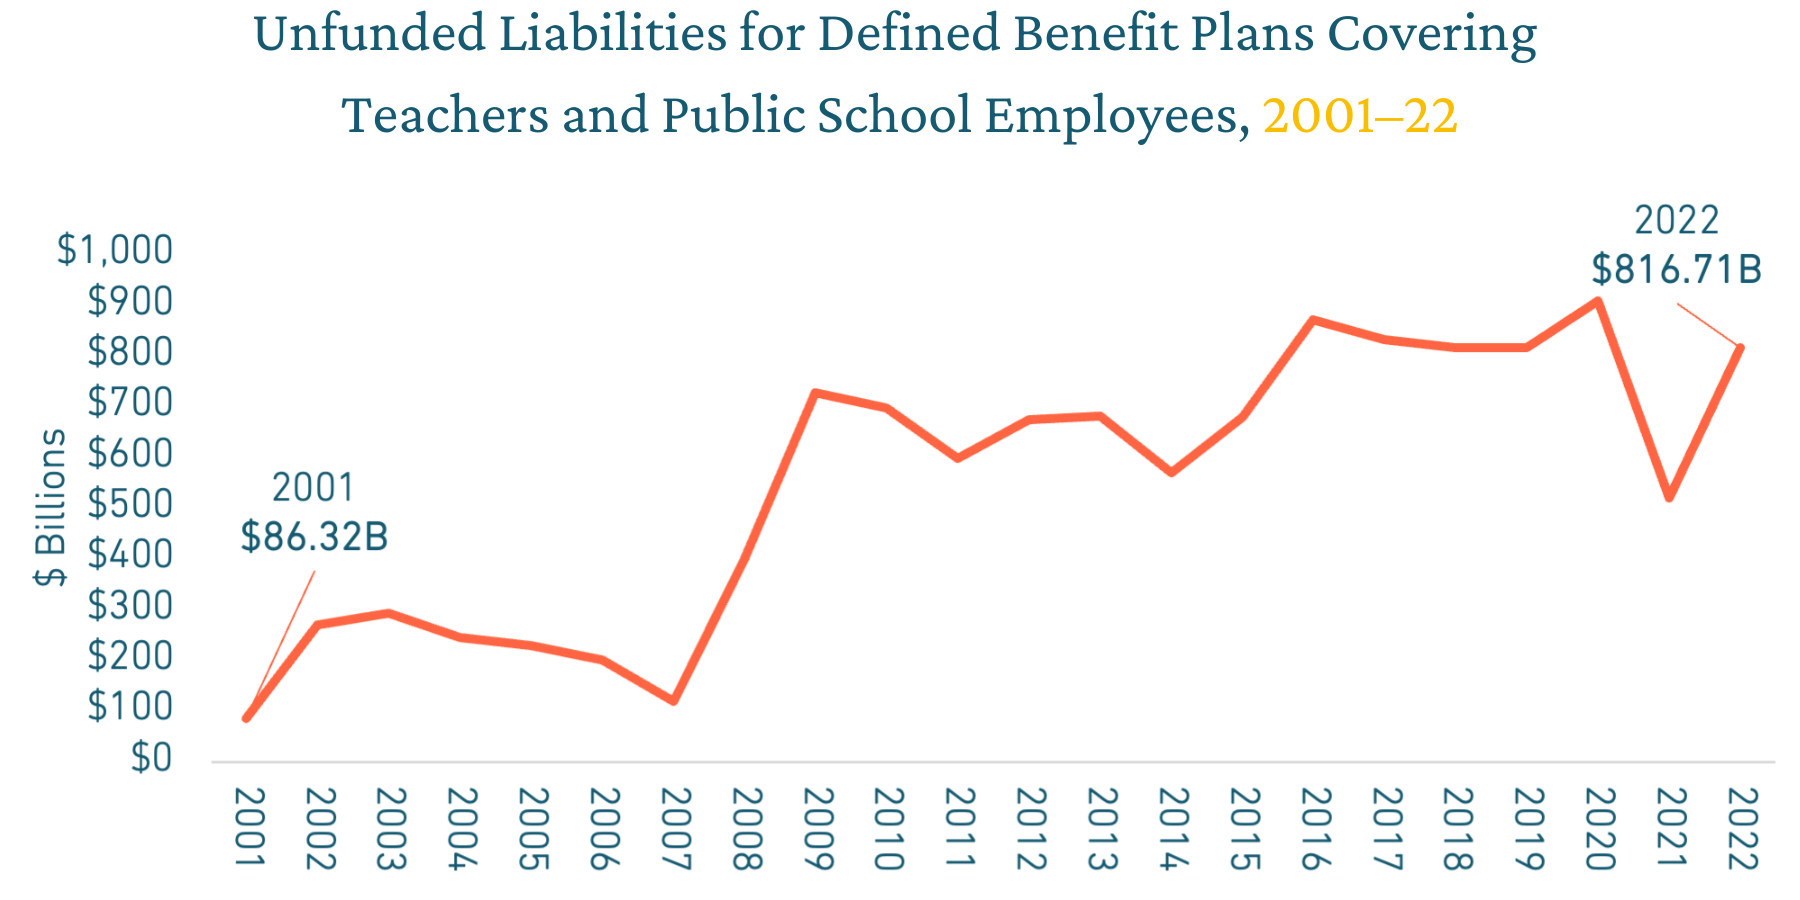
Between 2001 and 2022, teacher pension plans went from having effectively no pension debt to around $816 billion, shown in the figure below. This, in turn, has required an increase in contributions to pay down that pension debt. Formally these are called unfunded liability amortization payments, but it is easier to think of them as pension debt costs
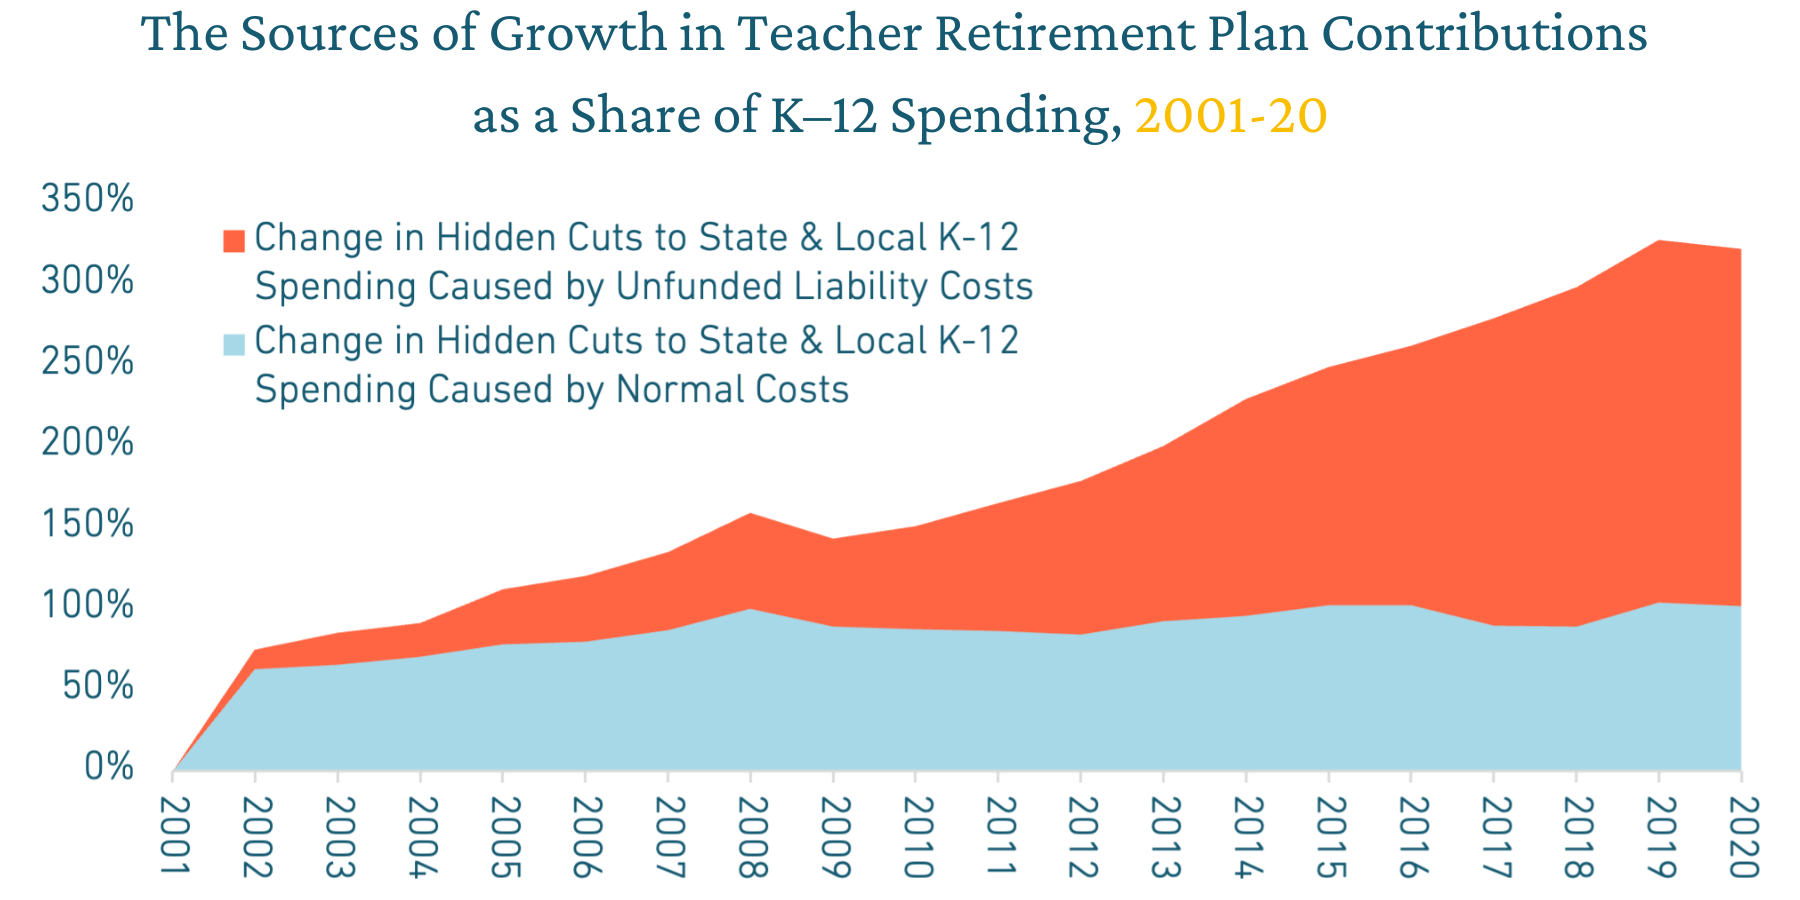
Normal costs refer to the amount of money needed to fund pensions for teachers today, in real-time. These costs have remained relatively stable over the last two decades. However, because many states have underfunded their teacher pension plans, pension debt costs have grown 422% in the same time period, shown in the figure below.
As of 2020, pension debt accounts for two-thirds of all teacher retirement spending.
There are generally three sources of revenue for school districts: federal dollars (largely prescribed for specific programs), state tax revenues, and local government revenues.The largest contributor of these categories is local government. Between the years 2002 and 2020, the average national share of K–12 resources provided by local governments was 67.6%
State government funding for K–12 education has the most flexibility, given the legislature’s budgetary authority. And retirement systems are primarily managed at a state level. This makes state-only K–12 spending the best source of measurement against retirement costs. But some states push retirement costs to school districts, so assessing the effect of retirement costs on combined state and local K–12 spending provides a wider view.
When measuring education spending as both state and local K–12 expenditures, we see lower headline hidden cut figures (because the denominator is changing), but a faster growing trendline.
Teacher retirement costs as a share of state and local funding for K–12 education more than tripled between 2001 and 2020. Specifically, in 2001, state and local K–12 funding going to retirement benefits was 1.31%, but by 2020, that had increased to 5.53%.
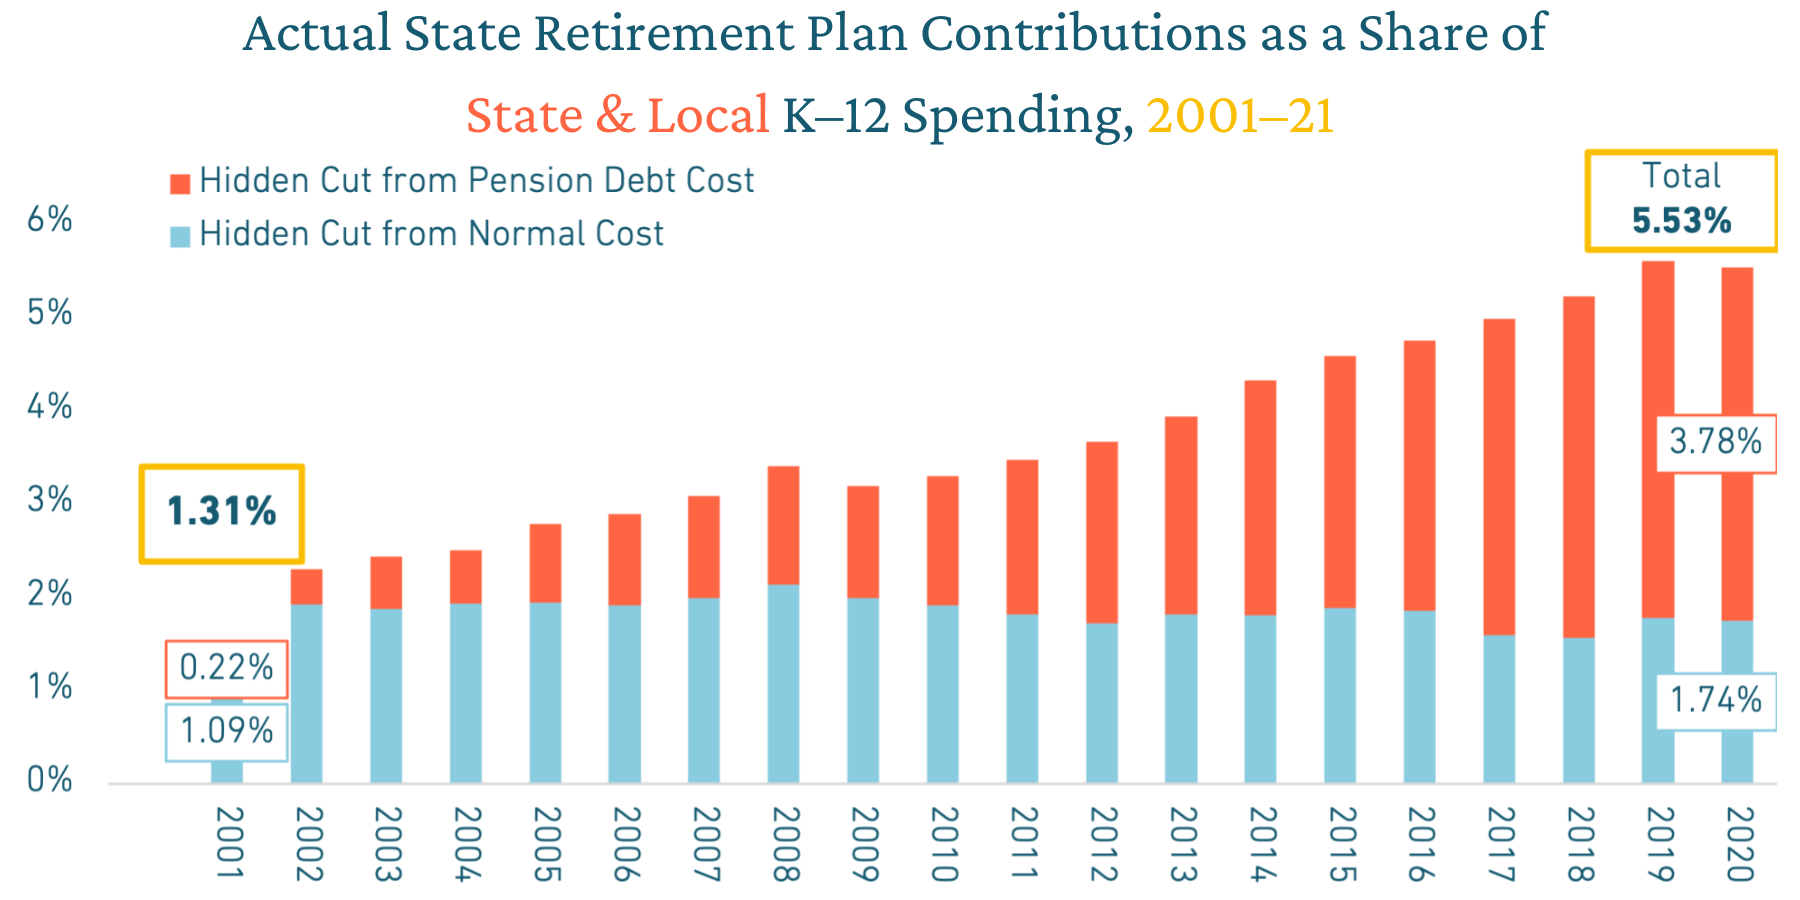
In the context of $1.1 trillion in state and local K–12 spending, that 5.53% cut represents tens of billions in resources that could have otherwise been allocated to improving education equity, compensating educators appropriately, hiring support staff, or financing IEPs for disabled students. But even in that context, the problem is greater than a headline figure in 2020, the problem is the trendline.
Teacher retirement costs have more than doubled as a share of state funding for K–12 education between 2001 and 2021. Specifically, between 2001 and 2021 the share of state own-source K–12 funding going to retirement benefits increased from 7.03% in 2001 to 15.65%.
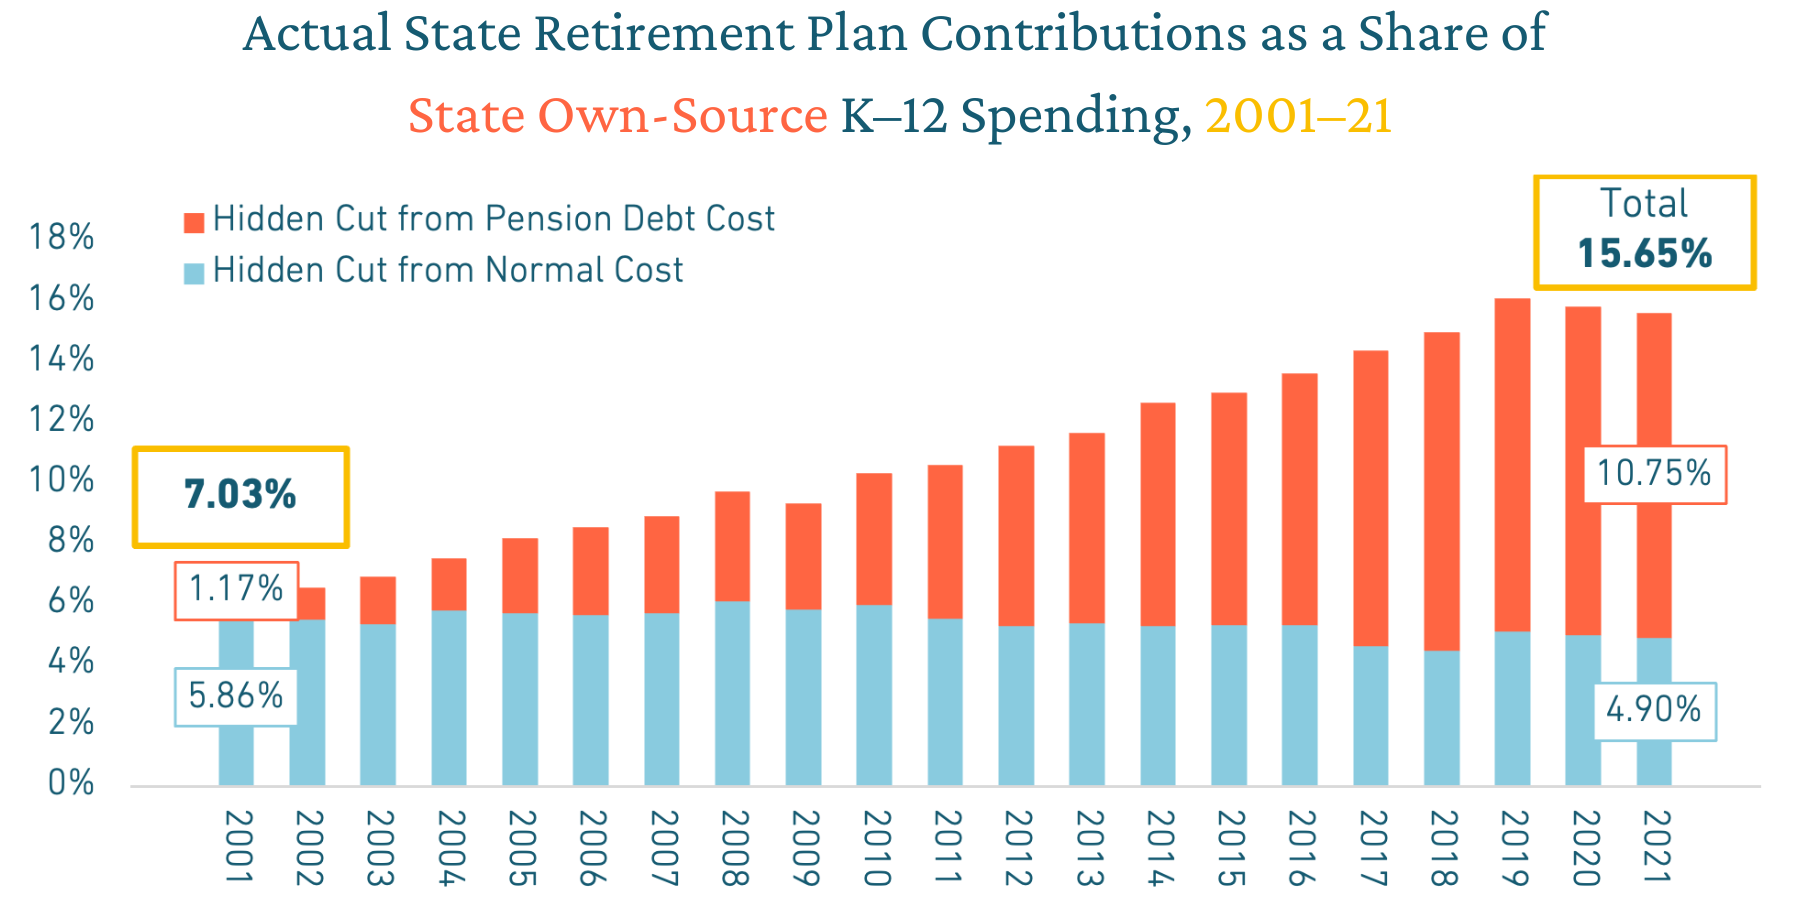
While this hidden cut could have been mitigated by state’s matching any growth in retirement costs with additional K–12 spending, it is clear from this chart that the primary source of hidden cuts is from pension debt costs. On average in 2021, 10.75% of state own-source K–12 spending was put toward pension debt, while just 4.9% was put toward normal retirement costs.
At a national level, hidden cuts to K–12 spending are growing at a notably fast rate. No matter how you slice the data, over the past two decades, retirement costs have been consuming between two to three times the K–12 education resources that they used to. But, what does that mean for teachers?
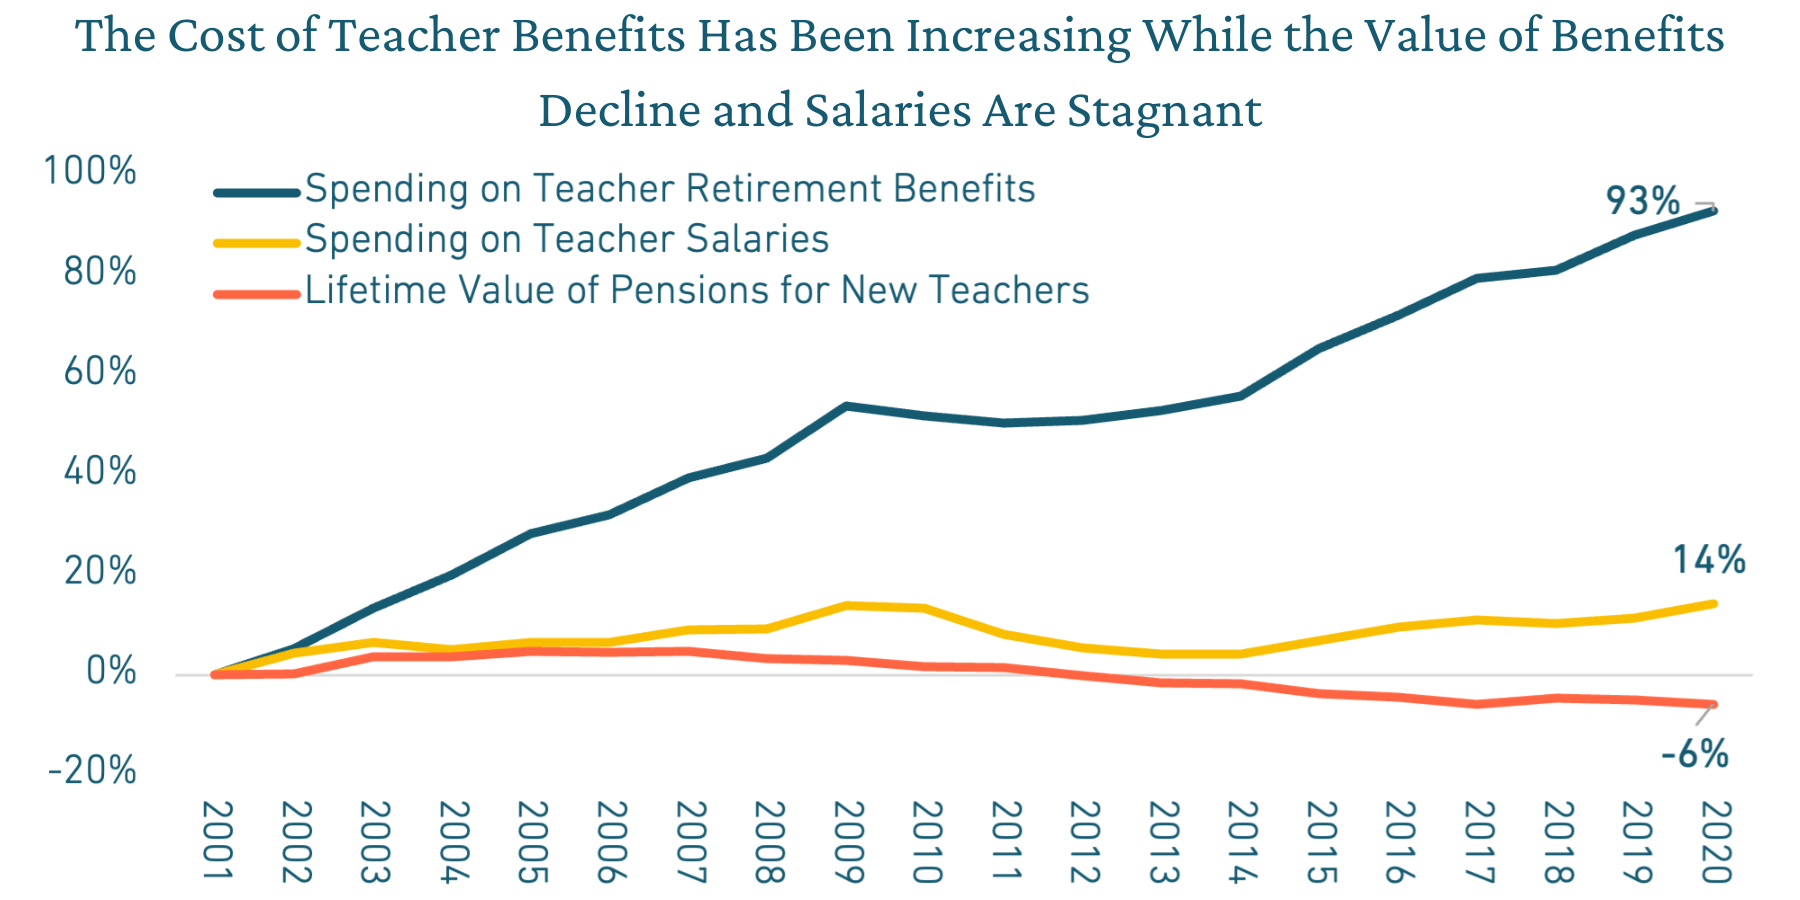
The value of teacher retirement benefits has declined by 6% since 2002, but the cost of providing those benefits have increased by 93%. In the same time period, teacher salaries remained relatively stagnant by comparison, increasing by 14% in two decades.
Because of the variance of pension funding challenges and mechanisms, there is no one-size-fits-all solution to improving a state’s hidden education funding cuts.
However, there are a few key principles that can guide policy change across the country, and policymakers and stakeholders in each state can use these to guide improvements to their status quo:
1. Improve Transparency
2. Use the General Fund for Pension Debt Instead of Education Dollars
3. Ensure Education Funding Grows at Least at the Rate of Retirement Costs
4. Improve Pension Funding Policies
Download the report to learn more about solutions to address hidden education funding cuts.
Hidden Education Funding Cuts By State
There are two different ways of thinking about the change in hidden education funding cuts over time:
Percentage growth, typically measured over the last two decades or since 2009
or
Absolute change in the size of hidden cuts
Either approach paints the same trendline picture — either positive or negative depending on the state. But the scale of change can be different, and each approach can make certain states look better or worse compared to one another.
The heatmap below shows the percentage change in state and local hidden education funding cuts over the past two decades:
Hover your mouse over a state to see more information.
The heatmap below shows the absolute change in state and local hidden education funding cuts over the past two decades:


