Report
State of Pensions 2024
Public pension funds will see a funded ratio improvement in 2024, but unfunded liabilities remain paralyzed above $1 trillion.
What is the State of Pensions in 2024?
State retirement systems in America are still Fragile.
This an annual report on the financial status of state and local public pension systems, put into a historic context. State and local governments face a wide range of challenges in general – and some of the largest are growing and unpredictable pension costs. The scale and effects of these challenges are best understood by considering the multi-decade financial trends and funding policy decisions that have brought public sector retirement systems to this moment.
State and local governments paid a record amount into their public retirement systems last year — 31.3% of payroll on average, or $180.7 billion. In one way this reflects a positive trend, as more money needs to get contributed to public plans since pension debt won’t be eliminated through investment returns on their own. However, it is a problem that nearly two decades on from the Global Financial Crisis this level of money has not been enough: America’s pension plans still have $1.34 trillion in unfunded liabilities as of 2024, with a funded ratio of 80.2%.
Looking forward, the long-term outlook for pension funds in 2024 and beyond will likely be shaped by rising contribution rates stemming from pension debt paralysis, increasing exposure to valuation risk, and ongoing financial market volatility.
So what are the trends in public pension funding in 2024?
- State and local plans are reporting an investment return average of 10.3%. Public equity and fixed income performance have been strong, helping plans to beat their 6.9% average assumed rate of return—which is the main target to hit each year in order to prevent further growth of unfunded liabilities.
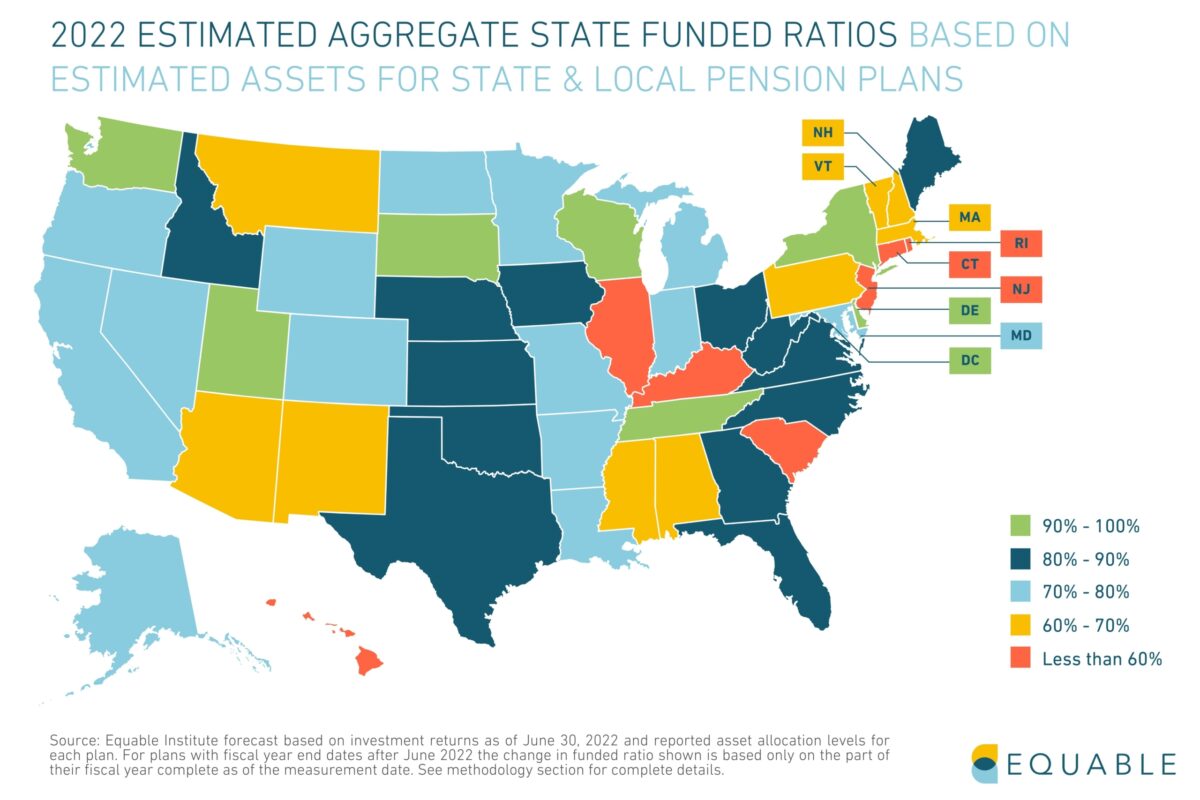
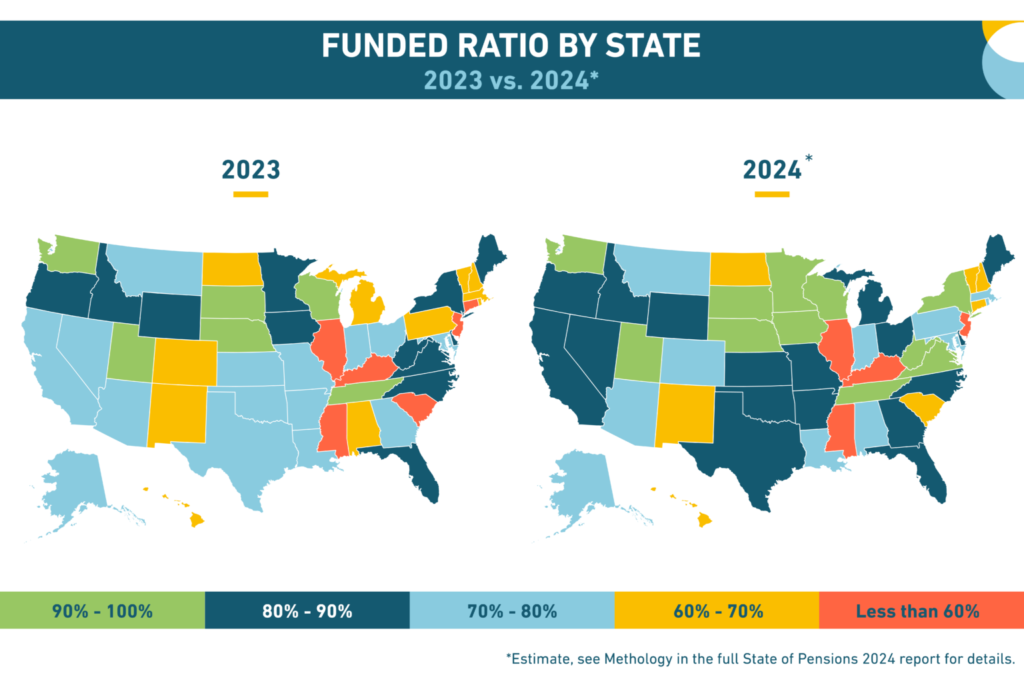
- Funded status in 2024 has shown moderate improvement, increasing to 80.2%, up from 75.5% in 2023. We estimate unfunded liabilities will decline to $1.34 trillion, down from $1.64 trillion in 2023. This is a welcome improvement, but it will require additional years of similar performance to break public plans out of their pension debt paralysis.
Positive Trends
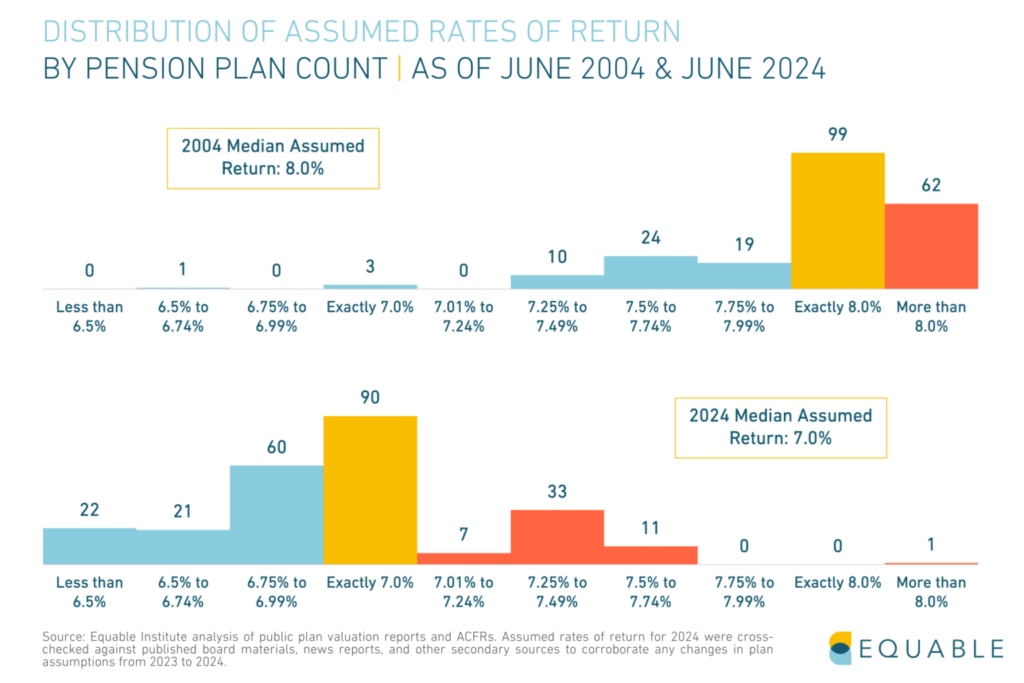
- Funding Policies: There were 214 major public pension plans with assumed rates of return higher than 7% in 2004 — that has fallen to just 52 plans today, also down from 60 plans last year. There are now 103 state and local plans that assume investment returns below 7%, as of announcements through June 2024. Overall, this downward trend in investment assumptions is translating into more accurate accounting of future liabilities and better contribution in-flows.
- Paying the Bills: While a few states are still not paying 100% of required contributions, on net the country paid 100% in both 2022 and 2023 (due to supplemental payments in some states).
- Funded Ratio: There was an improvement in the funded ratio between 2023 and 2024, going up from 75.5% in 2023 to an estimated 80.5% in 2024. This improvement is the second best year over year increase in the last decade.
- Investment Returns: Preliminary 2023 investment returns are 10.3% on average for state and local plans, which is above the average 6.9% assumed rate of return. All asset classes had strong performance over the last year, in particular for January-September 2024.
Negative Trends
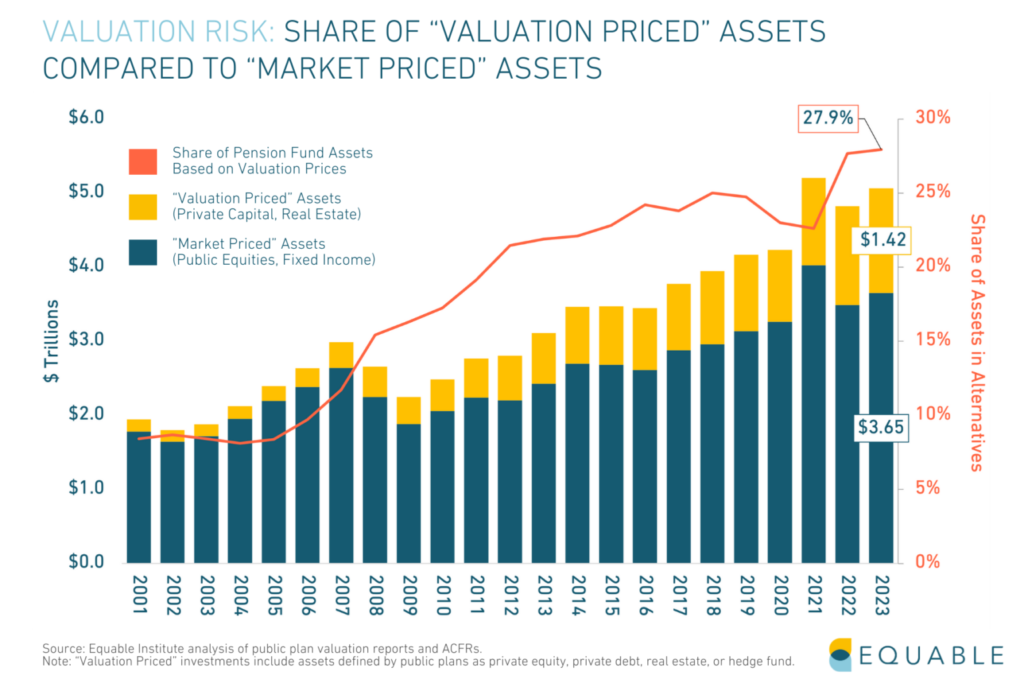
- Valuation Risk: Pension fund allocations to private capital increased again to a historic high of 13.7% — a reported value of $694 billion as of 2023. This has driven up the share of pension fund investments exposed to valuation risk to 27.9%. Investments in all alternatives continue to be more than one-third (33.8%) of pension fund assets.
- Contribution Rates: Negative trends from the past decade continue to persist for both member and government employer contribution rates. In fact, employer contributions have now exceeded 30% of payroll on average for the third year in a row.
- Inflation Protection of Benefits: Cost-of-living adjustment policies are insufficient to ensure public pension benefits keep pace with inflation. The average COLA paid in 2023 was 2.02%, below actual national inflation at 3%. Plus, 31.3% of benefit tiers offered no inflation adjustment at all.
- Cash Flows: Negative cash flows keep expanding even as contribution rates from members and employers keep growing.
Examining Pension Debt: Causes of Unfunded Liabilities
Today’s pension debt is not primarily caused by increased lifespans, enhanced benefits, or states failing to pay 100% of required contributions. The three primary factors explain unfunded liabilities as of 2022: changes to actuarial assumptions, underperforming investment returns, and interest on the debt.
Managing pension plans requires a wide range of assumptions about future events: investment returns, mortality rates, workforce turnover, salary growth, inflation, government contributions, and more. There are lots of places where actual experience may not line up with actuarial expectations — leading to unfunded liabilities or improved funding.
Pension funds compare actuarial and assumed experience every year, along with other factors that can change the value of liabilities.
We can use the data to look at the internal structure of public pension plans and measure exactly which categories are causing the country’s collective unfunded liabilities.
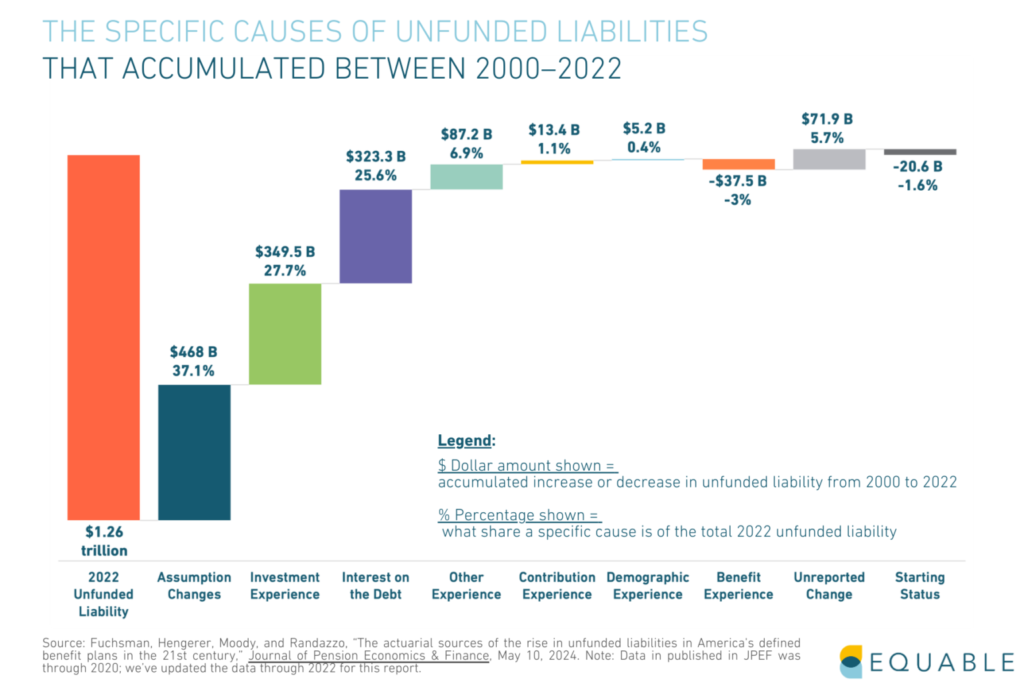
The red column in the chart below shows the total unfunded liabilities from 2002-2022. Each bar to its right shows much individual factors and assumptions contributed to the accumulation of these unfunded liabilities.
The largest contributor to the $1.2 trillion in unfunded liabilities as of 2022 was necessary improvements to actuarial assumptions (37% of the total accumulated growth). The next largest factors were underperforming investment returns (28%) and interest growing faster than contributions paid (26%).
The below chart looks at how these factors have contributed to the growth of pension debt overtime.
Underperforming investment experience was the largest contributor to unfunded liabilities, until historically strong 2021 investment returns.
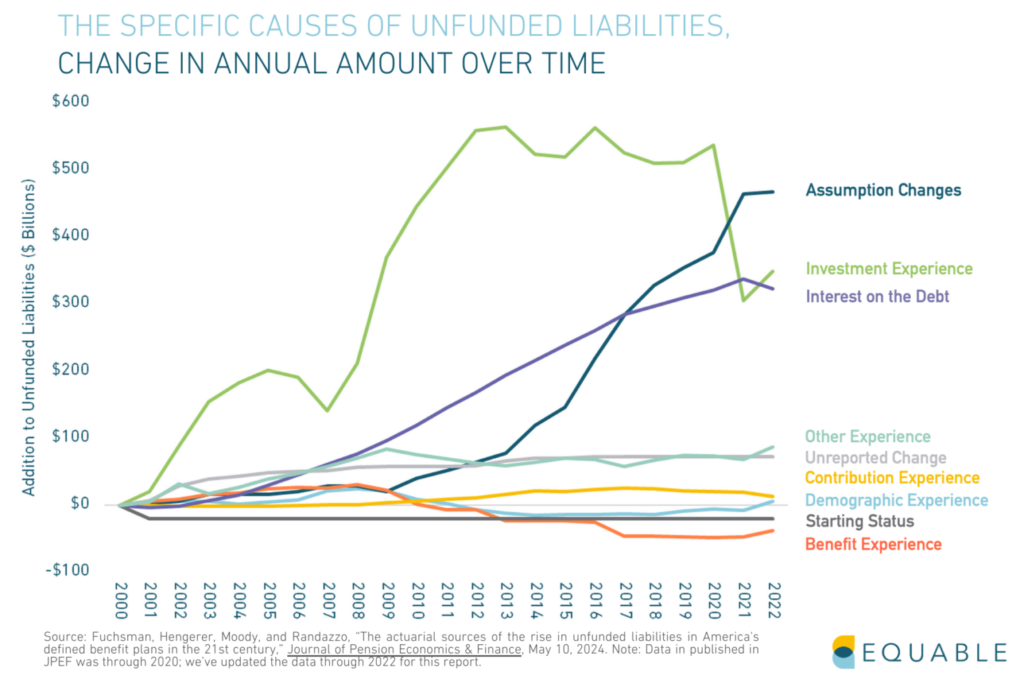
Interest on pension debt has been steadily increasing as a cause of unfunded liabilities for nearly two decades.
Benefit experience has gone from causing unfunded liabilities to reducing pension debt.
Trend to Watch: Valuation Risk
There is a sharply increasing share of pension fund investments with values based on valuation-methods instead of market prices, which means an increasing share of pension portfolios are exposed to the risk of being overpriced.
What is Valuation Risk?
“Valuation Risk” is the risk to pension funds that the value of their assets as reported to them is inaccurate (e.g., understating or overstating the actual value) because the asset pricing method used is based on valuation models, as opposed to market-based prices.
If asset values are overstated today, then that means reported funding levels are overstated. This in turn can lead to lower than appropriate contribution rates, which will mean larger unfunded liabilities in the future than if assets were more accurately priced.
Overstated pension asset values can also lead to other policy decisions that could influence future funded status — such as raising the value of benefits or having lower political priority for supplemental funding to pay down unfunded liabilities faster than planned.
This is in contrast to “opportunity risk” (the risk that a specific use of capital doesn’t justify the risk-adjusted returns relative to other opportunities), or “asset risk” (the risk of losing money on an investment), or “management risk” (the risk that trustees will inefficiently allocate capital).
Why is this happening?
There is no way that pension funds can meet their investment targets using simple stock and bond passive portfolios. The probability of earning just a 6% return over the next decade is less than 50%. This is particularly notable since public retirement systems have done a better job lowering their assumed returns over the last two decades but they are still unrealistically high.
There were 214 major public pension plans with assumed rates of return higher than 7% in 2004. That has fallen to just 52 plans today, also down from 60 plans last year. The average assumed return is 6.88%, though the rate of decline has leveled off since 2020.
Still, 41 plans have assumed returns 6.5% or less (up from 39 last year). These plans are leading their peers in adopting more realistic future expectations.
Therefore, the choices are to either (a) increase contributions into pension funds beyond their currently historically high levels, or (b) roll the dice and take on more risk.
In total, $1.42 trillion in pension fund assets are exposed to valuation risk as of the end of 2023.
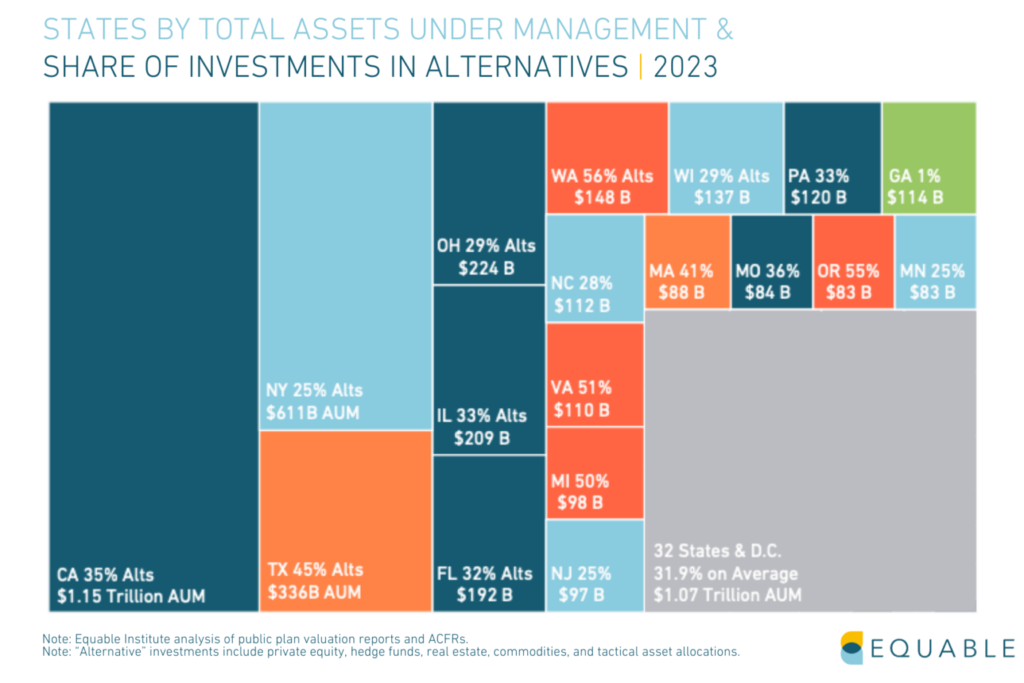
Below is a visualization of the states with the largest investments in alternatives by dollar value.
Why is this a problem?
- There is a sharply increasing share of pension fund investments with values based on valuation-methods instead of market prices, which means an increasing share of pension portfolios are exposed to the risk of being overpriced.
- The significant lack of transparency in how pension funds invest in valuation-priced asset classes like private equity and real estate exacerbates concerns about valuation risk.
- The growing rate of volatility in investment returns also adds to concerns about the scale of pension fund assets that are exposed to valuation risk.
- There is a sharply increasing share of pension fund investments with values based on valuation-methods instead of market prices, which means an increasing share of pension portfolios are exposed to the risk of being overpriced.
- Overstated portfolio values for asset classes like private capital and real estate can lead to significant unfunded liability problems in the future.
Trend to Watch: The State of Inflation Protection
One of the downstream effects of pension debt paralysis is a lack of inflation protection of worker’s retirement benefits. As pension debt has accrued and stagnated, many states have changed their policies to reduce or eliminate COLAs in search of cost savings. This has resulted in COLA values that are less than the rate of inflation, and by extension, the erosion of the spending power of retirees retirement checks.
The map below shows the range of COLA policies by state, as of 2024:
The average national rate of inflation (CPI) over the past two years was 9.1% in 2022 and 3.0% in 2023. The average actual COLAs paid in 2022 and 2023 nationally were 1.83% and 2.02%, respectively.
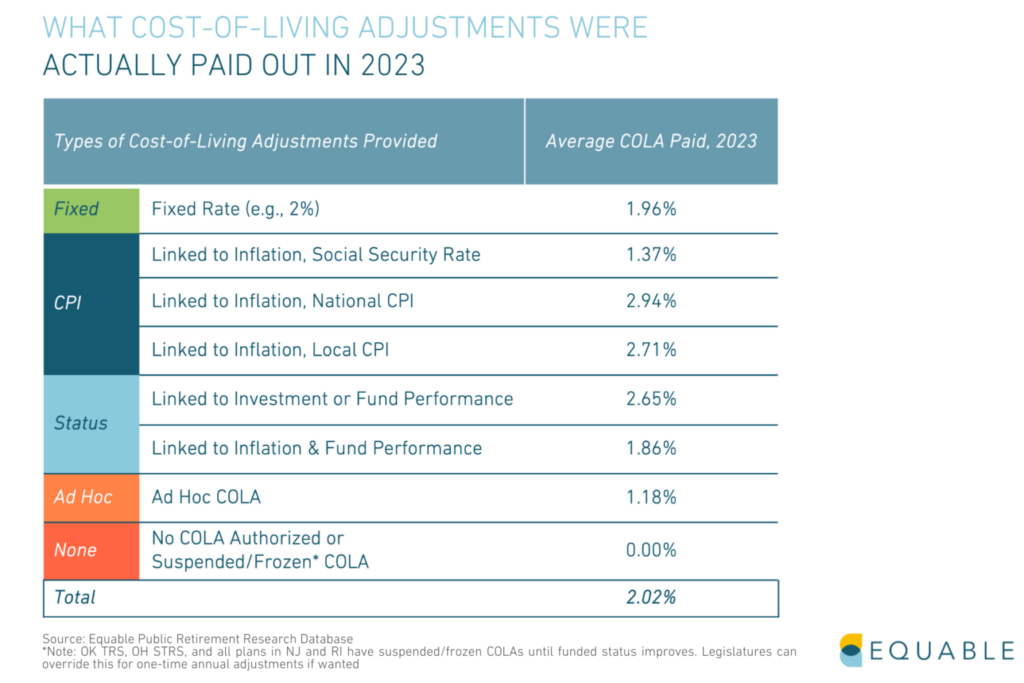
The chart below shows the average COLA by policy design for 2023:
Key COLA Trends
- States use a wide range of COLA policies to offer protection against inflation, although many tiers of benefits lack inflation projection of benefits. States have shifted away from offering benefit tiers with fixed COLA rates and increasingly favor COLAs linked to local CPI. An emerging concept has been to link COLAs to both inflation and fund performance such that lower COLAs are paid out when funded ratios are below certain thresholds.
- States with more than one statewide retirement system often do not have consistent COLA rules across all classes of benefits.
- Public pension plans that offer cost-of-living adjustments as protection against inflation use a range of polices.
How COLA Policy Impacts Pension Benefit Values
- No matter the provision, the typical COLA does not keep up with inflation when inflation is high. Generally, COLAs are designed to preserve the purchasing power of benefits when inflation is less than 3%.
- New benefit tiers often lower valued COLAs due to a change in provisions from the legacy plan, such as a lower maximum rate, or no longer offering a compounding COLA.
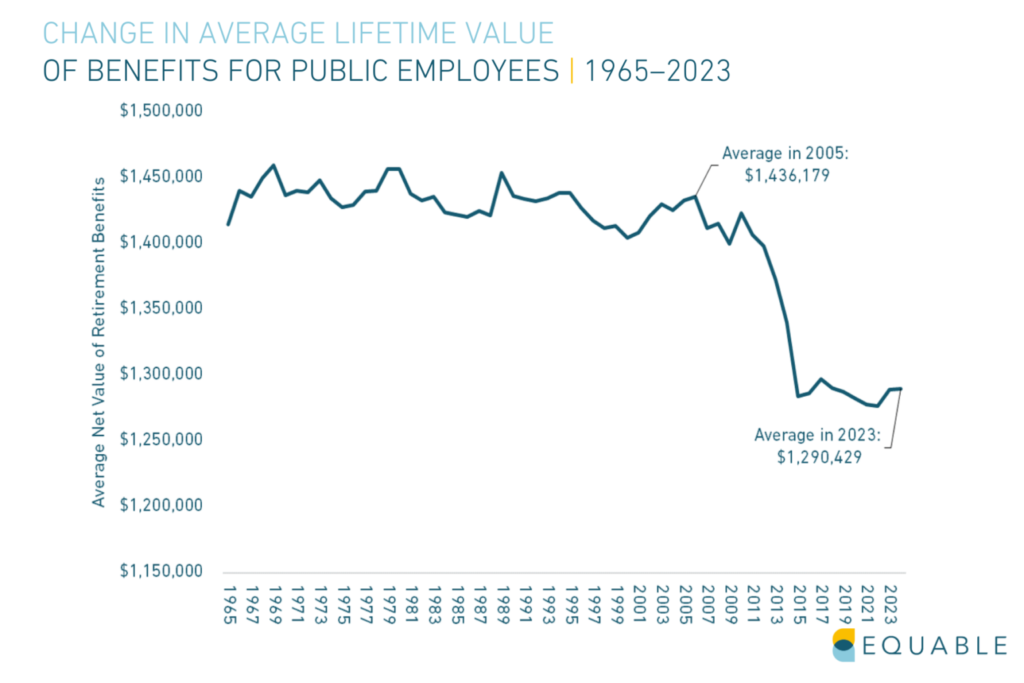
- Lower valued COLAs have been a major contributor to the reduction in the value of public employee pension benefits generally, as shown in the chart below.
National Trends
Unfunded liabilities for state and local pension plans have remained paralyzed above $1 trillion since the 2008 Financial Crisis.
The improvement in aggregate funded ratio in from 2023 to 2024 was the second best year over year increase in the last decade.
The 10-year average investment return has fallen to meet the assumed rate of return, indicating a tempered outlook for long-term investment gains.
Government employer contributions have surpassed 30% of payroll for the third year in a row.
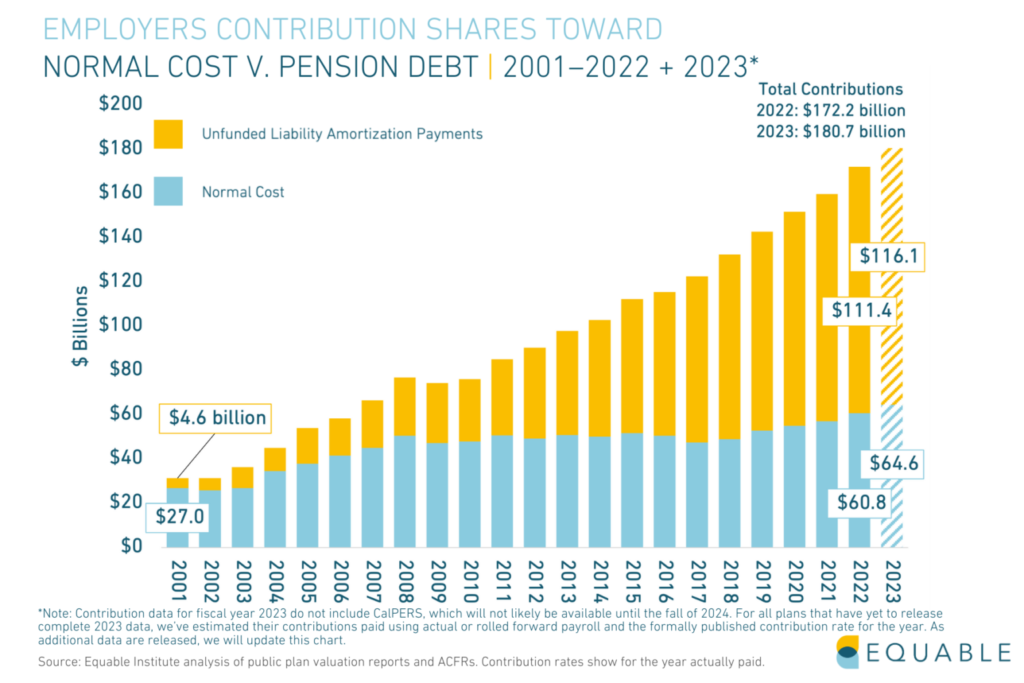
Employer contributions have steadily increased over the past two decades, mostly because of increased unfunded liability amortization payments.
Normal cost payments, in dollars, are up 139% between 2001 and 2023. However, unfunded liability payments have risen 2,450% during the same period.
State and local employee contributions to their own retirement plans have continued to steadily increase.
Public pension asset allocations have continued to shift away from transparent public equities and relatively safe fixed income investments into riskier categories as trustees search for stronger investment returns.
Negative net cash flows from contributions and benefit payments have steadily increased over the past two decades, reflecting more “mature” pension plans.
Looking to the Future
Looking forward, there are three primary indicators to watch.
- Pension debt paralysis has caused average employer contributions to increase from 3% to 31.3% of payroll between 2008 and 2024, all while:
- Unfunded liabilities have risen to levels persistently above $1 trillion.
- Funded ratios have not rebounded to pre-Global Financial Crisis levels.
- The higher contributions paid are not even enough to prevent interest from continuing to accrue on unfunded liabilities — which is the fastest growing contributor to pension debt for the country as a whole.
- Meanwhile, there is a less than a 50% chance, on average, that a U.S. public pension plan can earn a 6.9% return over the next 10 years, which is the average rate of return those plans are expecting to earn.
- In addition, necessary changes to actuarial assumptions and expected demographic turnover patterns are likely to continue to put downward pressure on public pension plan funded ratios.
This collectively suggests that contribution rates will continue growing in the coming years without meaningfully reducing unfunded liabilities—unless state leaders appropriately respond with improved accounting and adequate near-term contribution increases that will gradually decline over time.
State of Pensions 2024
Download the full State of Pensions 2024 report and fact sheets to dive deeper into the trends affecting public pensions.
Additional Resources
State of Pensions 2024 Downloadable Data
Interested in exploring our full data set? Download the raw data from the third edition of State of Pensions.