America's Hidden Education Funding Cuts

How Growing Teacher Pension Debt Stresses America’s K–12 Education Budgets

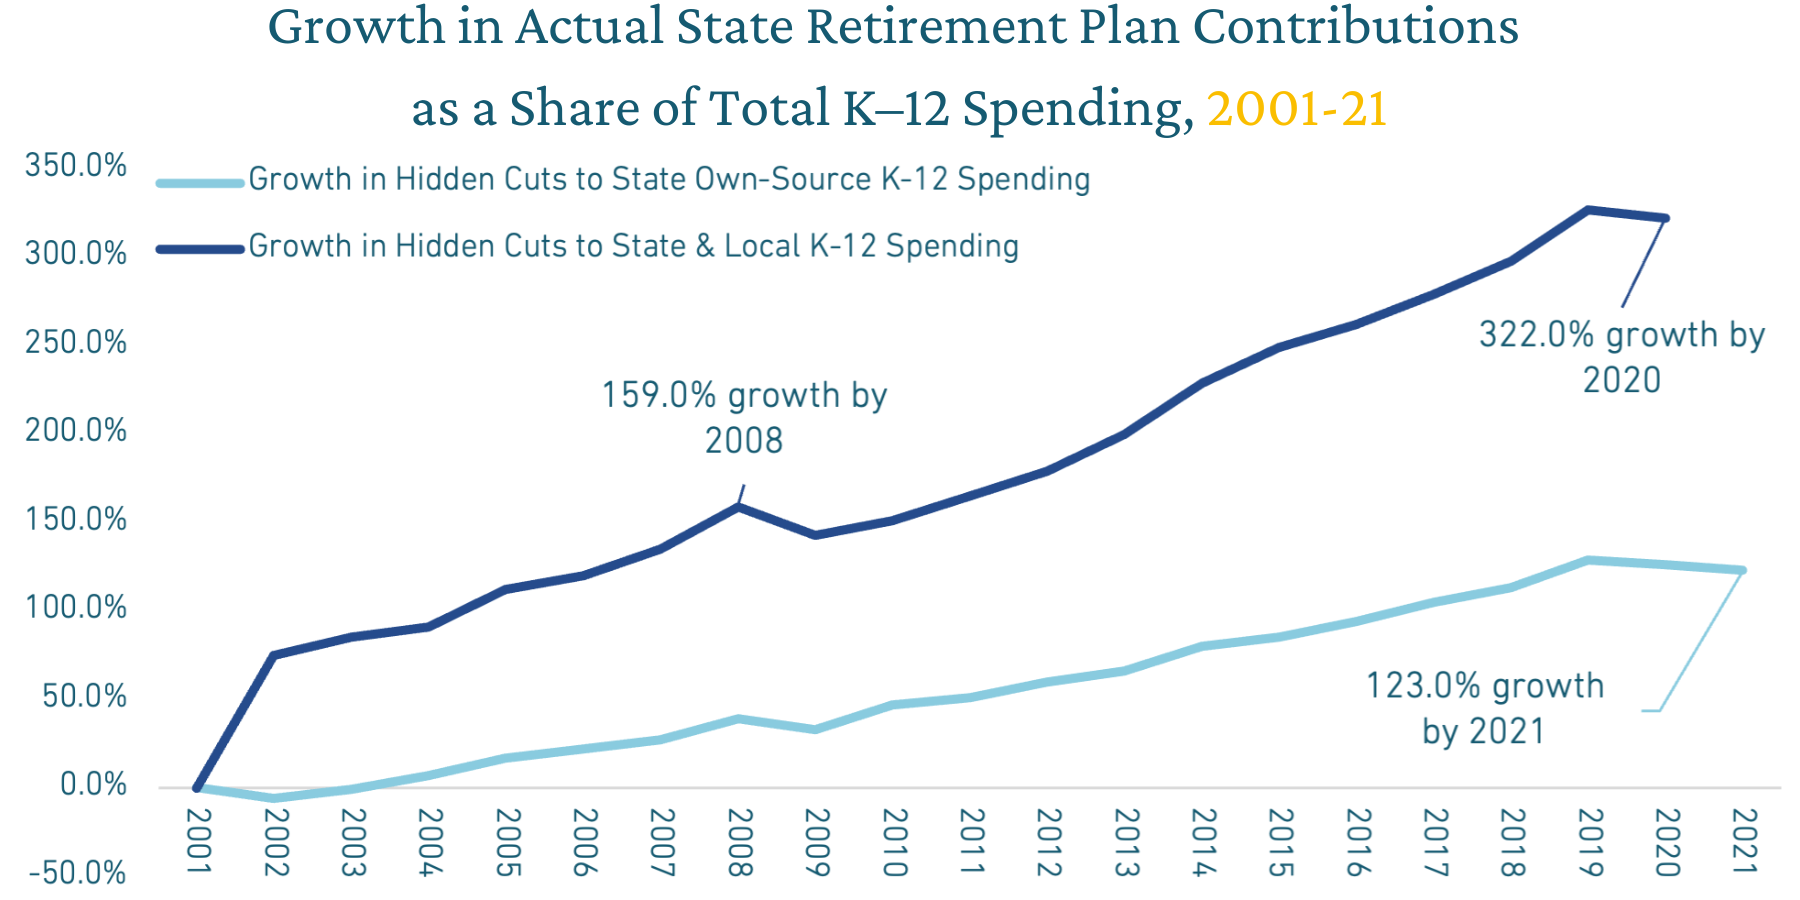
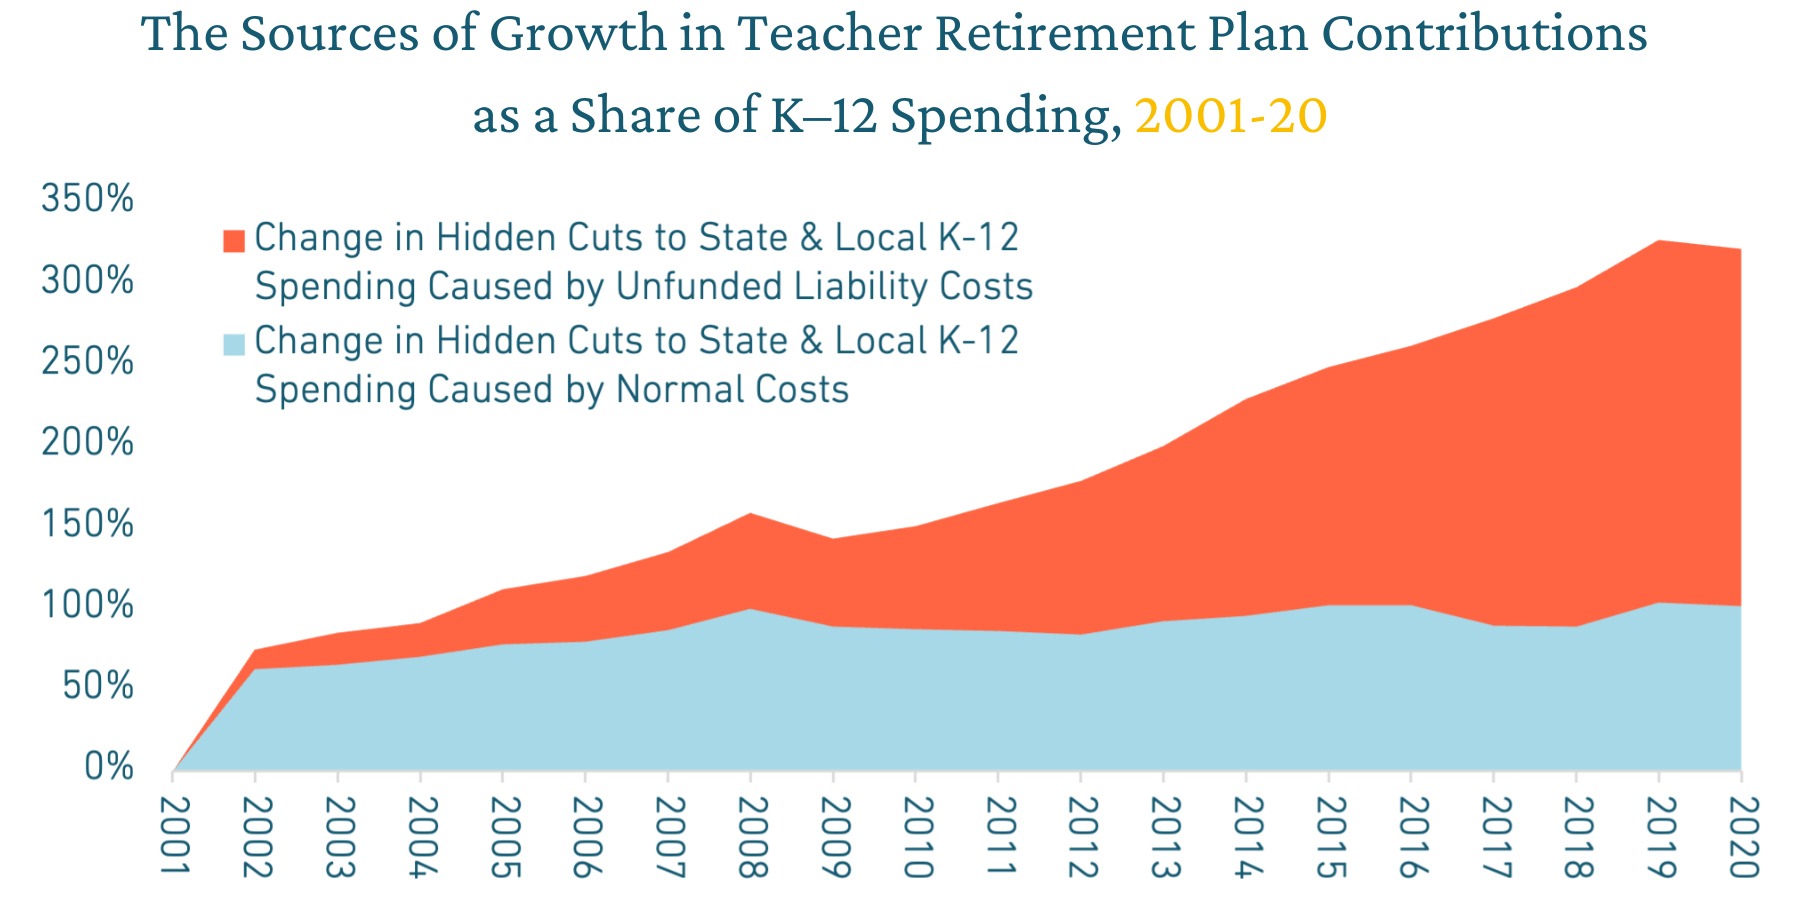
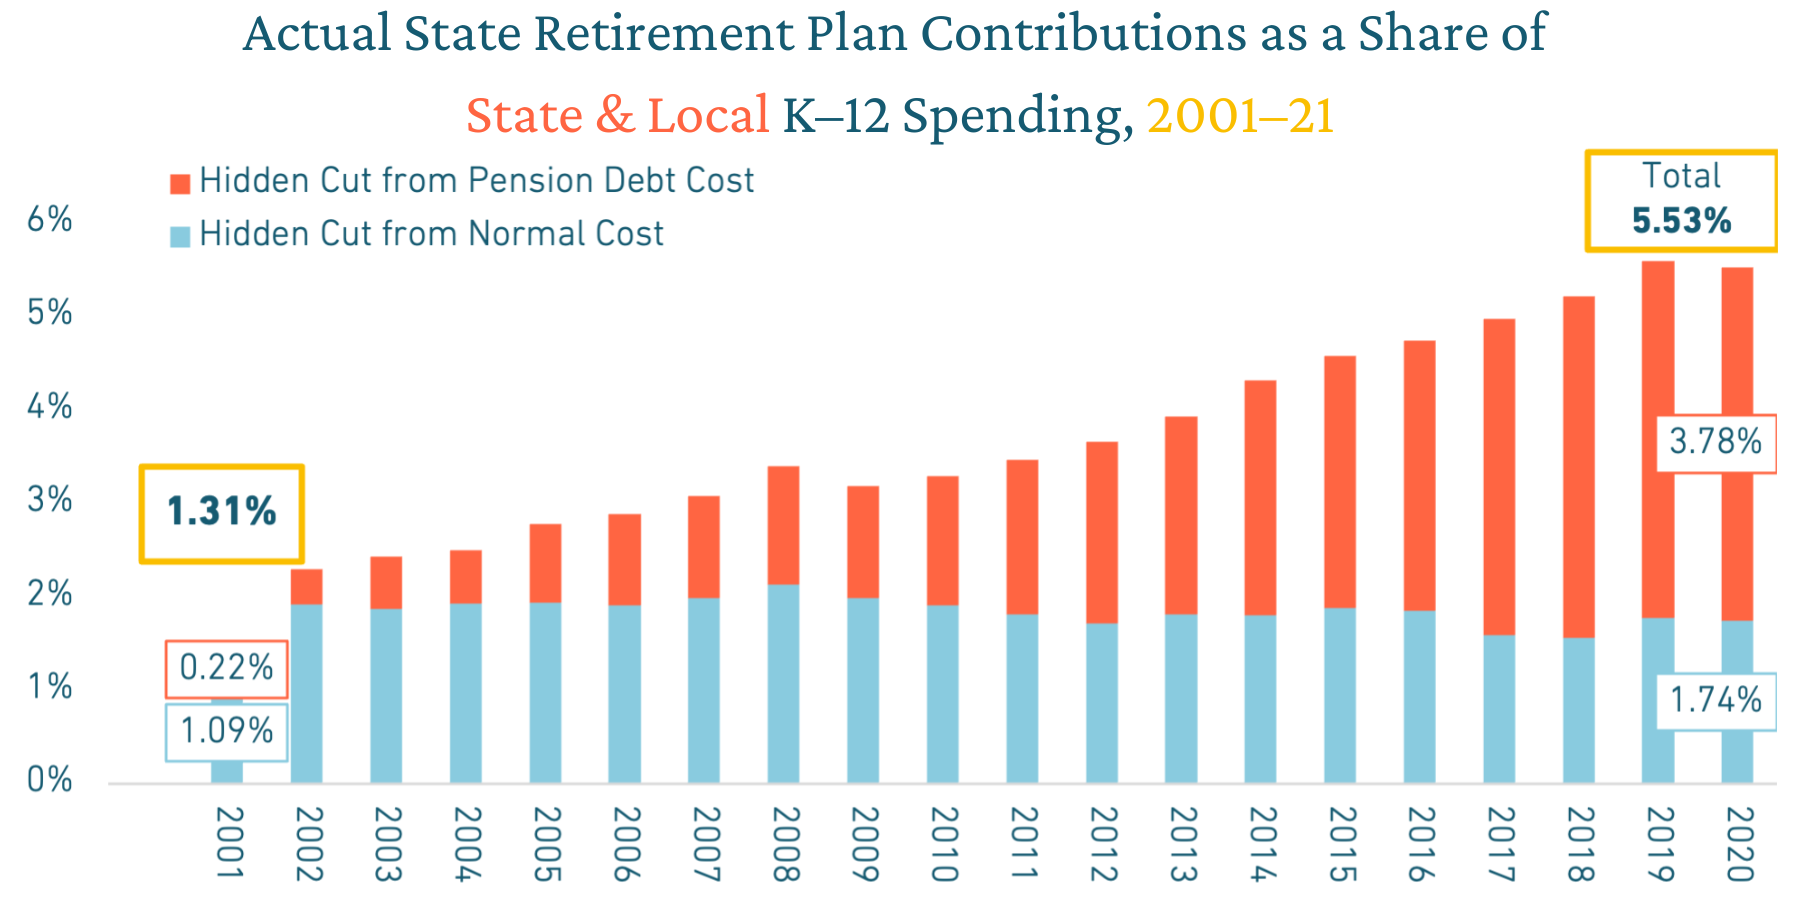
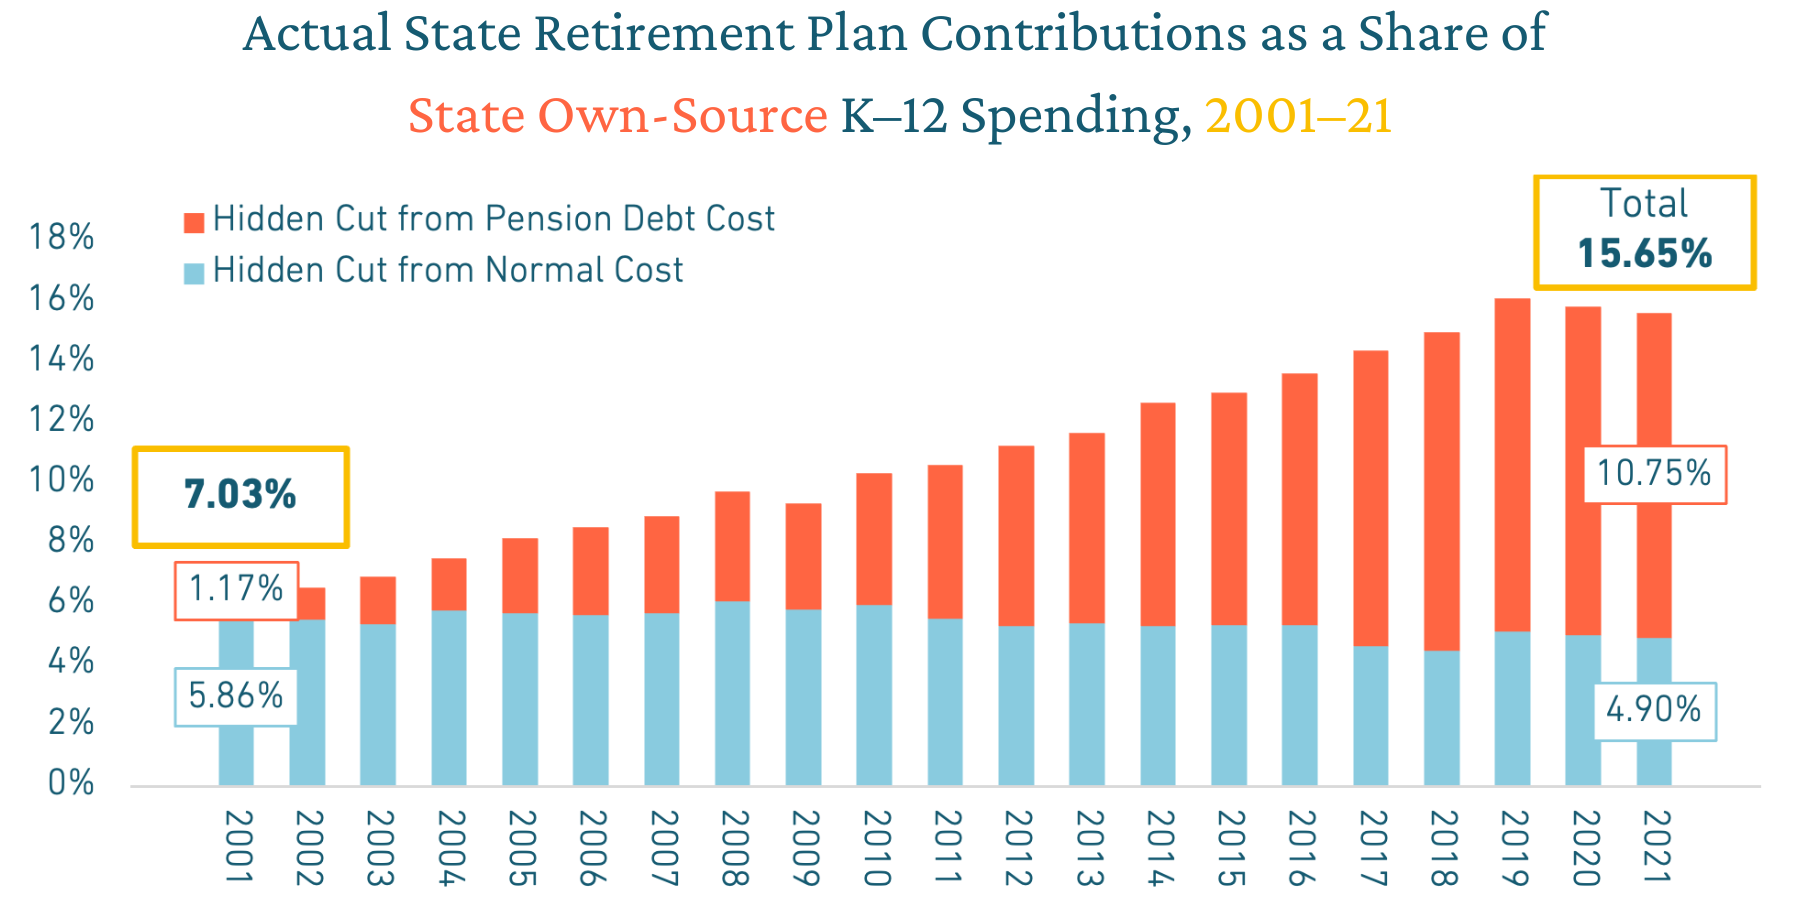
Rapidly growing teacher pension debt has caused retirement costs to triple as a share of state and local education budgets since 2001, leaving less money to support classrooms, teachers, and students. These are America's Hidden Education Funding Cuts.

Understanding America's Hidden Education Funding Cuts

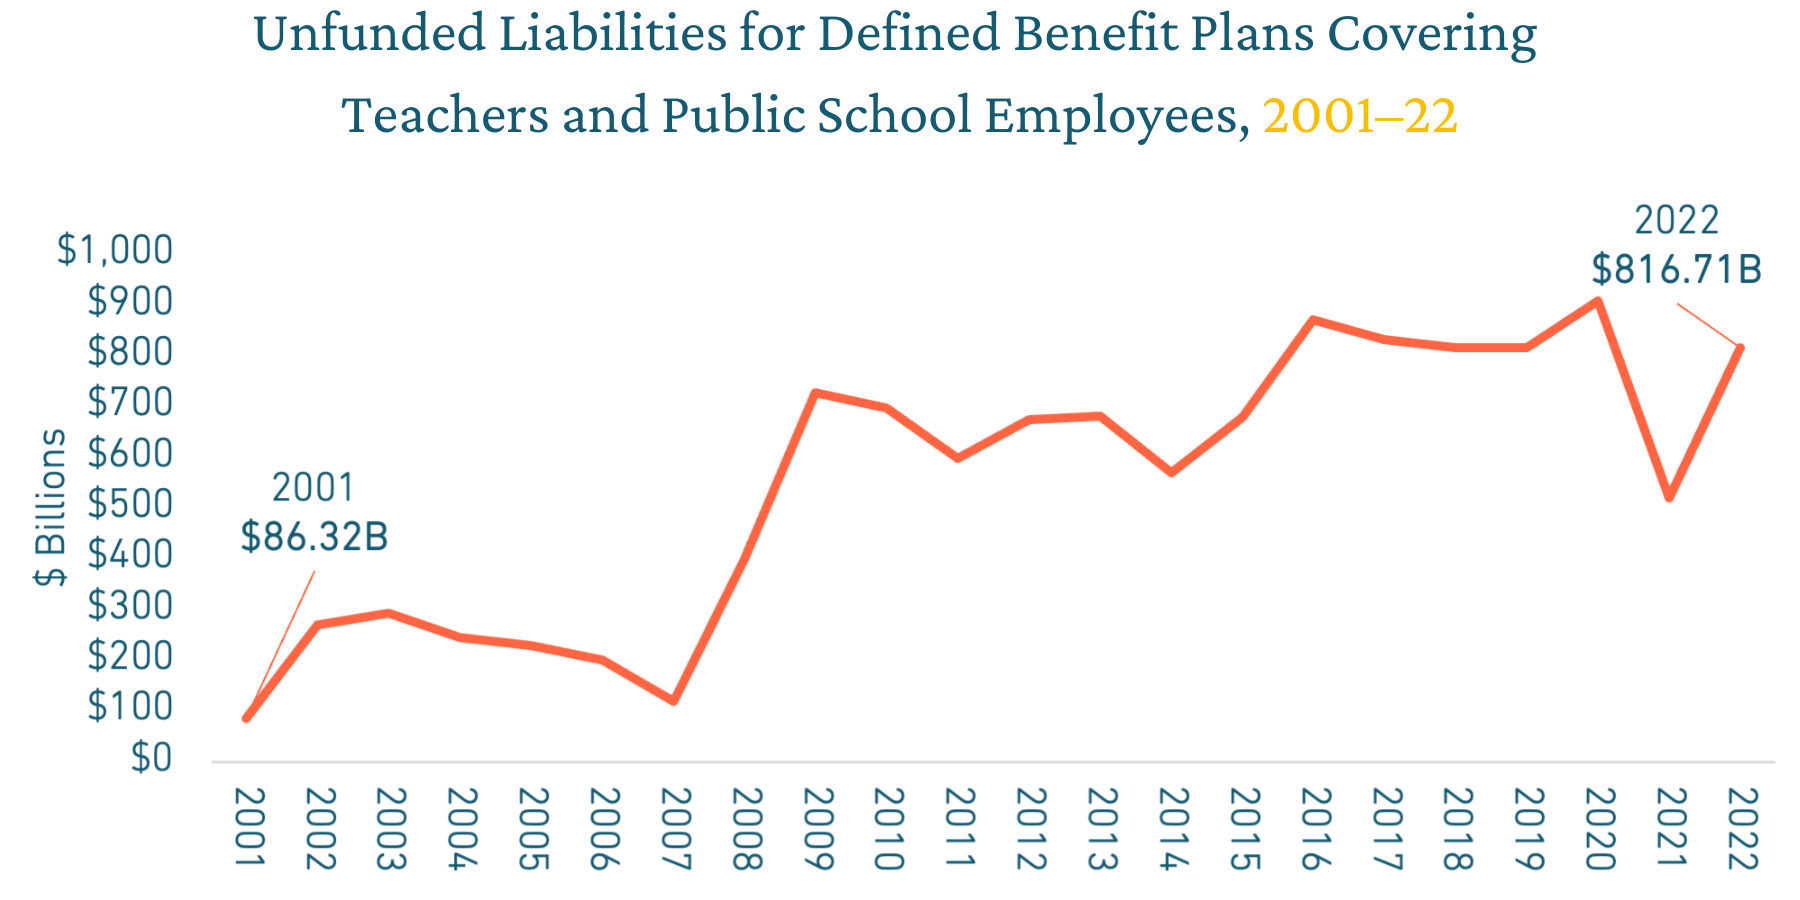
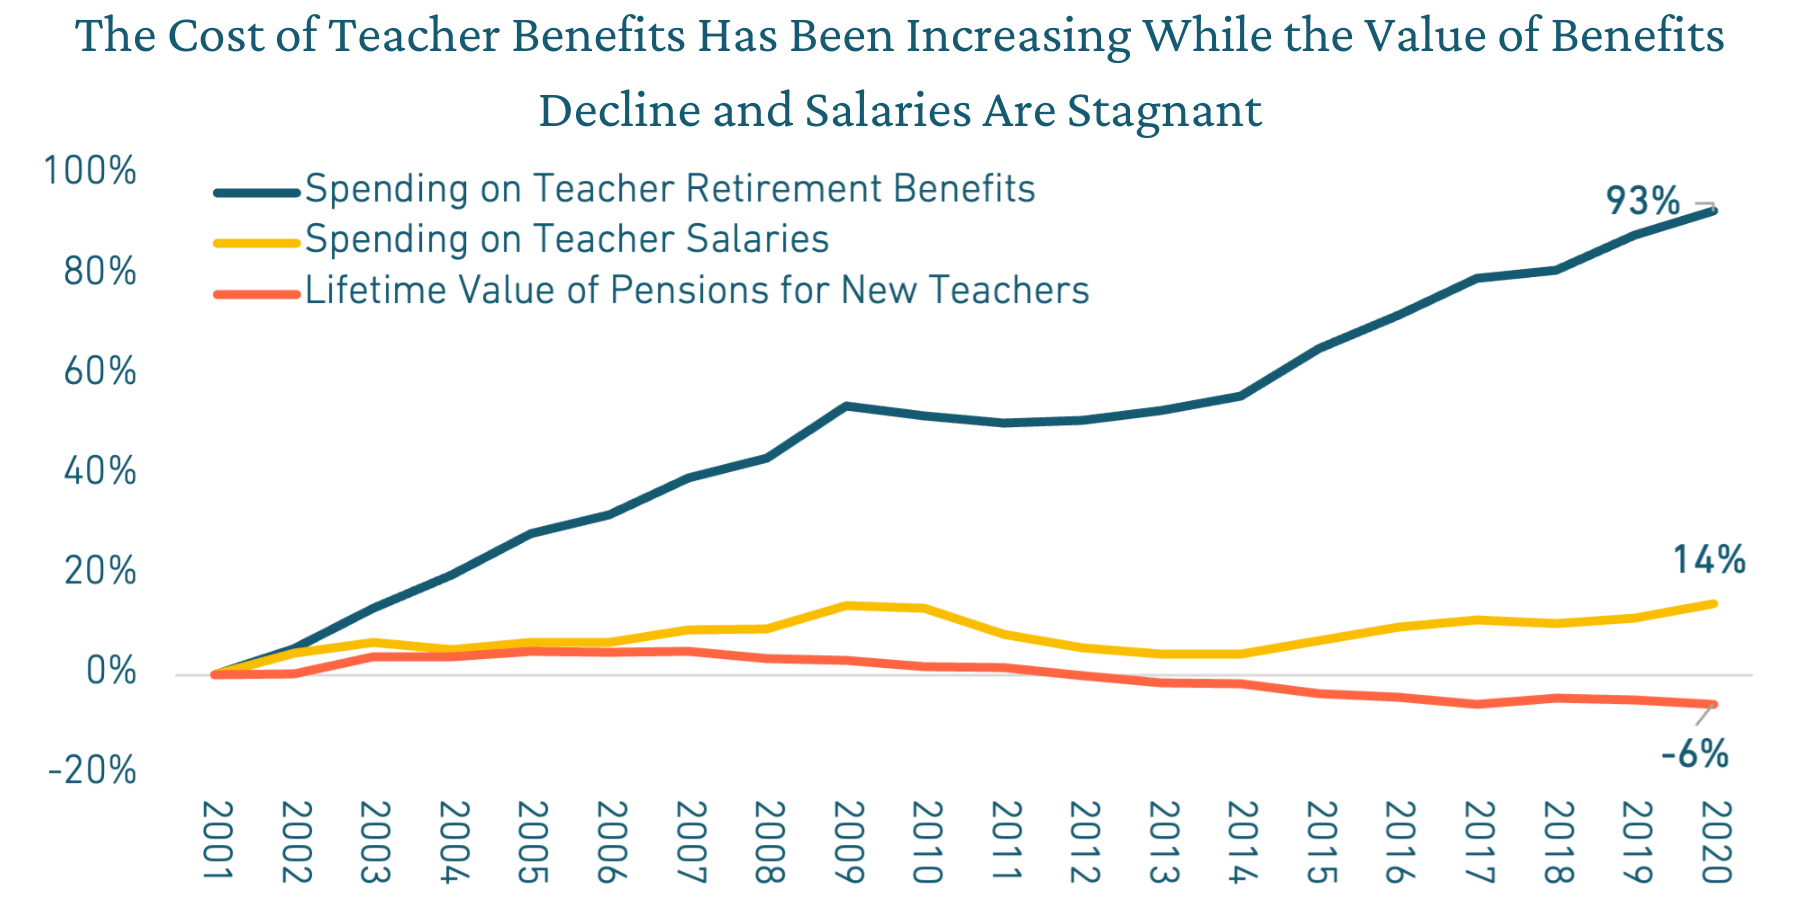
Teacher pension costs have grown significantly faster than K-12 education spending over the past two decades, driven by teacher pension unfunded liabilities. These rising costs have necessitated larger contributions from states and local school districts' budgets to fund retirement benefits. As a result, teacher retirement costs have consumed an increasing share of total K-12 education funding, siphoning off money that could be spent on important resources and programs to improve educational outcomes for students and provide better supports for teachers.

This is a Hidden Education Funding Cut.

What Are Hidden Education Funding Cuts?

Since 2001, total teacher retirement costs as a share of state and local K–12 spending has increased 322%

The chart below shows the growth of teacher retirement spending as a share of state and local spending in two ways:

  • The light blue line shows the growth in share of state-only education spending going to teacher retirement costs since 2001. Because most states determine retirement spending at the state level, therefore state dollars are a reasonable way to assess hidden education funding cuts.
  • The dark blue line shows the growth in share of state and local spending going to teacher retirement costs since 2001. The majority of funding for schools comes from the local level. From this perspective, looking at hidden funding cuts in the context of combined state and local spending provides a more complete understanding of the impact of these hidden education funding cuts.

Retirement benefits are an important part of deferred compensation for educators and spending on these benefits is important and necessary to ensure they remain available to future generations of educators. 

That means what is important is the trendline — as in, the trend over time. What is the trend in retirement costs as a share of K–12 spending? Where was it before and where is it going? Right now, the trendline is going in the wrong direction for an overwhelming majority of states.

Hidden Education Funding Cuts are the Result of Pension Debt.

The primary reason for the growth in these hidden cuts is that retirement costs are growing at a much faster rate than K–12 spending. The main reason that retirement costs are rising is a growth in unfunded liabilities — colloquially known as pension debt.

Between 2001 and 2022, teacher pension plans went from having effectively no pension debt to around $816 billion, shown in the figure belowThis, in turn, has required an increase in contributions to pay down that pension debt. Formally these are called unfunded liability amortization payments, but it is easier to think of them as pension debt costs

Normal costs refer to the amount of money needed to fund pensions for teachers today, in real-time. These costs have remained relatively stable over the last two decades. However, because many states have underfunded their teacher pension plans, pension debt costs have grown 422% in the same time period, shown in the figure below.  

As of 2020, pension debt accounts for two-thirds of all  teacher retirement spending. 

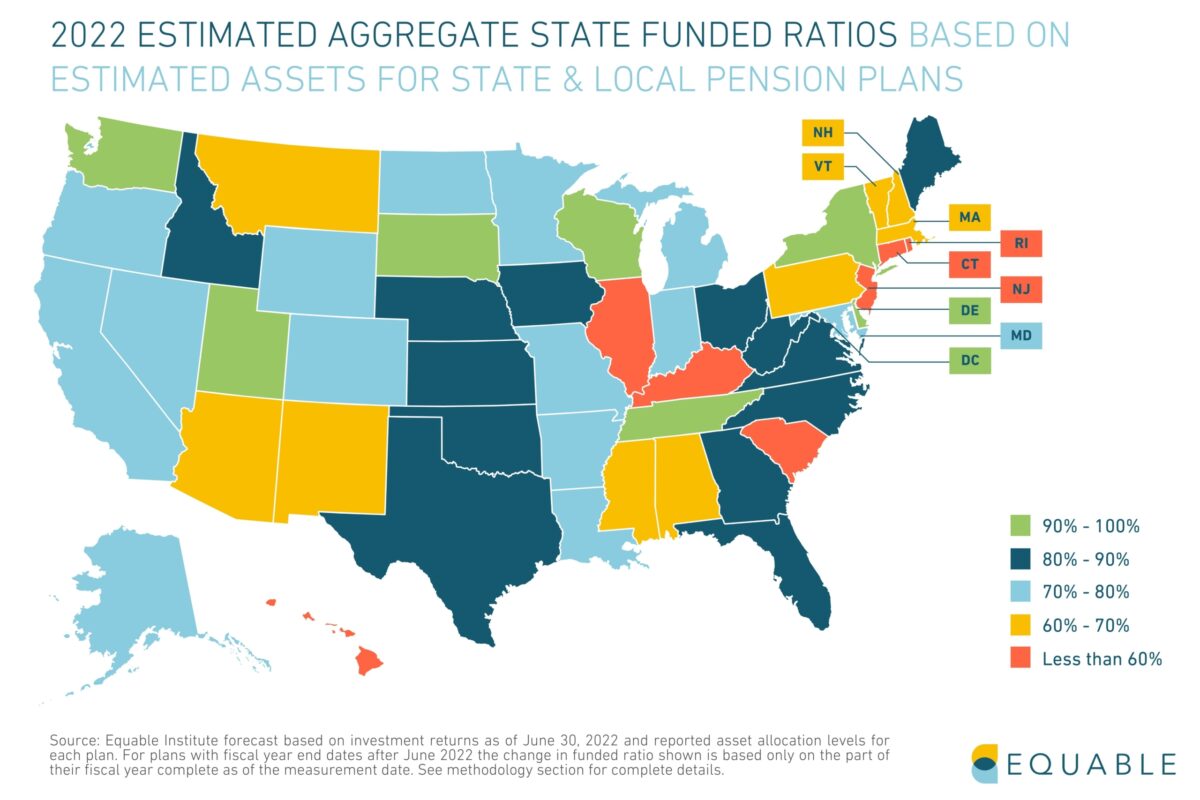
Hidden Education Funding Cuts By State

There are two different ways of thinking about the change in hidden education funding cuts over time:

Percentage growth, typically measured over the last two decades or since 2009

or

Absolute change in the size of hidden cuts

Either approach paints the same trendline picture — either positive or negative depending on the state. But the scale of change can be different, and each approach can make certain states look better or worse compared to one another.

State & Local Hidden Education Funding Cuts by Percentage Growth


The heatmap below shows the percentage change in state and local hidden education funding cuts over the past two decades:

Hover your mouse over a state to see more information.

How States Compare


Click on the column headers below to sort the table. 

Dive Deeper: State Case Studies

How North Dakota Managed its Hidden Education Funding Cuts

How Pennsylvania's Hidden Cuts are Taking Money from the Future

Additional Resources