Share

America’s Hidden Education Funding Cuts
Across the United States, growing unfunded pension liabilities have quietly slashed state education budgets, leaving fewer dollars for teacher salaries, classroom resources and other education priorities.

What Are Hidden Education Funding Cuts?
The growing cost of unfunded pension promises is having direct and immediate influence on the ability of school districts to serve children.
Since 2001, teacher pension plans have collectively fallen hundreds of billions of dollars behind in the savings levels necessary to pay all future promised benefits. Meanwhile, state K–12 education spending levels have generally been stagnant. Many states simply have not ensured education funding levels are keeping up with the increased costs created by pension funding shortfalls.
In an era when school districts nationwide are struggling financially, growing pension costs are exacerbating already-existing fiscal stress. The result is that less education money is available today for teacher salaries and classroom spending than there would be if teacher pension funds had been better managed over the past two decades.
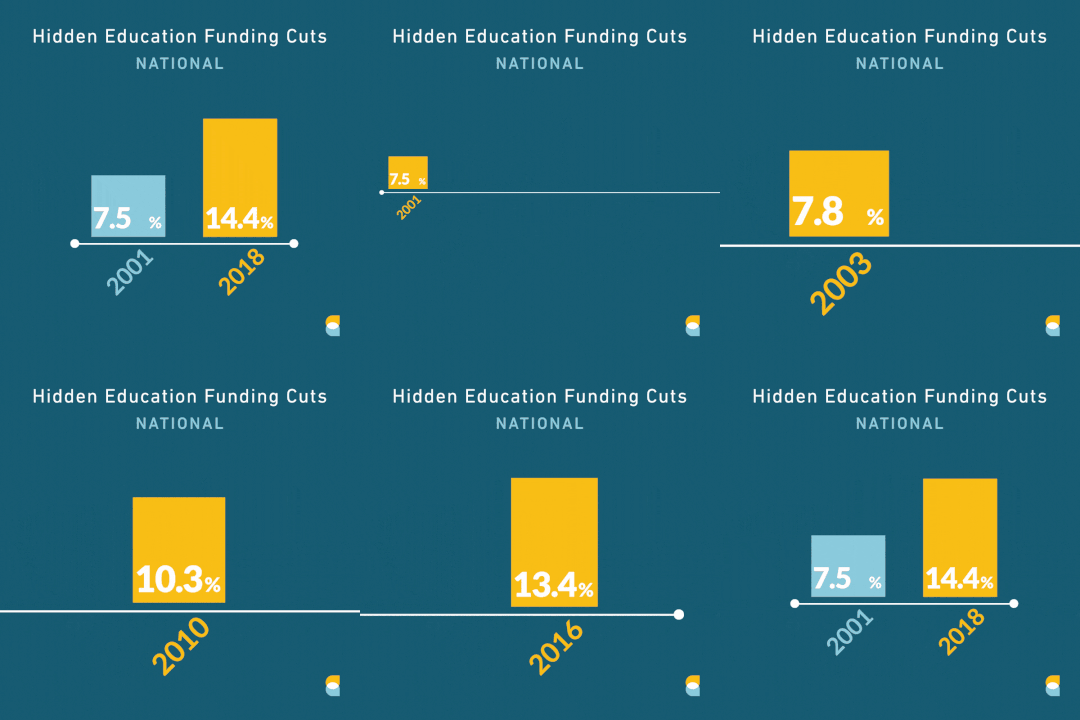
On a national level, the share of state education spending going to pay pension costs has nearly doubled from 7.5% in 2001 to 14.4% in 2018. TweetAnd that’s the hidden cut to education funding.

The effects of these cuts are felt particularly hard in high-need districts which have fewer local resources to draw on to fill in the gaps when education costs rise, creating less funding for teacher salaries and programs aimed at improving academic and other outcomes.
The chart below ranks which states have seen the largest growth in total K-12 education spending going to pension costs.
We recommend viewing interactive charts on desktop for the best experience.
Hidden Education Funding Cuts documents the changes in education funding and teacher pension costs for all 50 states and Washington, DC between 2001 and 2018.
States tend to separate out their education spending decisions and management of pension funds. And this is the primary culprit we identify that is driving the hidden education funding cuts themselves.
How Did This Happen?
In almost all states, the dollars used to pay pension costs come from education budgets. As education spending has stagnated, growing pension costs are crowding out resources intended to improve education outcomes.
There has been a lot of ink spilled in documenting the funding challenges of public sector pensions in the United States today. These challenges include funding woes created by bad legislative and actuarial policies of the past, and growing levels of risk for the future. By comparison there has been relatively little attention paid to specific ways growing pension costs have affected public education spending.
To understand this problem, we have to look at how funding for primary education has changed in the last two decades. When accounting for inflation, K-12 education spending has been stagnant, increasing by just 19%.
We recommend viewing interactive charts on desktop for the best experience.
In the same period, unfunded liabilities — or “pension debt’ — for teacher pension plans have exploded. The chart below shows by 2018 the teacher portion of unfunded liabilities for pension systems covering teachers had ballooned north of $642 billion, up from just $21 billion in 2001.
We recommend viewing interactive charts on desktop for the best experience.
The way that states typically pay for teacher pension costs, it is almost inevitable that education spending will be crowded out. Required contributions to teacher pension funds can be paid directly by the state out of legislatively managed funds, or they can be paid by the local employer such as a school district. Some states use both methods for different portions of pension costs. But in almost all cases, the dollars used are coming from funds intended to be spent on education — very few states use general fund dollars for teacher pension costs.
This means that as pension costs have grown, education budgets have failed to keep pace, quietly slashing education dollars available for teacher salaries, classroom resources and other education priorities.
Finding the Hidden Cuts
While these hidden education funding cuts are widespread, not all states are the same.
To understand how education budgets have been slowly eroded by growing pension costs is to comprehend that the growth in pension costs themselves have been gradual and unexpected for policymakers.
Most states increased pension benefits in the 1990s, but only a few states did the same during the 2000s. If anything, states have been trying to reduce “normal costs” since 2009 by cutting the value of benefits being offered to new teachers. Instead, as unfunded liabilities have grown, amortization payments to eliminate those unfunded liabilities have grown, too.
The growth in these pension debt payments has been chipping away bit by bit at education spending to the point where in some states it is consuming K–12 budget dollars intended for the classroom. The graphic below shows how the share of K-12 education spending has increased since 2001.
We recommend viewing interactive charts on desktop for the best experience.
What Does This Mean? How Do We Fix It?
Ignoring this problem only makes it worse. Leaders in every state should look closely at how serious their hidden cuts are.
The problem is this: Apathy toward growing shortfalls in pension funding is creating a serious challenge to school finance stability, the ability to raise teacher pay, and efforts to support and increase education resource equity.
All states have prioritized education spending increases at some point over the past two decades, but spending on teacher pension costs has simply grown faster. The national trends are clear — teacher pension costs are consuming a greater share of K–12 spending each year and are putting a squeeze on education budgets.
The severity of the hidden cut to education spending varies considerably from state to state. It is important to look deeper at these trends on a local basis to understand how they might be influencing education outcomes in your state. Download your state’s profile below to learn more.

Your state's profile
Download your state's profile to learn more.
In the absence of significant additional resources or actions by state policymakers, pension debt costs are crowding funds out of public schools. This has a direct impact on the ability of school districts to meet the needs of its students. You can learn more about how these hidden education funding cuts influence the ability of school districts to provide education services to all our review of hidden funding cuts for California School Districts.
The impact of unfunded liabilities on education spending will not go away unless states step up to address the hidden funding cuts facing our schools. Solving for this challenge means adapting today’s pension plans for the 21st century, adopting more rigorous policies at the state level that require fully funding pension plans, and ensuring that the dollars required for these changes are provided without drawing from existing education budgets, as that would just exacerbate the hidden funding cut.
While states should be applauded for responsible management of their pension funds and efforts to reduce their pension debt in the long-term, it does not address the vital education dollars lost to pension costs today. Education budgets could be automatically expanded as teacher pension costs grow, or teacher pension debt costs could be paid out of general funds. Whatever the approach, unless there is a change to the status quo, additional contributions to state or local retirement systems will mean less money for education purposes.
While the national trend of hidden education funding cuts is clear, there are a lot of differences in the hidden education funding cuts when we drill down to the state level. Trying to analyze 50 states plus D.C. on one line graph has inherent limits. To dig into some of the variance between states we’ve built two additional graphics that explore the difference.
First, this interactive comparison of the hidden cut trend lines themselves looks at state curves over the past 18-years compared to the national average. We also show the relative size of the percentage increase over time.
We recommend viewing interactive charts on desktop for the best experience.
Second, this static representation of how much hidden cuts have grown between 2001 and 2018 takes into account that states started in different places in 2001. We are interested in both the current level of state education funding cuts, and also the size of the increase over time.
We recommend viewing interactive charts on desktop for the best experience.
Unfunded Teacher Pension Liabilities: Comparing State Differences
The national total of unfunded liabilities for teacher pension plans have grown relatively steadily over the past two decades, with some acceleration around the financial crisis of 2008. There are a lot of differences with state specific trends, including some growing more rapidly than others, some with low levels of pension debt until recently (e.g. Florida), and some with improving funded levels (e.g. Utah, Rhode Island).
The figure below is an interactive tool to find your states teacher pension unfunded liability trend line in dollar terms, and see its current funded ratio. The funded ratio provides a common point of comparison across states with different sizes.
We recommend viewing interactive charts on desktop for the best experience.
The following two figures show a line chart with all 50 states plus D.C. to see the trend line in unfunded liabilities stacked against each other. This analysis is messy because many states have similar trends, and thus makes the outlier states stand out. We’ve put California and Illinois on a separate graphic because of how their outsized teacher pension debt levels skew the axis.
We recommend viewing interactive charts on desktop for the best experience.
We recommend viewing interactive charts on desktop for the best experience.

