Is there a state pension crisis in the United States?
The short answer is no. Despite headlines claiming that state pension funds are in trouble, there is no widespread crisis of public pension plans facing the prospect of near-term insolvency or bankruptcy.
However, there are many states and pension plans that face dire long-term sustainability challenges. These can come with serious ramifications if they continue to go unaddressed. There are many communities who are suffering today from the effects of unsustainable increases in costs for paying off pension debt.
That being said, a longer and more complete answer must define “crisis” in the context of state or local pension plans.
There is no shortage of commentators arguing that there is currently a US public pension crisis. Though exactly what that crisis might be depends on who you ask.
Some have said pensions will soon go bankrupt. Others have said pensioners (or retirees) are at risk of plunging into poverty. While others have focused on investment mismanagement of pension assets. Often the concept of a “pension crisis” is mixed with a “retirement crisis.” The latter of which is a more general concern about if Americans are saving enough for retirement.
In this article, we break down some of the different metrics we use to measure the health of pension funds. We use actual data to determine whether or not there is a state pension crisis in the United States.
Ultimately, our assessment of the data shows there is no near-term “solvency” crisis for most state pension funds. However, there is a “sustainability” crisis in many states. Specifically, this “crisis” threatens states, cities, and counties where growing contribution rate requirements threaten a range of public services such as school programs, infrastructure programs, defenses against the effects of climate change, public housing programs, and more.
Ways to Define a Public Pension Crisis
There are multiple ways to think about whether a public defined benefit pension plan could be facing a “crisis”:
- Near-term Insolvency Crisis: Is the pension fund at risk of running out of money to pay benefits in the next 2, 5, or 10 years?
- Long-term Insolvency Crisis: Is the pension fund at risk of running out of money at some point in the future? Several decades from now, but still forecast to one day become insolvent/go bankrupt?
- Management Crisis: Are the pension fund’s trustees mismanaging assets? This includes using very risky investment strategies or paying out very high fees without a reasonable return.
- Retirement Crisis: Are retirees in general at risk of falling into poverty because of a lack of adequate pension benefits?
- Budgetary Cost Crisis: Are the costs of paying for the unfunded liabilities of pension plans “crowding out” or threatening other public goods and services?
- Sustainability Crisis: Are the costs of a pension fund growing so large as a share of government budgets or state GDP that future taxpayers are unlikely to be able to adequately provide funding to a pension plan?
What the Data Says: Public Pension Insolvency Concerns
First, let’s look at the financial data on the solvency of pension funds in the United States. In this context, a “solvent” pension fund is one that has enough money on hand to pay out all promised benefits for at least a year.
This isn’t a very high standard to meet. The lower the assets in a pension fund, the more likely it is at some point to become insolvent. But as long as there are assets, in theory, a pension fund can generate investments returns on their money. They can also continue to receive contributions from government employers and members.
So how many pension funds in America today at risk of near-term or long-term insolvency? Somewhere between 10% and 20% of the largest state and local pension plans in the United States are at risk.
That number is based on an estimate from a group of retirement policy experts using data from 2019. This group defined two levels of extreme risk for pension fund solvency:
- “Deep Red”: Projected to become insolvent in 20 years; AND the ratio of inactive to active participants is more than 2 to 1, OR the plan is less than 80 percent funded.
- “Red”: Received less than 100 percent of the actuarially determined contribution (ADC) over the past 5 years; AND the funded ratio is under 65 percent.
Plans Designated as Deep Red Zone or Red Zone
| Plan Name | Risk Zone | Funded Ratio | Percent of ADC paid over prior 5 years | Ratio of active employees to beneficiaries | Ratio of contributions to normal cost plus UAAL interest | Ratio of Non- Investment Cash Flow to Beginning of Year Assets (%) |
|---|---|---|---|---|---|---|
| Arizona State Corrections Officers | Red | 52 | 84 | 88.0000 | 0.7700 | 68.0000 |
| Charleston (WV) Firemen’s Pension | Red | 13 | 78 | 264.0000 | 86.0000 | 462.0000 |
| Chicago Fire | Red | 21 | 81 | 114.0000 | 92.0000 | 410.0000 |
| Chicago Police | Red | 24 | 73 | 116.0000 | 83.0000 | 21.0000 |
| Chicago Teachers | Red | 48 | 90 | 126.0000 | 80.0000 | -479.0000 |
| Colorado School | Red | 63 | 81 | 75.0000 | 82.0000 | -344.0000 |
| Colorado State | Red | 61 | 83 | 93.0000 | 83.0000 | -434.0000 |
| Denver Employees | Red | 62 | 99 | 155.0000 | 101.0000 | -305.0000 |
| Hawaii ERS | Red | 58 | 86 | 90.0000 | 82.0000 | -115.0000 |
| Illinois SERS | Red | 41 | 83 | 127.0000 | 89.0000 | -65.0000 |
| Illinois Teachers | Red | 42 | 81 | 88.0000 | 77.0000 | -234.0000 |
| Illinois Universities | Red | 44 | 93 | 214.0000 | 86.0000 | -328.0000 |
| Jacksonville Fire and Police | Red | 49 | 78 | 141.0000 | 68.0000 | -307.0000 |
| Kentucky County | Red | 50 | 98 | 141.0000 | 84.0000 | -251.0000 |
| Kentucky Teachers | Red | 57 | 93 | 98.0000 | 86.0000 | -362.0000 |
| Massachusetts Teachers | Red | 56 | 95 | 71.0000 | 88.0000 | -284.0000 |
| Mississippi PERS | Red | 63 | 93 | 84.0000 | 88.0000 | -444.0000 |
| Missouri State Employees | Red | 59 | 98 | 163.0000 | 89.0000 | -445.0000 |
| New Mexico Educational | Red | 62 | 85 | 103.0000 | 79.0000 | -346.0000 |
| Omaha ERS | Red | 54 | 93 | 87.0000 | 88.0000 | -546.0000 |
| Omaha Police and Fire | Red | 60 | 89 | 109.0000 | 88.0000 | -65.0000 |
| Omaha School | Red | 64 | 77 | 83.0000 | 67.0000 | -262.0000 |
| Providence ERS | Red | 26 | 100 | 124.0000 | 90.0000 | -47.0000 |
| South Carolina RS | Red | 57 | 97 | 84.0000 | 96.0000 | -192.0000 |
| Chicago Municipal | Deep Red | 22 | 49 | 146.0000 | 55.0000 | -797.0000 |
| Dallas Police and Fire | Deep Red | 41 | 76 | 112.0000 | 81.0000 | -528.0000 |
| Detroit Police and Fire | Deep Red | 67 | 61 | 389.0000 | 43.0000 | -1014.0000 |
| Jacksonville ERS | Deep Red | 61 | 100 | 147.0000 | 77.0000 | -554.0000 |
| New Jersey PERS | Deep Red | 53 | 96 | 75.0000 | 85.0000 | -436.0000 |
| New Jersey Teachers | Deep Red | 39 | 71 | 69.0000 | 75.0000 | -697.0000 |
| Oklahoma Fire | Deep Red | 72 | 105 | 130.0000 | 90.0000 | -752.0000 |
| Texas ERS | Deep Red | 66 | 97 | 94.0000 | 83.0000 | -428.0000 |
| Texas LECOS | Deep Red | 59 | 59 | 42.0000 | 43.0000 | -606.0000 |
Source: Urban Institute
What the Data Says: Pension Management Crisis
A common concern for public pension plan is that they pay out too much in fees.
There is no question that this is a real concern. For example, a Pennsylvania state commission issued a report running nearly 400 pages to consider best practices and management of their statewide retirement systems. One of the key focuses of that report was the fees paid by the state’s pension plans. Another example is New York City, whose comptroller once found compelling data revealing that after accounting for fees, city pension plans were underperforming.
A related concern is that investment managers for pension funds adopt “bogus benchmarks” to measure themselves against. Every pension fund wants to measure how well its investments are performing. How they should do that is a subject of debate. However, every pension fund adopts a set of “benchmarks” to grade their performance against. Typically these benchmarks are widely available measurements of how other investors have performed or how financial markets as a whole have performed. For example, if the entire S&P 500 stock market index gained 5% but a specific pension fund gained 4%, then the fund underperformed relative to that benchmark.
The criticism leveled against state and local pension funds is that they choose benchmarks that are too easy to over perform against. This allows pension funds to avoid making important and difficult decisions about ways they could improve their investment strategy.
While there are reasonable concerns about both investment management fees and benchmarking policy, are these creating a “crisis” for pension funds? It depends on how broadly the word “crisis” should be used. In general fees are not the reason that pension funds have a more than $1 trillion funding shortfall, as of 2022 data.
Equable analyzed the sources of unfunded liabilities accumulated between 2000 (when state and local pension plans were last effectively fully funded on average) and 2019 (before the pandemic). We found that 41% of their reported unfunded liabilities were from underperforming investments, after accounting for fees.
Put another way, pension funds over the past two decades assumed that they could earn investment returns between 7% and 8% a year on average. But they didn’t. And the underperformance against this expectation created over $567 billion in pension debt between 2000 and 2019 for the largest state pension plans. So if there is a “management crisis” for pension funds it is the use of unrealistic assumed rates of return.
For example:
The chart below shows the average assumed rate of return for state and local pension funds over the past two decades (the light blue line). For comparison, we also show how interest rates have changed over the same period, whether considering the 10-year treasury yield (yellow line) or 30-year yield (dark blue line).
The difference between interest rates and the assumed rate of return reflects how much pension funds think they can get by taking risks with their investments beyond just buying perfectly safe U.S. Treasury bonds. If pension funds had maintained a consistent attitude toward their risk as they did back in 2001, then the average assumed rate of return in 2022 should be somewhere around 5.5% (see the dashed light blue line). However, the trustees managing state pension funds have taken on more risk with their investments. They have adopted unrealistic assumed rates of return on those investments, all in order to keep their costs down. If there is a “crisis,” it is there.
What the Data Says: Public Retirement Crisis
Are people saving enough for retirement? Recent analysis of retirement savings for private sector individuals who don’t have pensions suggests that they might not be. There are some common counter arguments to this concern that point out Social Security benefits are actually better than many people understand, particularly for retirees on the poverty line. And Social Security benefits are set to receive a very large inflation adjustment in the coming year.
However, the general concerns about a “retirement crisis” that get circulated in the media are almost uniformly about the private sector. There is very little concern about retirement income values for those who have a public sector pension.
There is no “crisis” of retirement income values for public sector retirees. But, that doesn’t mean there are no reasonable concerns. Equable recently analyzed the value of retirement plans for new teachers, and found that since 2005 states have systematically cut the value of pension benefits for new hires.
What the Data Says: State Budget Cost Crisis
If there is any “crisis” for pension plans, it starts with the costs of paying for growing unfunded liabilities. State and local pension funds reported more than $1 trillion in unfunded liabilities in 2020. They reported just under $1 trillion in funding shortfall for 2021. Once 2022 numbers are formally reported, the unfunded liabilities for pension funds will be back over the $1 trillion mark. Reaching this point has meant higher costs for states, cities, and school districts.
The figure below shows the contribution rates paid by government employers.
Note that the driving factor is a growth in payments toward unfunded liabilities.
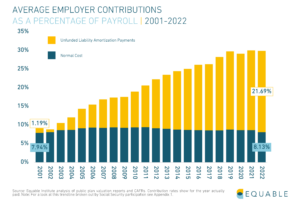
These growing costs have a real effect. Consider the growth in costs for teacher pension benefits. Equable found that between 2001 and 2018 the share of state education K–12 budgets that were used to pay pension costs increased from 7.5% to 14.4%. This has meant fewer resources for schools and students. In California, school board members reported cutting arts and music programs, taking out loans, delaying school building upgrades or technology purchases, and increasing class sizes. Growing teacher pension costs are explicitly cited as the reason for these cuts.
That means pension costs are influencing education quality, programs, and experiences for students right now. That probably qualifies as a “crisis.”
This isn’t the case in every state. Some states have very low pension costs relative to their K–12 budgets. Other states have managed to increase their education budgets even as pension costs have grown. But nationally, there is a problem with increasing “crowd out” of education funding by teacher pension costs. This is because legislatures failed to ensure students are held harmless as teacher pension unfunded liabilities have increased.
What the Data Says: Sustainability Crisis
Measuring the fiscal health of a retirement system is a complex project. As we’ve written elsewhere: we define financially healthy, sustainable retirement systems as those that are both resilient and affordable.[2] Resilience matters because for governments to thrive and be effective. They need their programs and services to be prepared for negative shocks and tail risk events. Public sector retirement systems should not be prone to significant destabilization due to external factors, mismanagement, or political whims. Further, retirement systems should be able to adapt to changing economic and demographic conditions in both the short- and long-term. They should not be designed in ways that allow threats to build over time, to threaten the retirement security of members, or to impede the fiscal stability of their sponsoring government’s budgets.
Measuring pension plan sustainability means looking at both solvency metrics over time (funded ratios and unfunded liability levels). Costs of providing the retirement plan relative to existing tax revenues should be looked at as well. The larger required pension payments are relative to the size of state budgets, the harder it is for the state to ensure responsible funding policies. This is because of the higher cost burden. If such costs are growing because of consciously made policies that set benefit levels in a known way with clearly allocated resources to pay them, this might not be a problem. When larger payments are required because unfunded liabilities are growing, that represents a funding threat.
Here is a multi-factor framework for determining which the status of a retirement system.
There are five factors that we consider in setting this measurement:
- Funded Ratio (Funded Status)
- Unfunded Liability as a % of GDP (Ability to Pay)
- Assumed Rate of Return (Underperformance Risk)
- Share of Required Contributions Received (Willingness to Pay)
- Risk-Sharing Tools (Future Flexibility)
In Equable’s most recent State of Pensions 2022 report, we look at each of these metrics.
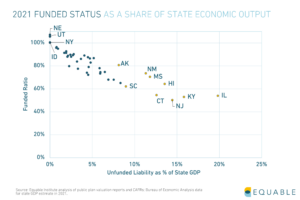
The following figure shows the number of retirement systems with “resilient,” “fragile,” or “distressed” funded ratios . We also show different states stack up on their unfunded liabilities as a percentage of state GDP in the next chart.
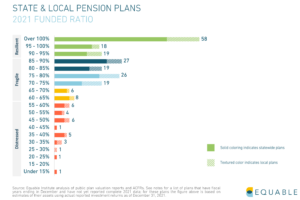
The good news is there are not many distressed pension plans relative to the rest of the country’s large state and local pension plans.
States with unfunded liabilities over 10% of GDP should be concerned. But, most are not in a place on this metric to be concerned about a “crisis.”
However, these charts do show that there are considerable unfunded liabilities to be addressed. Most pension funds are fragile and could fall into a distressed category if there is a particularly bad set of financial shocks that hit their balance sheets hard. Even if pension funds stay fragile, they have large costs for maintaining those unfunded liabilities, which we just discussed in section 5 of this article.
All of this points to a high degree of concern, even if it is not a “sustainability crisis.”
Note [1]: It is worth highlighting that since 2019, most pension funds have had a slight improvement in their funded ratios. Assets dipped in 2020, surged significantly in 2021, and then lost some value in 2022. The net effect is that between 2019 and 2022 there is a minor funded ratio improvement for many of the plans on the list above. But not so much as to save them all. It is also worth noting that in 2021 legislation was adopted in Arizona, Kentucky, and Texas. In various forms this legislation was intended to address insolvency concerns for plans on the list above. But it is also possible that data points for some of the plans in Chicago may have gotten worse over this time frame. So the list from Table 4 in the Urban Institute paper is not currently comprehensive. Even though it provides a good directional list of plans that are facing some level of insolvency risk. The 33 plans that list are 17% of the plans measured for the analysis in the paper. But it is likely that several have fallen off the list or will have shuffled between the “Red” and “Deep Red” categories. A reasonable estimate is that at least 10%. 10% of the plans are still in this insolvency risk range as of 2022.
Note [2]: Retirement systems also need to provide benefits in a transparent and responsible way (a set of activities we broadly define under the rubric of “accountability”). Plus, the benefits should provide a path to retirement income security for all participants in the system. But without resilience, there are no funds to manage in an accountable way or use for providing retirement income.