Public pension contribution rates have increased considerably over the last few decades. Some governments have had sharper increases than others. In many places mandatory pension contribution rates for public employees have increased, too. So what is your state paying for public employee pension benefits?
Currently, the average pension contribution rate for state and local employers is 29.82%.
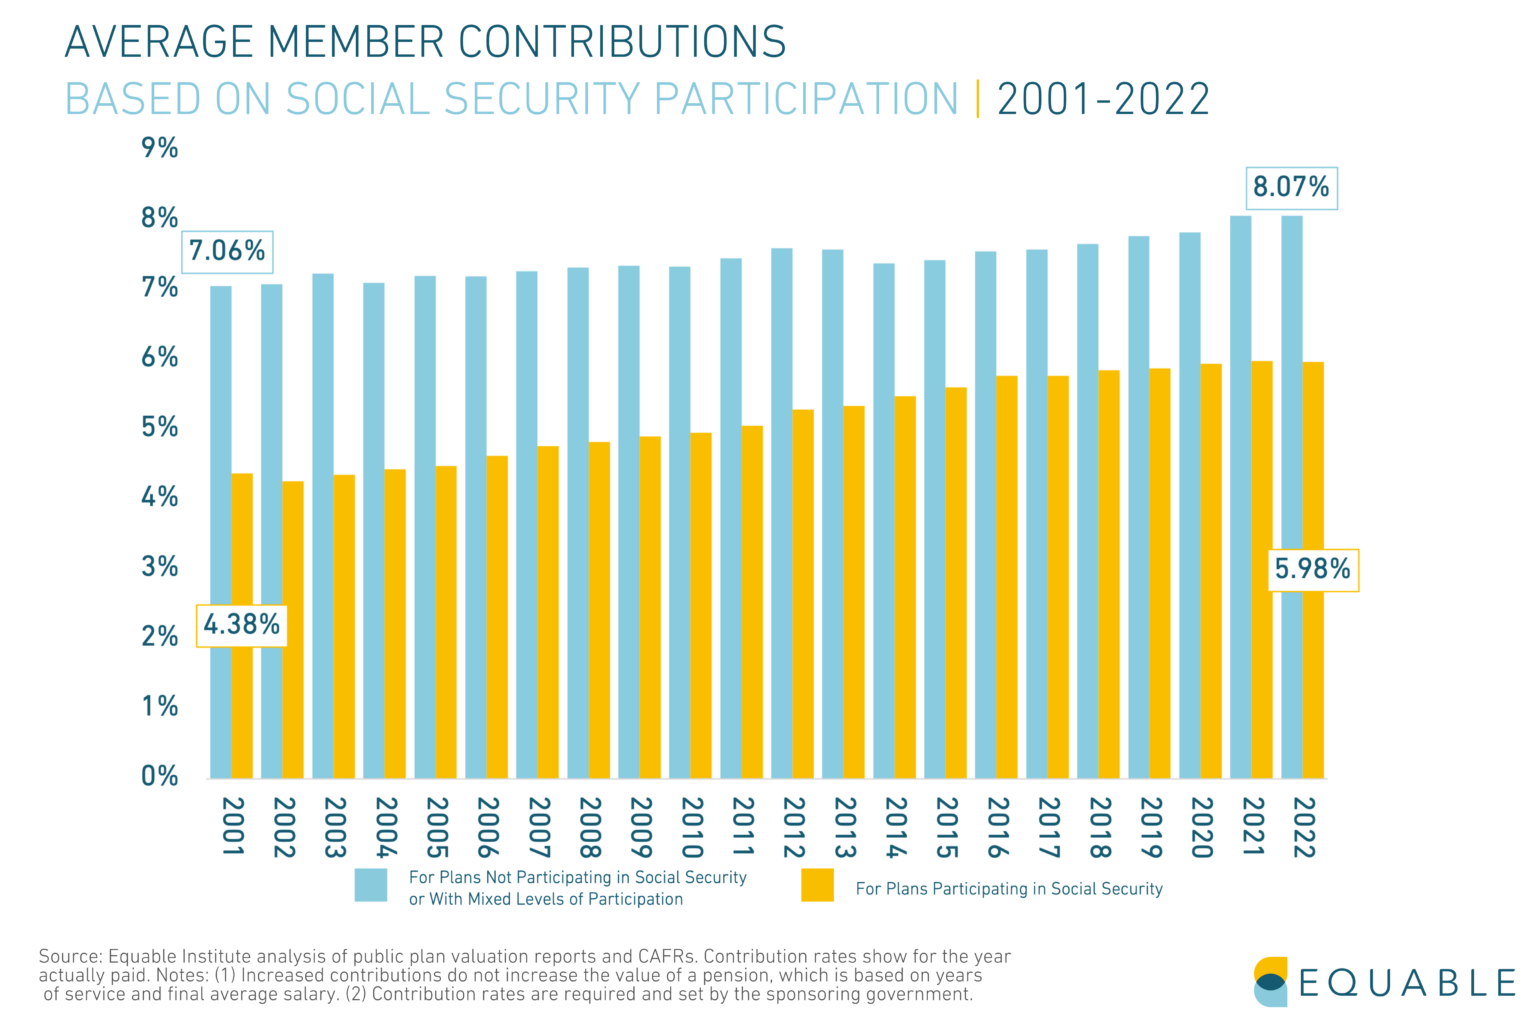
Employees enrolled in social security contribute 5.98% of their paycheck to their pension benefits, on average. While employees who are not offered social security contribute 8.07% on average.
In many states, pension contributions change from year to year and they may increase in 2023 and 2024. (Click here to see a version of this table with 2023 fiscal year data.)
It is important to keep in mind that states and cities do not uniformly participate in Social Security. Most individual government units do also enroll their employees in Social Security, but a few governments never opt-ed into the federal program. In theory, these non-participating locations should offer larger benefits and might have larger contribution rates.
The following charts show the average required contribution rates over time, broken out by state and locally administered plans, and whether or not members participate in Social Security. 
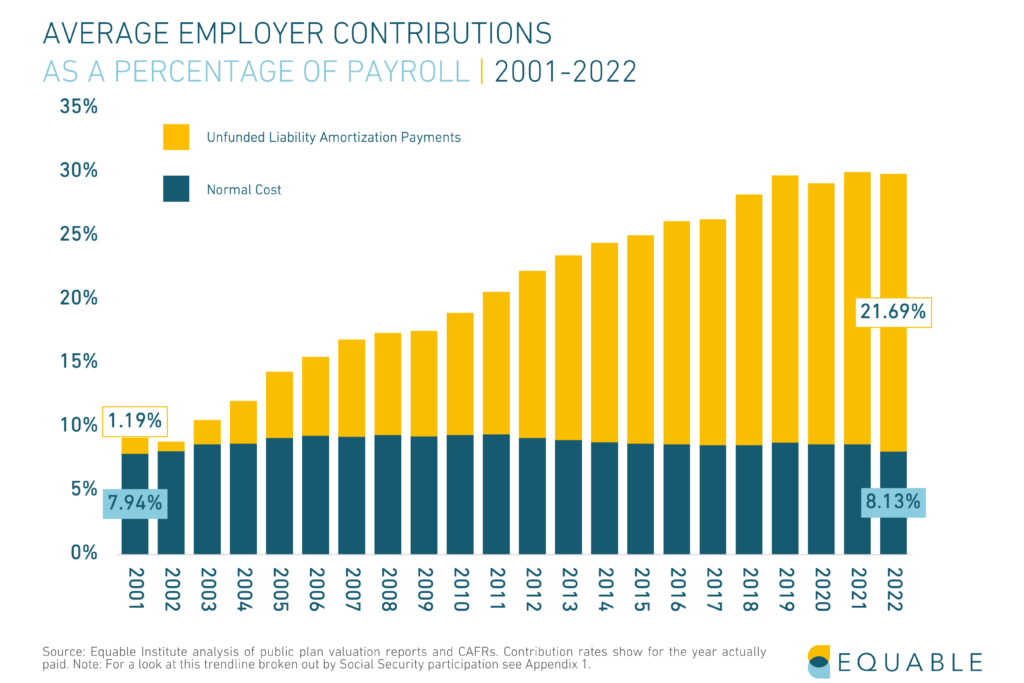
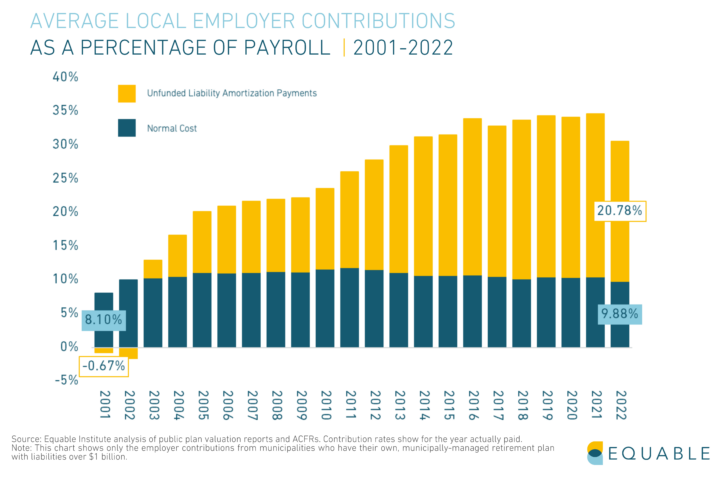
Download the contribution rate data yourself from our database, including detailed break outs of what share of state pension contributions go toward normal cost and unfunded liability payments.