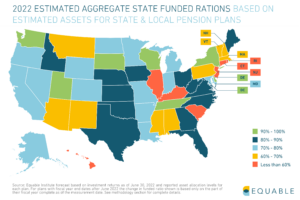
 Based on funded ratio, Wisconsin, Washington, and South Dakota
However, some states carry a larger share of pension unfunded liabilities (or pension debt) than others. California, Illinois, New Jersey, Texas, and Pennsylvania have the highest levels of unfunded liabilities in the United States by dollar value, as of September 2022. Washington State, New York, Tennessee, Wisconsin, D.C., and Delaware, carry zero unfunded liabilities. These states are actually overfunded.
The Best and Worst Funded Pension Plans in the U.S.
unfunded liabilities funded ratio
What do Unfunded Liabilties Mean for State Pension Plans?
It is important to understand that within certain states there can be a wide range of funded ratios for different pension plans. For example, in California while the state’s average funded ratio is 79%, some plans are around 100% funded (Contra Costa County Employees' Retirement Association) while others have run out of money and are fully dependent on the state legislature bailing them out each year (Judges' Retirement System).
The dollar amount of unfunded liabilities is typically also dependent on the size of a state’s public workforce and economy. States like Texas and Florida have large dollar valued unfunded liabilities in part because their state and local pension systems have struggled, and in part because they are simply very large states.
A helpful way to understand how much of a problem state pension unfunded liabilities are is to compare them to each state’s economy. And a common measurement of state economic activity is state GDP, or gross domestic product.
We have put together the following chart where each dot represents a state: from top to bottom the chart states are organized by their funded ratio; from the left to the right states are organized by unfunded liability as a share of GDP.