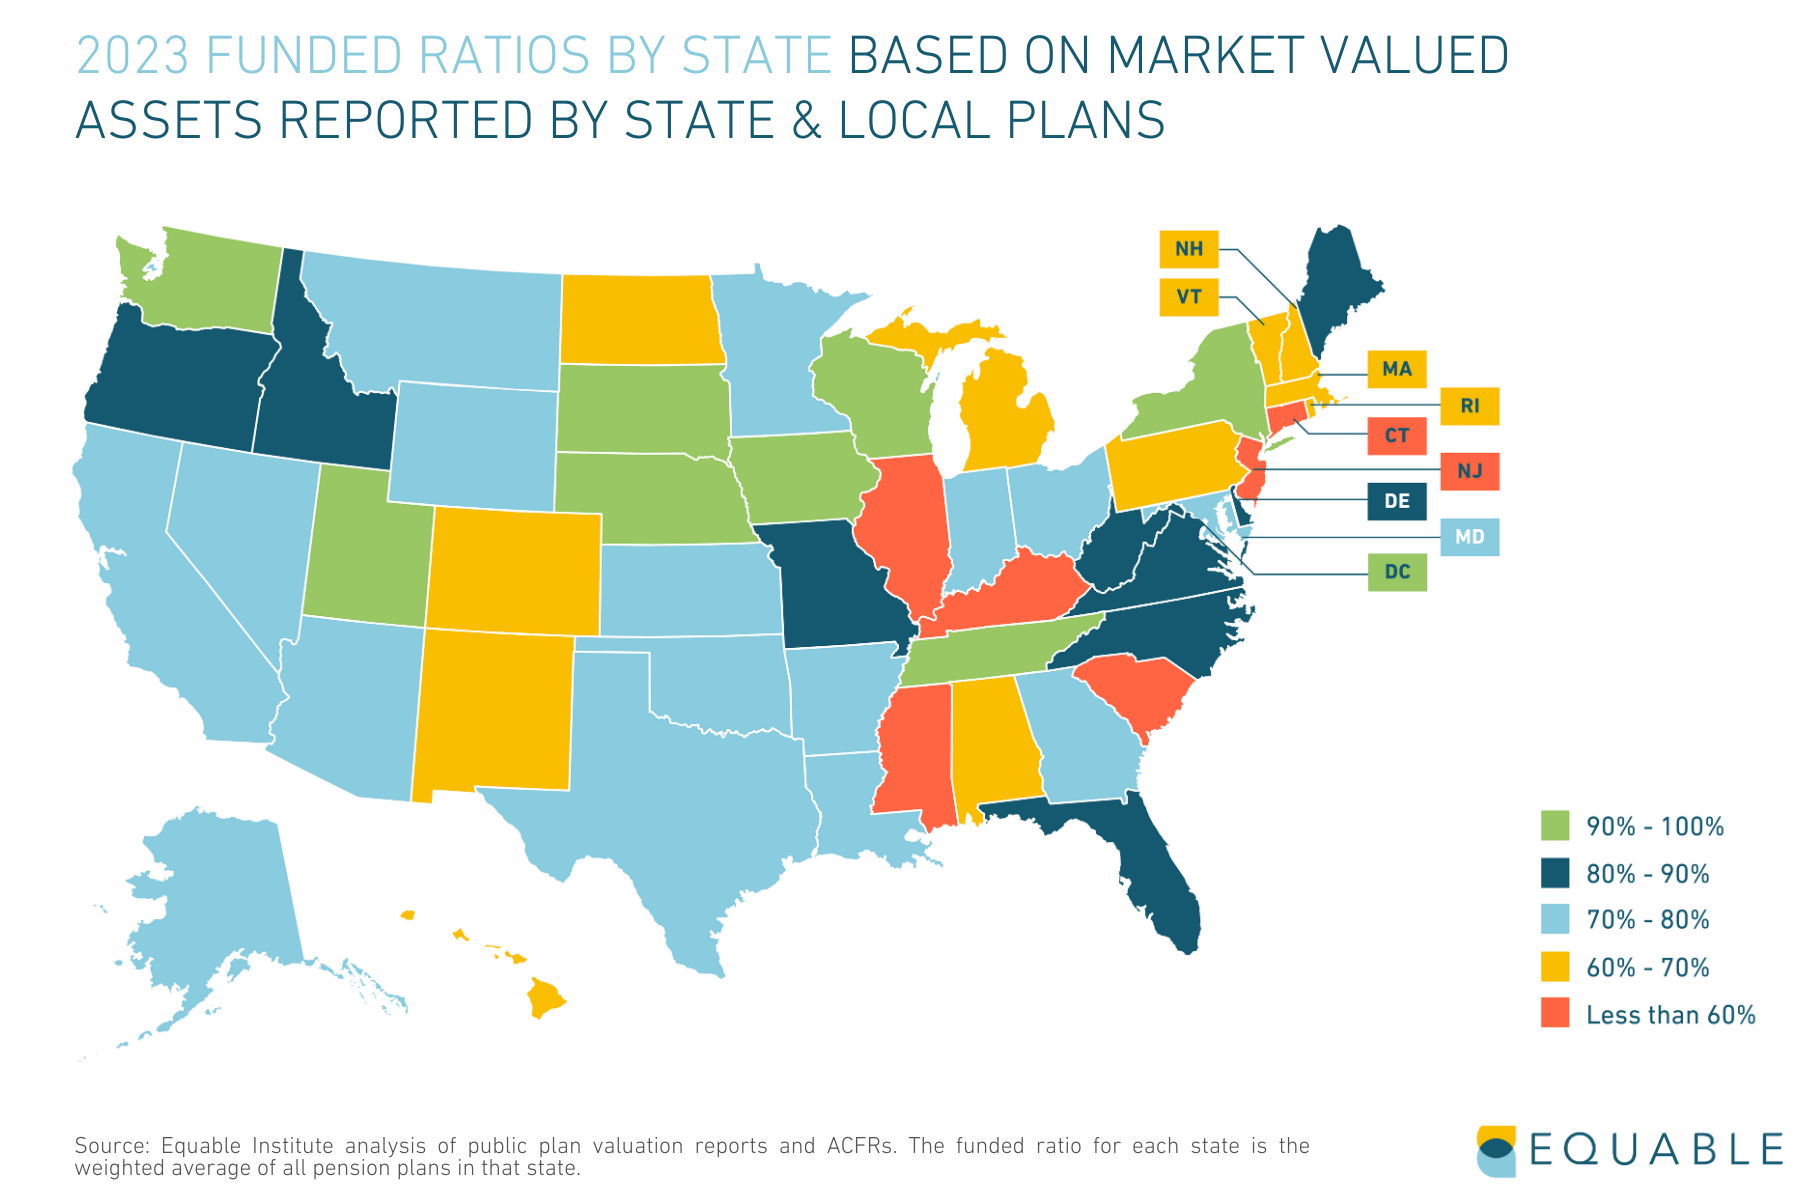
Based on funded ratio, Tennessee, Washington, Utah, South Dakota, and Washington, D.C. have the best funded public pension plans in the United States, as of June 30th, 2023. The worst funded plans are in Illinois, Kentucky, New Jersey, and Connecticut.
 However, some states carry a larger share of pension unfunded liabilities (or pension debt) than others. California, Illinois, Texas, and New Jersey have the highest levels of unfunded liabilities in the United States by dollar value.
The Best and Worst Funded Pension Plans in the U.S.
Public pension plans in the U.S. are available to a wide range of workers. Teachers, state and city employees, public safety officers, public utility staff, wildlife conservation officers, and more have the opportunity to collect a pension. The United States has promised at least $6.6 trillion in future retirement benefits to the members of the largest 228 public retirement systems. But nationally, the U.S. has only set aside $5.1 trillion to pay those benefits.
This means there is a national public pension funding shortfall of around $1.49 trillion, as of June 30, 2023 (formally this shortfall is called unfunded liabilities. Collectively that is just 77.4% of the money that should be in state and local pension funds today (and this percentage is called the funded ratio.
Together, unfunded liability and funded ratio metrics help reveal the best and worst funded pension plans in the United States. We have aggregated the various pension plans in each state to create the following list of pension unfunded liabilities by state.
What do Unfunded Liabilities Mean for State Pension Plans?
There can be a wide range of funded ratios for different pension plans within states. For example, California has an average funded ratio of 79.1%. However, individual plans might have a different story. San Francisco City & County Employees' Retirement System is 98.9% funded. On the other hand, judges' Retirement System 1 depends on state legislature to pay for its benefits each year.
The dollar amount of unfunded liabilities is typically also dependent on the size of a state’s public workforce and economy. States like Texas and Florida have large dollar valued unfunded liabilities. This is because their state and local pension systems have struggled and also because they are simply very large states.
A helpful way to understand how much of a problem state pension unfunded liabilities are is to compare them to each state’s economy. And a common measurement of state economic activity is state GDP, or gross domestic product. Below is a chart that shows how the funded status of all 50 states stack up against their economic output.