Data
Pension Debt Relative to State Economies: Comparing Unfunded Liabilities to GDP
Comparing unfunded liabilities to gross domestic product (GDP) can be a better way to think about the scale of a state’s pension debt than looking at the dollar figure alone.
Why? Because it tells us how easy or difficult it might be for the government to backfill the state’s pension funding shortfall and eliminate the debt.
Pension Debt Versus State GDP
Pension debt varies greatly between states. For example, let’s compare California and Connecticut.
According to Equable calculations as of June 30, 2026, California has the highest unfunded liabilities of any state at $264.1 billion. That’s about eight times greater than Connecticut’s $33.0 billion of pension debt.
However, when compared to each state’s GDP, the rankings reverse. This is because California’s GDP is an enormous $4.0 trillion, and Connecticut’s GDP is a relatively small $356.8 billion. When both are factored together, California’s pension debt as a percentage of state GDP is 6.52%, while Connecticut’s is 9.26%.
This shows that the metric of unfunded liabilities on its own doesn’t give the full picture of a state’s pension debt issue. While it can show how large a state’s pension debt is, it doesn’t take into account the size of the economy that is meant to support it.
Since state and local governments pay down unfunded liabilities using contributions funded by tax revenue, comparing a state’s pension debt to its economic output provides an estimate of its debt burden relative to its ability to collect tax revenue.
The greater a state’s pension debt is as a percentage of its economic output, the harder it is for the government to bring its funded ratio back to 100%.
Pension Debt as a Percentage of GDP by State
The map below shows where each state stands on a pension debt versus GDP basis.
Hover over any state to see its unfunded liabilities as a percentage of GDP, unfunded liabilities in dollars, funded ratio, and state GDP in dollars.
Funded Ratio Versus Pension Debt as a Share of State GDP
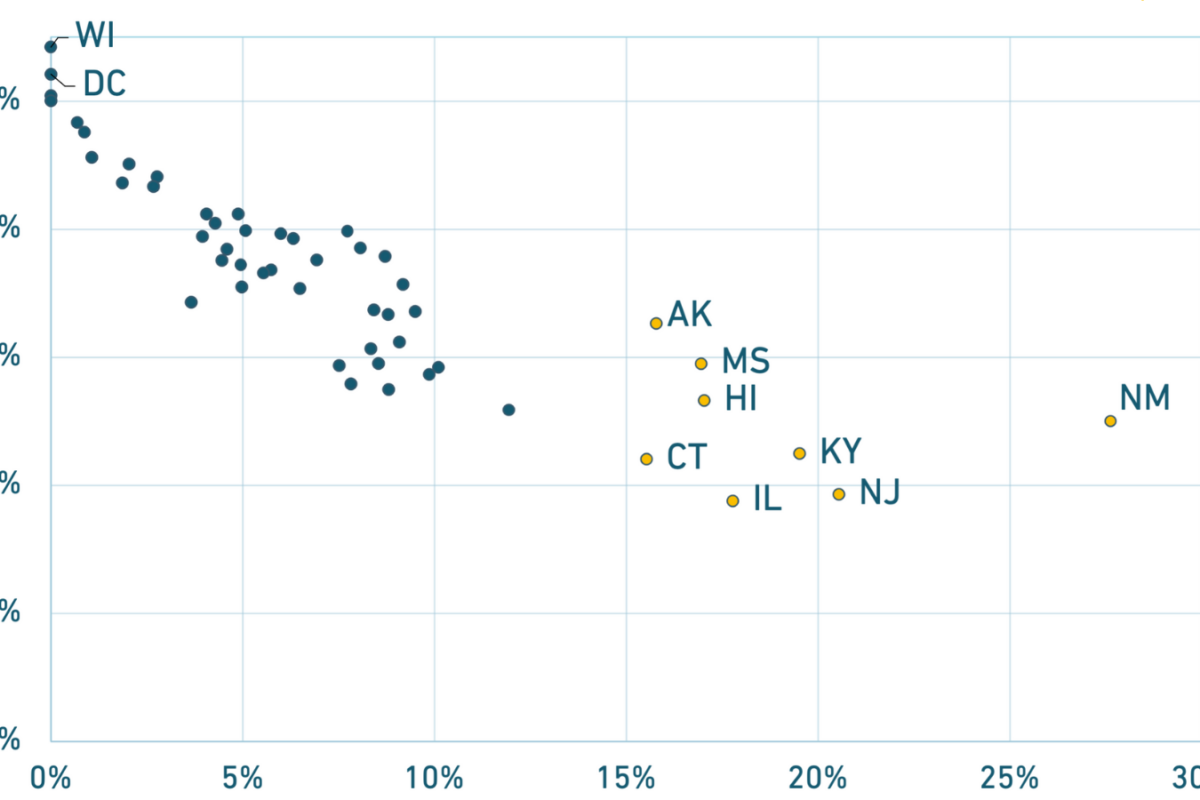
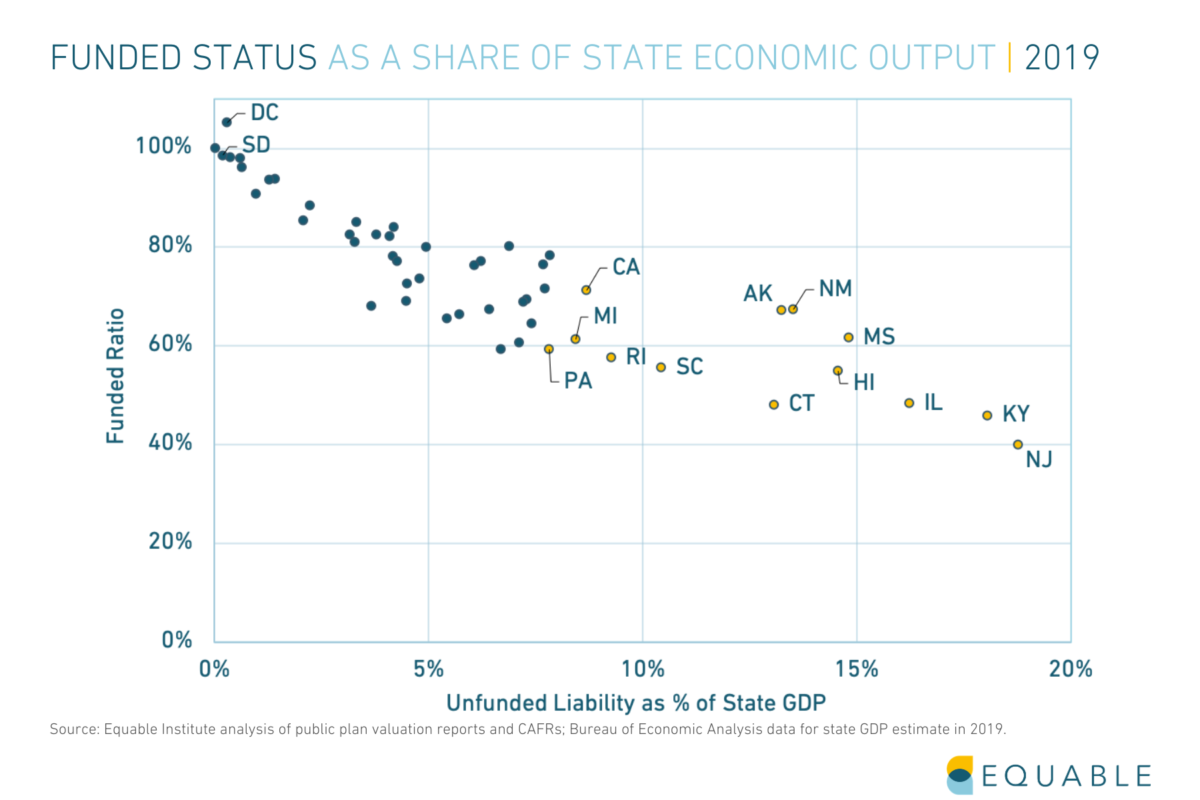
The relationship between a state’s funded ratio and its unfunded liabilities as a share of its economy reveals four distinct fiscal positions.
- High Debt/Poorly Funded: The combination of high pension debt-to-GDP with low funding means liabilities compound faster than assets recover. The path to recovery requires major measures, such as legislative change, large supplemental contributions, or benefit modification.
- Low Debt/Well Funded: The pension shortfall is a manageable share of state GDP. These states have structural resilience. The risk here is complacency, as confidence erodes discipline on assumptions or funding policy.
- Low Debt/Poorly Funded: A pension shortfall exists, but the state has capacity to address it. The path to recovery is sustained political will on contributions, plus modest assumption improvements — a few disciplined years can move these states to the top-left quadrant.
- High Debt/Well Funded: No state currently holds this position. Generally, high debt and strong funding don’t coexist.
Twenty-seven states plus Washington, DC, are well funded with manageable debt, while 17 states have underfunded plans but economies large enough to address the problem with sustained policy effort.
Six states face the worst combination: below 80% funded and unfunded liabilities exceeding 10% of GDP. These states — Illinois, Kentucky, New Jersey, Mississippi, Hawaii, and New Mexico — face structural fiscal pressure that market returns alone cannot resolve.
- Illinois: 18.2% of GDP, 53.5% funded
- Mississippi: 16.0% of GDP, 58.4% funded
- Hawaii: 12.5% of GDP, 62.9% funded
- Kentucky: 12.4% of GDP, 57.6% funded
- New Mexico: 11.9% of GDP, 68.2% funded
- New Jersey: 11.8% of GDP, 53.5% funded
Two states, Alaska and Connecticut, have also struggled with their unfunded liabilities relative to the size of their state economies. While not in the most distressed quadrant, they are near the borderline.
- Alaska: 9.1% of GDP, 74.2% funded
- Connecticut: 9.3% of GDP, 64.9% funded
Limits of Comparing Pension Debt to GDP
While a larger state GDP might mean a larger tax base, it is not the same as state revenue or the budget. Not only does GDP include economic activity that states cannot or do not tax, such as a federal government operations or income earned by out-of-state firms, states are also drastically different when it comes to how they generate tax revenue.
Additionally, the pension debt figures combine statewide and municipal plans in each state. Since local governments are often responsible for the debt of their own pension plans, the combined amount for a particular state may not match the obligation of the state government.
Nonetheless, comparing unfunded liabilities to state GDP still paints a much better picture of a state’s pension plan finances than unfunded liabilities alone.