U.S. public pension plan funded ratios at the end of 2022 reflect a challenging year. The 2022 calendar year was not a great time to be managing pension fund assets. A few hedge funds and money managers successfully navigated the choppy and volatile investment waters of 2022. However, most lost money. Some lost a lot of money.
The investment losses in 2022 didn’t wipe out all the funded status gains from 2021. Unfortunately, this year has – yet again – exposed the lack of resilience plaguing many public pension plans.
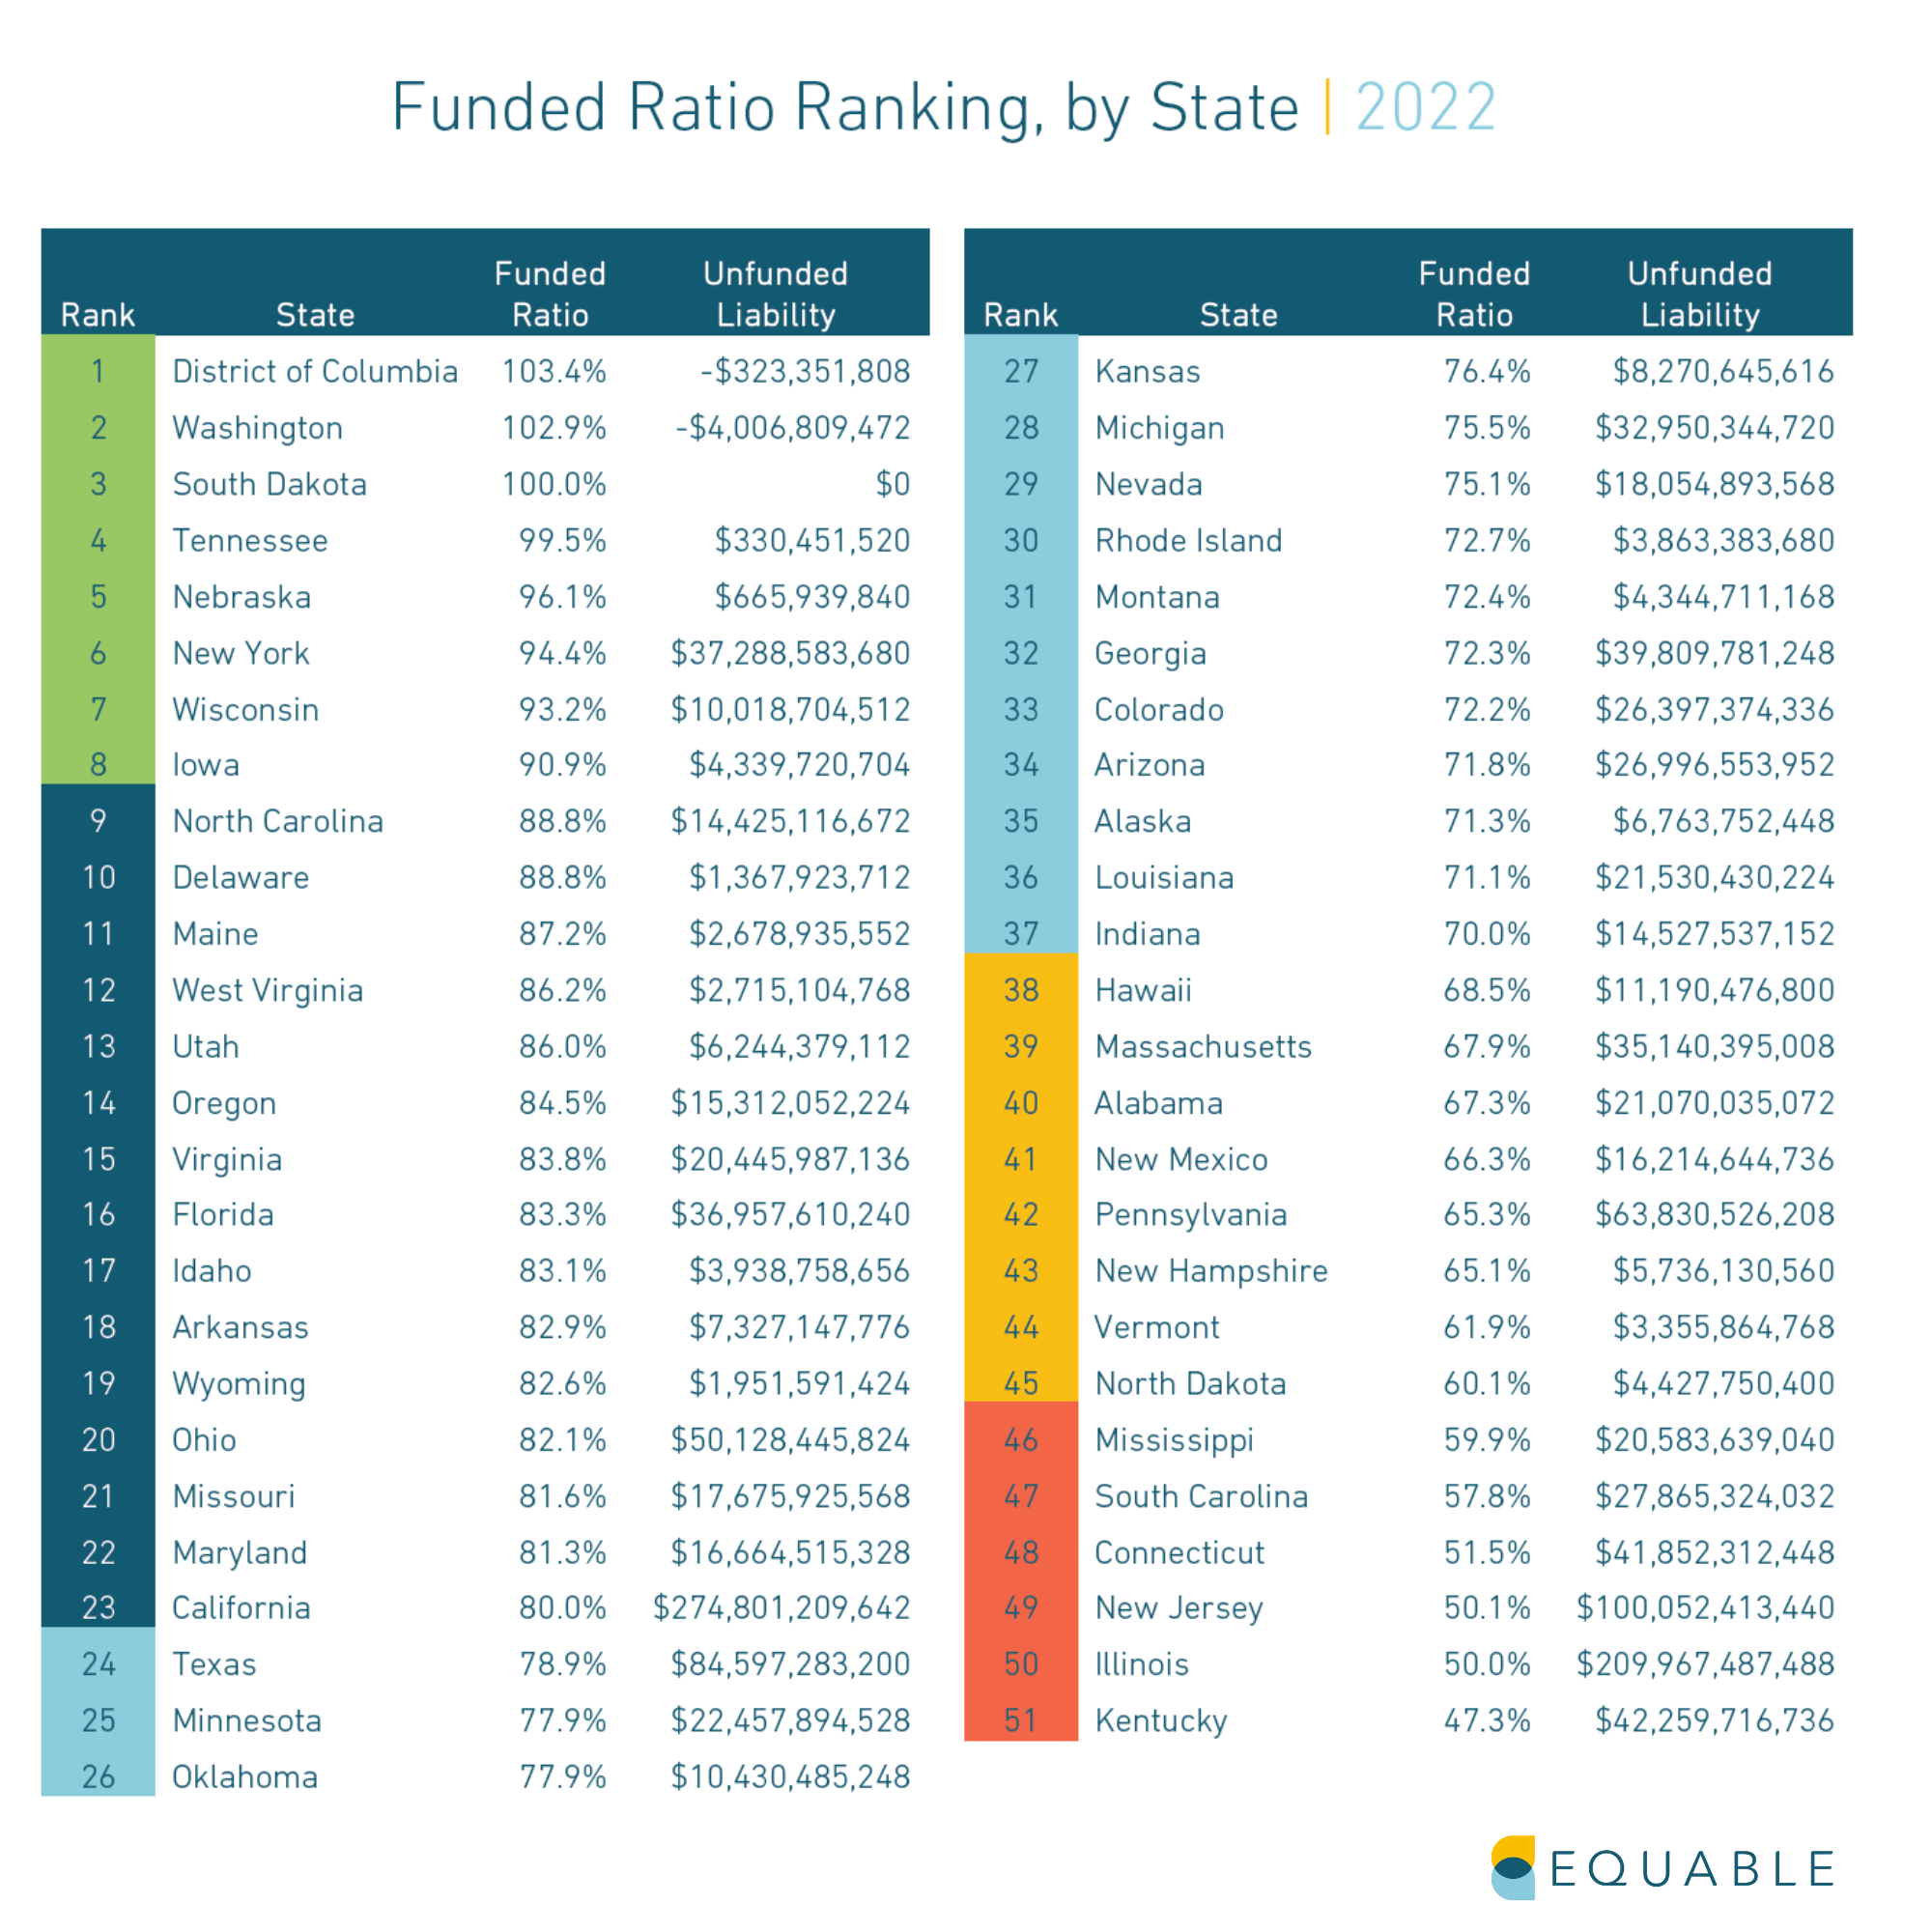
Once all public pension plans release their 2022 data, we estimate that unfunded liabilities will be $1.45 trillion. The combined funded status for the top state and local retirement systems will be 77.3%, based on available data through December 31, 2022. This is down from the 83.9% funded ratio during fiscal year 2021.
There’s no question that the aggregate funded status for public pension plans is mediocre. But, funded ratios and unfunded liabilities vary widely across states and plans. Below, we look at public pension funded ratios ranked by plan and by state.
State of Pensions 2022 Year End Update | State Funded Status Rankings | Plan Funded Status Details PDF
The Top 10 Plans by Funded Status for 2022
There are some common themes among the best funded pension plans as of fiscal year 2022. Recently designed plans with cost-sharing components, plans with risk-sharing tools, and legacy plans with a multi-decade history of strong funded status all fared well.
| Rank | Plan Name | Funded Ratio | Unfunded Liabilities | Notes |
|---|---|---|---|---|
| 1 | Washington LEOFF Plans 1 & 2 | 126.60% | 5586311168.0000 | These two pension plans have both been around 100% funded or better since the 1990s. |
| 2 | Michigan PSERS Pension Plus Plans 1 & 2 | 121.70% | 317528608.0000 | These are risk-sharing hybrid plans. The Pension Plus Plan opened to new members in July 2010. The PPP2 was created for members starting February 2018 with a 6% max assumed return and 50/50 cost-sharing rules. |
| 3 | Tennessee Teachers Hybrid Plan | 119.50% | 116868544.0000 | This is the hybrid plan for Tennessee teachers that launched in July 2014. |
| 4 | Detroit Police & Fire Component 1 | 112.80% | 31286768.0000 | This is a new hybrid plan created for members hired since July 2014 (about a quarter of members) |
| 5 | Tennessee Teachers Legacy Plan | 109.50% | 2639685632.0000 | This is a legacy pension plan in Tennessee that closed to new members since 2014. |
| 6 | New York City Board of Education | 108.90% | 540272128.0000 | This is a pension plan for board of education officials. |
| 7 | D.C. Police and Fire Plan | 107.70% | 506743808.0000 | This pension plan has been considered fully funded for the past several decades. |
| 8 | Nebraska PERS Cash Balance Plan | 107.40% | 149662848.0000 | This is a guaranteed return plan that has been open to new members since January 2003. |
| 9 | Arizona PSPRS Tier 3 | 107.20% | 10855456.0000 | This is a risk-sharing pension plan that was created for new public safety members as of July 2017. |
| 10 | Washington PERS Plans 2 & 3 | 106.70% | 3708780544.0000 | These are a pension and hybrid plan that employees are offered a choice of membership in when joining. |
The Bottom 15 Plans by Funded Status for 2022
The worst funded pension plans are largely from Illinois, New Jersey, Connecticut, and Kentucky. Among the worst are a few plans funded on a pay-as-you-go basis. Here are the 15 worst pension plans by funded ratio.
| Plan Name | Funded Ratio | Unfunded Liabilities | Notes |
|---|---|---|---|
| Illinois JRS | 46.60% | 1666196736.0000 | Illinois pension plan. |
| Connecticut SERS | 45.60% | 22124845056.0000 | |
| Chicago Teachers | 45.30% | 14190124032.0000 | Illinois pension plan. |
| Illinois SERS | 43.50% | 33301098496.0000 | Illinois pension plan. |
| Chicago Laborers** | 42.90% | 1706322304.0000 | Illinois pension plan. |
| Illinois TRS | 42.80% | 83840331776.0000 | Illinois pension plan. |
| Dallas Police and Fire* | 42.20% | 3041735168.0000 | |
| New Jersey Teachers Pension Annuity | 37.40% | 47929602048.0000 | |
| Arizona Elected Officials | 32.00% | 675132992.0000 | This plan was not fully funded after it was closed to new members. |
| Indiana Teachers Pre-96 Plan | 28.40% | 10067401216.0000 | This plan is using a pay-as-you-go funding model. |
| Chicago Municipal* | 26.70% | 13920710144.0000 | Illinois pension plan. |
| Chicago Police** | 25.50% | 12548566272.0000 | Illinois pension plan. |
| Chicago Firemen* | 23.20% | 5527219072.0000 | Illinois pension plan. |
| Kentucky ERS | 21.70% | 13774859520.0000 | |
| California JRF | 1.30% | 2497050538.0000 | This plan is using a pay-as-you-go funding model. |
*Estimate based partially on reported preliminary returns and partially on asset allocation and benchmark returns.
**Estimate based on asset allocation and benchmark returns.
2022 Funded Status by State