
The funded status for state and local pension plans improved in 2025 thanks to another year of solid financial market performance and record high contribution rates. Yet, public pension plans are still in a fragile financial condition. Between 2024 and 2025, the average national funded ratio increased from 78% up to 82.5%, though unfunded liabilities remained elevated at $1.3 trillion.
This marks 19 consecutive years with an average funded ratio below 90%, the minimum threshold for pension plans to be considered resilient.
Last year’s 9.5% average investment return was better than the average assumed rate of return used by public plans (6.9%), but it was less than the performance of most major public equity indices. Generally, this is attributable to strong equity market returns at a time when global markets reached record highs. For example, the S&P 500 stock market index notched a total return of 17.9% for the 2025 calendar year, even in the face of significant market volatility and recession risks.
There’s no question that the aggregate funded status for public pension plans, while improved, is still mediocre. At the state and plan level, however, funded ratios and unfunded liabilities vary widely.
The Top 15 Plans by Funded Status for 2025
The best-funded pension plans in our pension plan funded ratio rankings, as of fiscal year 2025, have a few things in common. Recently designed plans with cost-sharing components, plans with risk-sharing tools, and legacy plans with multi-decade histories of strong funded status all fared well.
More than half of the top 15 plans by funded status are from just three states: Michigan (three plans), Tennessee (three plans), and Washington (two plans).
Many of the plans also appeared on our 2024 list, including the top two (Washington LEOFF Plan 1 and Michigan PSERS PPP2). A 2025 newcomer (Colorado FPPA) rounded out the top three.
Also new to the list for 2025 are California JRF II, Oklahoma PERS and Tennessee PERP.
The Bottom 15 Plans by Funded Status for 2025
Many of the worst-funded plans on this year’s pension plan funded ratio rankings list were also in 2024’s ranking.
For example, Illinois plans occupy nine of the bottom 15 spots, unchanged from last year, while select plans from Arizona, New Jersey, and Kentucky also appear for another consecutive year. The California Judges’ Retirement Fund, funded on a pay-as-you-go basis, is the worst-funded plan.
The average funded ratio for the bottom 15 plans was largely unchanged year over year, coming in at 37.2% in 2025 versus 37.3% in 2024. However, while all of the bottom 15 plans fall into the “distressed” (below 60%) category in terms of funded status, some of the worst-funded plans did show improvement.
Kentucky ERS NH, for example, was just 26.7% funded in 2024 versus 31.2% funded in 2025. Meanwhile, the funded ratio for the Chicago Teachers plan improved from 43.3% in 2024 to 49.2% in 2025. Several other plans also showed mild improvements.
Pension Plan Funded Ratio Rankings by State
As noted previously, funded ratios and unfunded liabilities vary widely between states. While a handful are “resilient,” the majority fall into either the “fragile” or “distressed” categories.
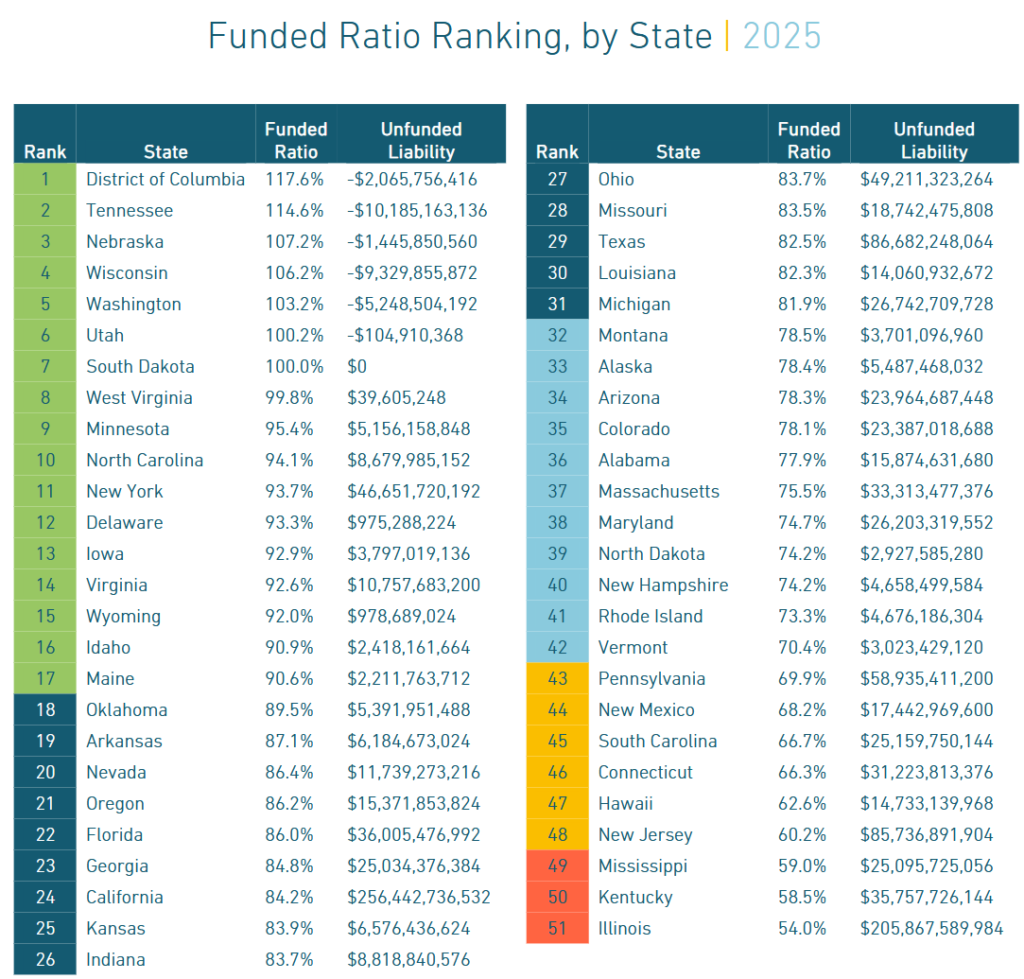
Note: Data for each state include statewide plans and large municipally managed plans (those with at least $1 billion in liabilities). Negative unfunded liability numbers indicate “overfunded” status for the fiscal year.
In 2025, seven states plus the District of Columbia have funded ratios of 100% or above. We consider these to be resilient as of the latest data, and plans from many of these states appear on our top 15 list above.
Ten states have funded ratios between 90% and 99.9%, 14 states are between 80% and 89.9% funded, 11 states are between 70% and 79.9% funded, and six states are 60% to 69.9% funded. We classify the states in this range as fragile.
On the bottom of the list are Mississippi, Kentucky, and Illinois, which are considered distressed with overall funded ratios below 60%.
All Plans Ranked by 2025 Funded Status
Curious where a particular plan ranks overall among all of the plans in our database? Use the search function in the table below or scroll through each page to find the assets, liabilities, and funded ratio for your plan.