Unfunded liabilities for state and local pension plans dropped from $1.37 trillion in 2025 to $1.13 trillion (estimated) in 2026. This is the lowest level for national unfunded liabilities since 2021, when the total shortfall was $1.0 trillion.
At the same time, the national funded ratio average improved from 81.2% in 2025 to 85.0% (estimated) in 2026. This marks the fourth consecutive year of funded status gains, though the national average is still below 2007’s 93.4% figure, nearly two decades after the Global Financial Crisis.
Equable Insights
All figures are 2026 estimates.
- Total unfunded liabilities for state and local pension plans: $1.13 trillion
- National funded ratio average: 85.0%
- Best funded ratio: Washington, D.C. (111.7%)
- Worst funded ratio: Illinois (56.3%)
2026 Funded Ratios by State
Equable Institute estimates as of June 30, 2026, show that the District of Columbia, Nebraska, Tennessee, Washington, South Dakota, Wisconsin, and West Virginia have the best average funded ratios across the United States. Each of these states (plus the District of Columbia) is over 100% funded, meaning their assets are greater than their liabilities.
The states with the worst average funded ratios are Illinois and New Jersey. With funded ratios of 56.3% and 56.7%, respectively, these states are considered Distressed (below 60% funded). Kentucky and Mississippi are also near the bottom of the list, though they improved from Distressed funded status in 2025 to Fragile (60% to 90% funded) in 2026.
However, some states carry a larger share of pension unfunded liabilities (or pension debt) than others. Looking at total unfunded liabilities in terms of dollars rather than percentages, Illinois, California, New Jersey, and Texas have the highest levels of pension debt among all states.
2026 Unfunded Liabilities by State
Public pension plans in the U.S. are available to a wide range of workers. Teachers, state and city employees, public safety officers, public utility staff, and more have the opportunity to collect a pension.
The U.S. has promised at least $7.55 trillion in future retirement benefits to the members of the largest 253 public retirement plans (those with liabilities of $1 billion or more). But nationally, the U.S. has only set aside $6.42 trillion to pay those benefits.
This means there is a national public pension funding shortfall (unfunded liability) of around $1.13 trillion, estimated as of June 30, 2026. Collectively, that is just 85.0% of the money that should be in state and local pension funds today (funded ratio).
2026 Public Pension Funded Status by State
Together, unfunded liability and funded ratio metrics help reveal the best and worst states in terms of funded status. We have aggregated the various pension plans in each state to create the following list of pension funded status by state.
What Do Unfunded Liabilities Mean for State Pension Plans?
There is a wide range of funded ratios for different pension plans within states. For example, California has an average funded ratio of 88.8%. However, individual plans might have a different story. San Francisco City & County Employees’ Retirement System is 94.7% funded. On the other hand, Judges’ Retirement System 1 depends on state legislature to pay for its benefits each year.
The dollar amount of unfunded liabilities is typically also dependent on the size of a state’s public workforce and economy. States like Texas and California have large dollar-valued unfunded liabilities. This is because their state and local pension systems have struggled and also because they are simply very large states.
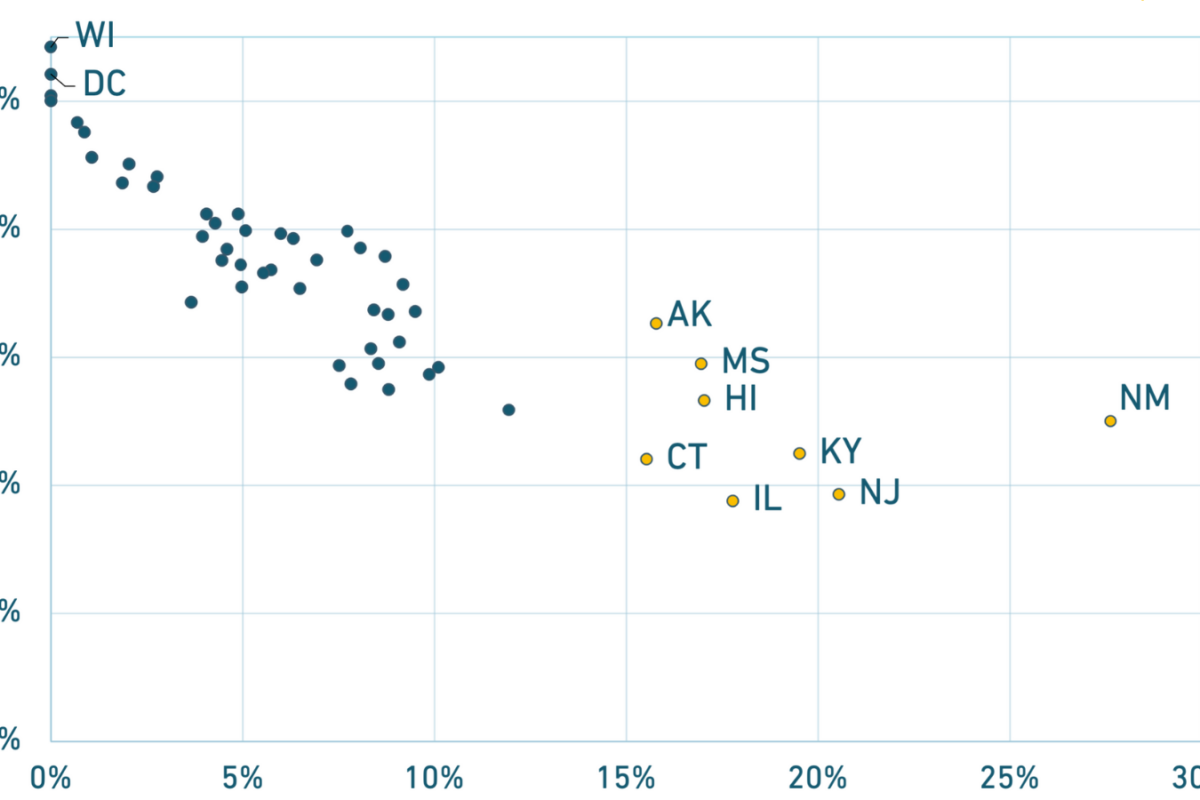
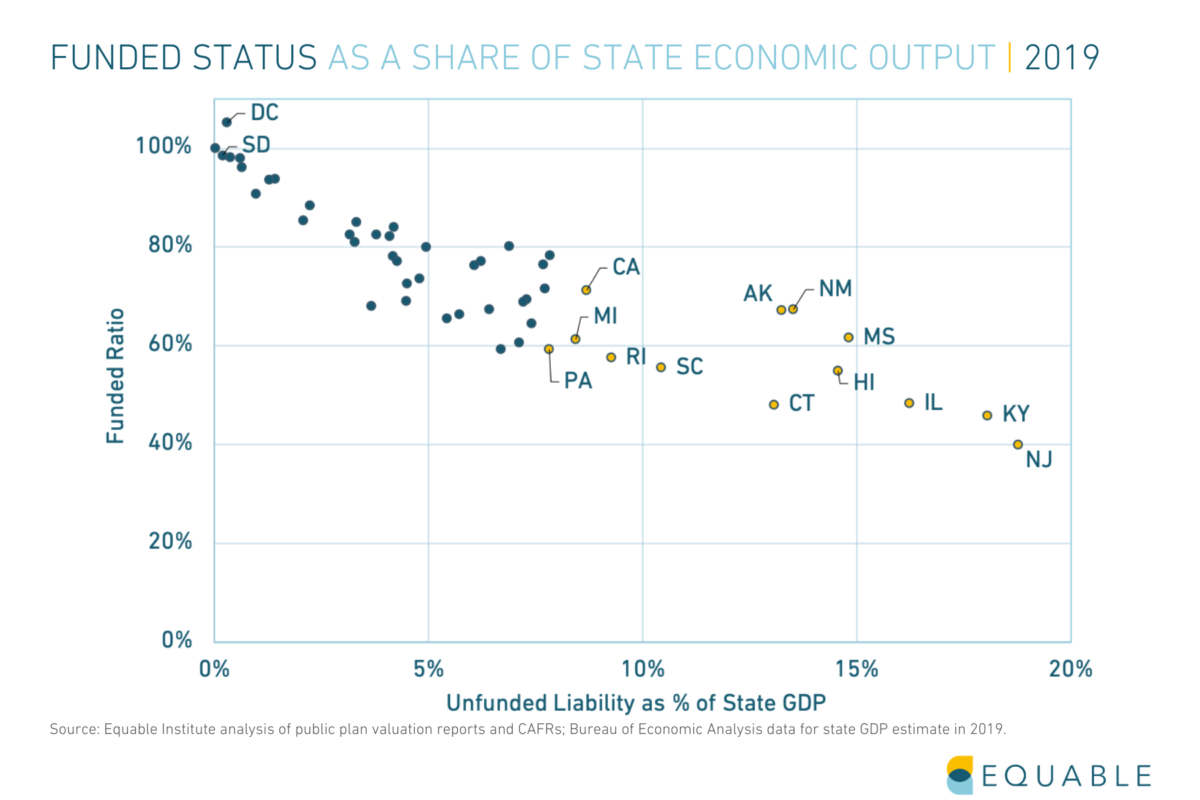
A helpful way to understand how much of a problem state pension unfunded liabilities are is to compare them to each state’s economy, commonly measured using state GDP, or gross domestic product. Below is a chart that shows how the funded status of all 50 states (plus Washington, D.C.) stacks up against their economic output.
Notes
- The data in this article come from Equable Institute’s “State of Pensions 2026.” The list of states is based on Equable estimates of public pension plan finances through June 30, 2026. The chart of state funded ratios and GDP is based on fiscal year 2025 data because there is not yet sufficient state economic data for 2026. See the full report for methodological details. The 253 state and local pension plans in this analysis account for over 90% of all public pension plan assets in the U.S.
Frequently Asked Questions (FAQs)
Funded ratio is calculated by dividing a pension fund’s assets by its promised benefit payments (liabilities). It can be calculated for a state as the whole or for the various individual plans within the same state.
For example, a plan with $10 billion in assets and $10 billion in promised benefits is considered 100% funded. A plan with just $5 billion in assets and $10 billion in promised benefits is 50% funded.
Unfunded liabilities are calculated by subtracting a pension fund’s assets from its promised benefit payments. Instead of a ratio, the unfunded liabilities measurement looks at the difference between assets and liabilities in terms of dollars and cents.
For example, a plan with $10 billion in assets and $10 billion in promised benefits is fully funded and has unfunded liabilities of $0. A plan with just $5 billion in assets and $10 billion in promised benefits has $5 billion in unfunded liabilities (pension debt).