Tier 5 was Adopted in Mississippi. What Should Happen Next?
With $26 billion in unfunded liabilities and inadequate benefits for workers, it is undeniable that Mississippi needs to improve how it manages the Mississippi Public Employees Retirement System (PERS) and the benefits this system offers to teachers, state and local employees, and public safety across the state. But if the legislature does not act before the end of their next session, they will miss their current window of opportunity to save PERS from debilitating pension debt, inadequate benefit design, and the risk of becoming insolvent in the coming decades.
In fact, the Mississippi Legislature has already missed two opportunities to make necessary changes that fix PERS. First, in 2024, the legislature voted to increase contributions into PERS, but not up to a level sufficient to prevent interest from accumulating on the debt or to cover the costs of lowering their assumed rate of return on investments.
Then, in March 2025, the legislature ignored the need to complete their changes to contribution rates and funding policy. Instead the legislature tweaked benefit design in a way that slightly improves portability for short-term workers while stripping future career public employees of inflation protected benefits.
The new benefit design calls for a “hybrid” retirement plan that would blend a small pension with a small individual defined contribution account for each PERS member. In theory, hybrid plans can be well structured ways to create a path to retirement income security. However, the adopted Tier 5 design uses all of the funding policy rules that got PERS into its fiscal distress in the first place. The version adopted by the legislature does nothing to address the retirement system’s funding shortfall — and because the benefit terms offer no inflation protection the package as a whole would it be a net negative for workers’ benefits, according to our recent analysis.
This decision to adopt a poorly designed “Tier 5” for PERS has narrowed the timeframe in which policymakers can get Mississippi’s statewide pension fund on a road to financial sustainability. But either during a special session in 2025 or the normal spring 2026 session, the legislature could take actions that improve the benefit design structure of Tier 5 before it gets fully implemented. And at the same time the Mississippi Legislature could direct the PERS board to adopt better funding policy rules related to this new tier of benefits.
To be clear, this doesn’t mean the ideas or intent behind the legislature’s hybrid initiative are misguided. Modernizing benefit designs and improving funding policy are critical for PERS — which is among the worst funded state pension plans in the country. But it’s important to ensure that the proposed solutions to these problems actually address their root causes and ensure that they don’t reoccur in the future. And unless actions are taken in the coming months, the currently designed Tier 5 “hybrid plan” for PERS is going to be implemented that doesn’t solve PERS funding problems and makes benefits worse for career public employees.
The following is a roadmap for what additional changes are necessary in Mississippi to take advantage of this moment in order to improve PERS for all and prevent PERS pension debt from becoming a further fiscal strain on the state.
Why Mississippi PERS Needs Improvement
Mississippi PERS needs improvement for two primary reasons. The first is that PERS benefits are not adequately providing a path to retirement security for most workers. The second reason is that PERS is critically underfunded.
When it comes to retirement benefits, Mississippi PERS is not serving most workers very well. Most public employees enrolled in PERS don’t work long enough to qualify for a pension and many of those who do aren’t on a path to retirement security. In fact, more than 4 in 5 workers will receive a benefit of less than $1,800 per year. According to our analysis, only workers with more than 20 years of service are served well by the current retirement plan, and this accounts for just 10% of the workforce.
Looking at funding, Mississippi PERS faces a significant shortfall. It is currently 55.9% funded with $26 billion in unfunded liabilities as of 2024. Part of that shortfall was caused by past experience, like underperforming investments or taking too long to adopt safer actuarial assumptions. But, another part of the unfunded liability comes from a failure to ensure that large enough contributions are paid every year to cover the full principal and interest payments on PERS pension debt.
Fortunately, there are a range of proven best practices that can be integrated into the PERS legislation to ensure Mississippi accomplishes both its retirement security and funding goals. Below, we look at concrete policy steps the Mississippi legislature could take to ensure the financial health of both PERS and the state’s public workers.
What to Improve #1: Mississippi PERS Needs a Plan to Pay Down the $26 Billion Funding Shortfall Responsibly
Right now, the state is trying to keep budget costs low by prescribing a fixed amount of money to be put into PERS each year. But it is not enough money to keep PERS pension debt from growing, and the pension plan’s actuaries say that more should be paid. The most responsible way to pay down a funding shortfall is to use “actuarially” determined contribution rates that are based on a plan to get the debt paid off in 20 years or less instead of legislator-set contribution rates that are based on politics.
The hybrid plan adopted in Mississippi’s income tax bill relies lower overall retirement benefit costs and fewer future liabilities as the path to preventing future growth of unfunded liabilities. However, our research shows that benefit changes alone do very little to prevent the growth of unfunded liabilities. Without a plan to inject more money into the system to address this problem, it is likely the shortfall facing Mississippi PERS would continue to grow.
What to Improve #2: Mississippi PERS Needs to Adopt Realistic Investment Assumptions
One way states determine how much they need to pay into the retirement system to prevent shortfalls from growing is by estimating how much the plan’s investments will make on a yearly basis. This is called the assumed rate of return, also known as an investment assumption.
Currently, the Mississippi legislature assumes its investments will yield a 7% return. However, there’s only a 45% likelihood they will be able to earn that much, meaning the legislature is underestimating its yearly contributions, allowing the debt to snowball.
The changes adopted this session use these same, outdated assumptions and amortization methods that got PERS into its current fiscal mess. But, if the legislature wanted to make a serious attempt at improving future funding levels, they could follow the example of Michigan which adopted a new hybrid tier of benefits that had its own 6% maximum investment assumption. All they would need to do is pass a law saying that when the PERS board implements the new Tier 5 that they have to use a rate at 6% or less.
Technically, the Mississippi PERS board could use their own authority to make this decision on their own—and they should if direction isn’t going to come from the legislature.
Without applying improvements to the new benefit tier, even the hybrid plan proposed by the Senate runs the risk of accumulating pension debt in the coming years and driving up future costs for workers and taxpayers.
What to Improve #3: The Mississippi Legislature Must Ensure that All Workers Continue to Have Inflation Protected Benefits
There have been reductions to pension benefits in the past, such as when Mississippi introduced Tier 4 to replace Tier 3. But even those benefit changes didn’t take away cost-of-living adjustments (COLA) that aim to help pension benefits keep up with inflation (this inflation adjustment is commonly referred to as the “13th check” in Mississippi). If the purchasing power of pension benefits erodes over time it’s not really guaranteed retirement security.
The plan proposed under SB2439 and adopted in Mississippi’s 2025 tax bill eliminated the COLA (i.e., 13th check) for future workers, putting the retirement security of thousands of workers in jeopardy. But the legislature can amend Tier 5 before it is implemented to restore some degree of inflation protection in the form of a COLA, even if the specific COLA rules are different from Tier 4.
What to Improve #4: Mississippi Must Ensure All Workers Have Access to a Path to Retirement Security
The simple truth is the current PERS pension plan design doesn’t work well for workers with less than 10 years of service, who account for 84% of all those enrolled in the retirement system. And the legislature’s one-size-fits-all Tier 5 hybrid would similarly fail to ensure all workers have a path to retirement income security.
Luckily, there are many ways to address this with smart and flexible retirement plan design decisions.
For example, the legislature could introduce a choice-based system that includes a plan designed for short-term workers (like a defined contribution plan) to go alongside the current Tier 5 hybrid plan. And a choice could be added such that workers in either plan design are allowed to switch once during their careers. There are more than half a dozen states with such options, including nearby Florida and South Carolina.
PERS doesn’t have to be one-size-fits-all.
The Bottom Line
Mississippi should adopt the following changes:
- Increase contributions into Mississippi PERS up to a level that is both paying at least 100% of the actuarially required contribution and is also ensuring that there is no interest accumulating on unfunded liabilities each year.
- Meeting these goals will need increasing contributions as a percentage of payroll and getting pension debt paid off faster.
- Ideally, lower the assumed rate of return for all of PERS to a number below 6.5%. But if that is not feasible then the PERS board should at the very least start the new Tier 5’s benefit portion with a lower assumed rate of return.
- When Michigan created a second hybrid plan in 2018 their legacy pension fund was using a 7.5% assumed return, but their new hybrid plan started with a 6% assumed return.
- Adjust the Tier 5 structure to add a COLA. For example, paying a COLA equal to CPI up to 3% on a compounding basis.
- Add a second retirement plan choice that has more portability, such as a defined contribution plan.
Effective reforms balance fiscal responsibility with providing a path to retirement income security for all public employees. Any solution that substantially reduces benefits for career employees, shifts virtually all costs of retirement benefits onto future workers, while eliminating inflation protection fails to maintain this essential balance. The Mississippi legislature would be doing the state a disservice if it failed to address anyone of these issues.
Mississippi Senate Bill 2439: Retirement Security Policy Scorecard
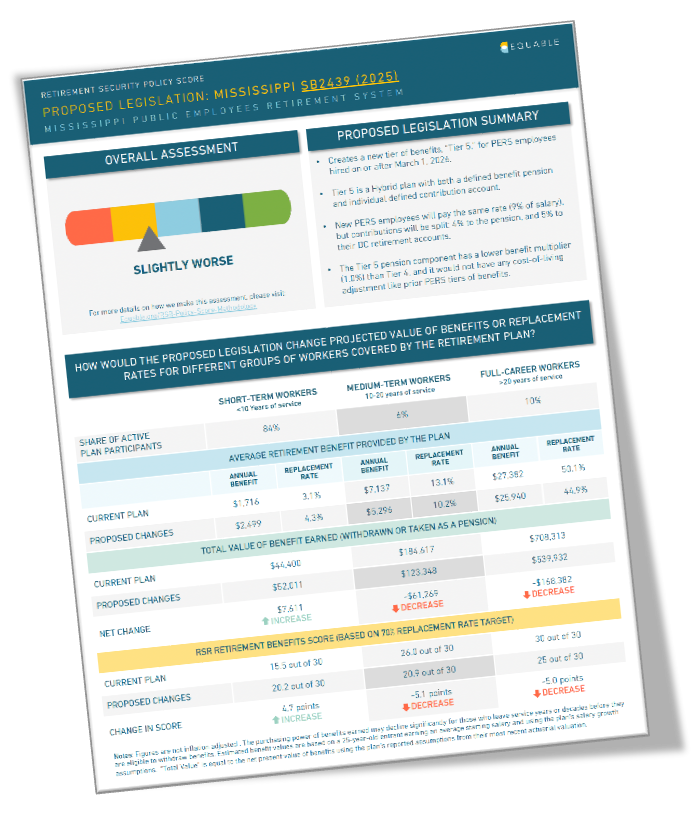
Mississippi is considering changes to its retirement plan provisions for the Mississippi Public Employees Retirement System (MSPERS), as presented in Senate Bill 2439. The bill, which passed the Senate in mid-February, would replace the current “Tier 4” pension plan offered by MSPERS with a “Tier 5” hybrid plan that combines a defined benefit pension and individual defined contribution account for employees hired on or after March 1, 2026.
Equable Institute has analyzed the proposed changes in Mississippi Senate Bill 2439 using Retirement Security Report methodology, finding that Tier 5 as proposed in SB2439 is slightly worse overall for workers than the currently available Tier 4 pension plan. While workers with less than 10 years of service would see modest increases to their retirement benefits, the bill would result in significant losses for the longest-tenured employees (-$168,382 on average for workers with more than 20 years of service), while also failing to address the underlying fiscal sustainability challenges facing MSPERS.
DOWNLOAD THE SCORECARD
EQUABLE INSTITUTE’S ANALYSIS OF MISSISSIPPI SENATE BILL 2439
Positive Elements of the Proposed Changes in SB2439:
- The introduction of a partial defined contribution plan makes retirement benefits more portable for members who won’t remain enrolled in PERS for their whole career. The PERS board has adopted assumptions that suggest more than 4 in 5 public workers in Mississippi work fewer than 10 years, meaning this improvement could help many future workers covered by PERS.
- The benefits for Short-Term Workers (who work 10 years or less) are more generous than those offered by the current Tier 4 pension. The annual benefit is almost 50% larger and the total benefit value is more than $7,500 higher. Because this is overwhelmingly the largest segment of PERS members, Tier 5 would be a better fit for today’s more mobile workforce.
- While the proposed benefits for Medium-Term Workers (who work 10 to 20 years) and Full-Career Workers (who work 20+ years) are less than Tier 4, they are still enough that, when combined with Social Security, they will still provide a secure retirement benefit to PERS members that replaces more than 70% of pre-retirement income.
- The costs of providing Tier 5 benefits are substantially lower than the current plan offerings, which is an important consideration for a plan that was only 55.8% funded with $26 billion in unfunded liabilities in 2023. Tier 5 would be less likely to see costs rise moving forward.
Neutral Elements of the Proposed Changes in SB2439:
- Social Security benefits are estimated to replace 50% or more of PERS employees’ salaries in retirement and, when combined with the PERS benefits, Tier 5 members can still experience total replacement rates above 90%, well above the 70% target identified by Social Security and private retirement providers.
- Tier 5 increases the service requirements for early and normal retirement (which will affect some future workers), but leaves the normal retirement age at 65 which is still lower than Social Security.
Negative Elements of the Proposed Changes in SB2439:
- The elimination of inflation protection through a COLA is a significant reduction in the value of benefits from Tier 4 to the proposed Tier 5. This reduces the total value of benefits and means retiree income will be susceptible to the decay of inflation over time.
- While the costs of Tier 5 are lower than Tier 4, nearly all of the costs will be paid for by members while the vast majority of future employer contributions to PERS will just be for paying down legacy pension debt. This effectively means future worker benefits are being lowered to make it more affordable for the state to pay for unfunded liabilities.
- Tier 5 would mean a substantial reduction in the benefits earned by Medium-Term Workers and Full Career Workers. As the table shows, total benefits would be reduced by over $60,000 for Medium-Term Workers and more than $160,000 for Full Career Workers.
Pension Plan Funded Ratio Rankings 2024
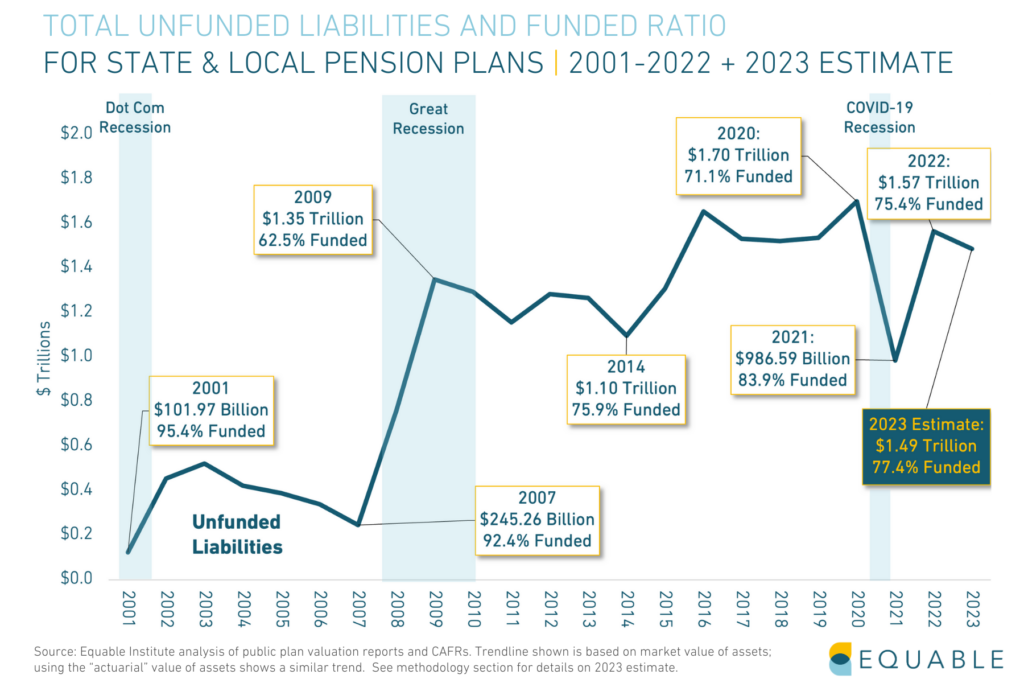
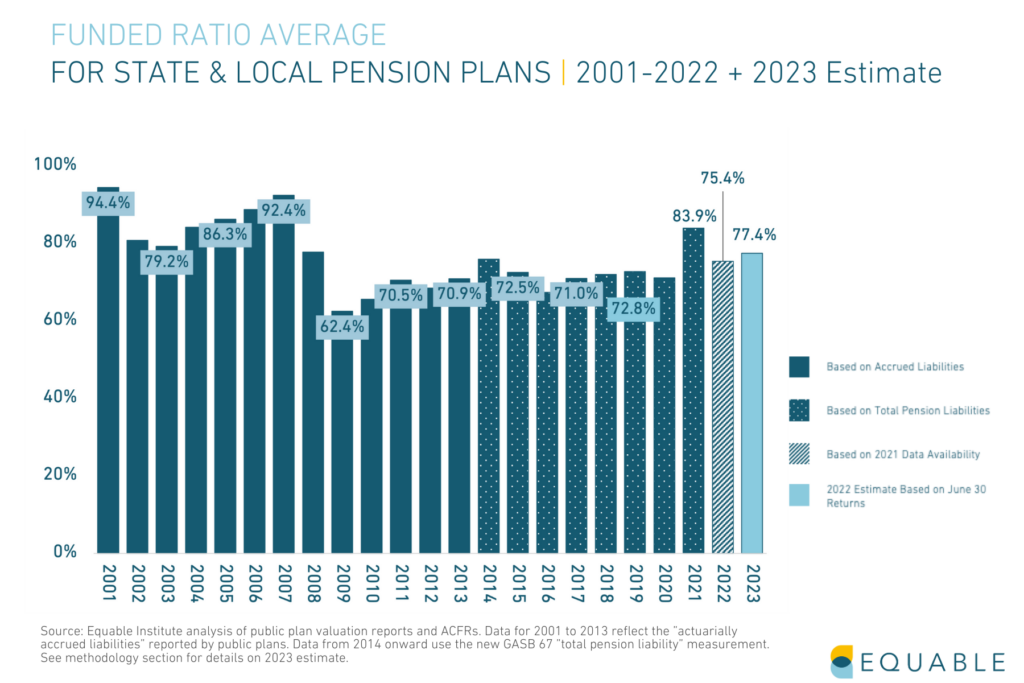
The funded status for state and local pension plans improved in 2024, propelled forward by solid financial market performance. Yet, public pension plans are still in a fragile financial condition. Between 2023 and 2024, the average market valued public pension funded ratio increased from 75.5% up to 80.2% and once all public pension plans release their 2024 data, we estimate that unfunded liabilities will be $1.37 trillion.
This marks 18 consecutive years with an average funded ratio below 90%, the minimum threshold for pension plans to be considered resilient.
This year’s 10.3% average investment return is better than the average assumed rate of return that public plans were using last year (6.87%), but it is less than the performance of most major public equity indices like the S&P 500. Generally, this can be attributed to the poor performance of fixed income investments over the last year. For example the return for Barclay’s U.S. Aggregate Bond Index was effectively 0% for the 2024 calendar year.
There’s no question that the aggregate funded status for public pension plans while improved is still mediocre. But, funded ratios and unfunded liabilities vary widely across states and plans. Below, we look at public pension funded ratios ranked by plan and by state.
State of Pensions 2024 | State Funded Status Rankings | Plan Funded Status Details
The Top 15 Plans by Funded Status for 2024
The best funded pension plans, as of fiscal year 2024, have a few things in common. Recently designed plans with cost-sharing components, plans with risk-sharing tools, and legacy plans with a multi-decade history of strong funded status all fared well.
The Bottom 15 Plans by Funded Status for 2024
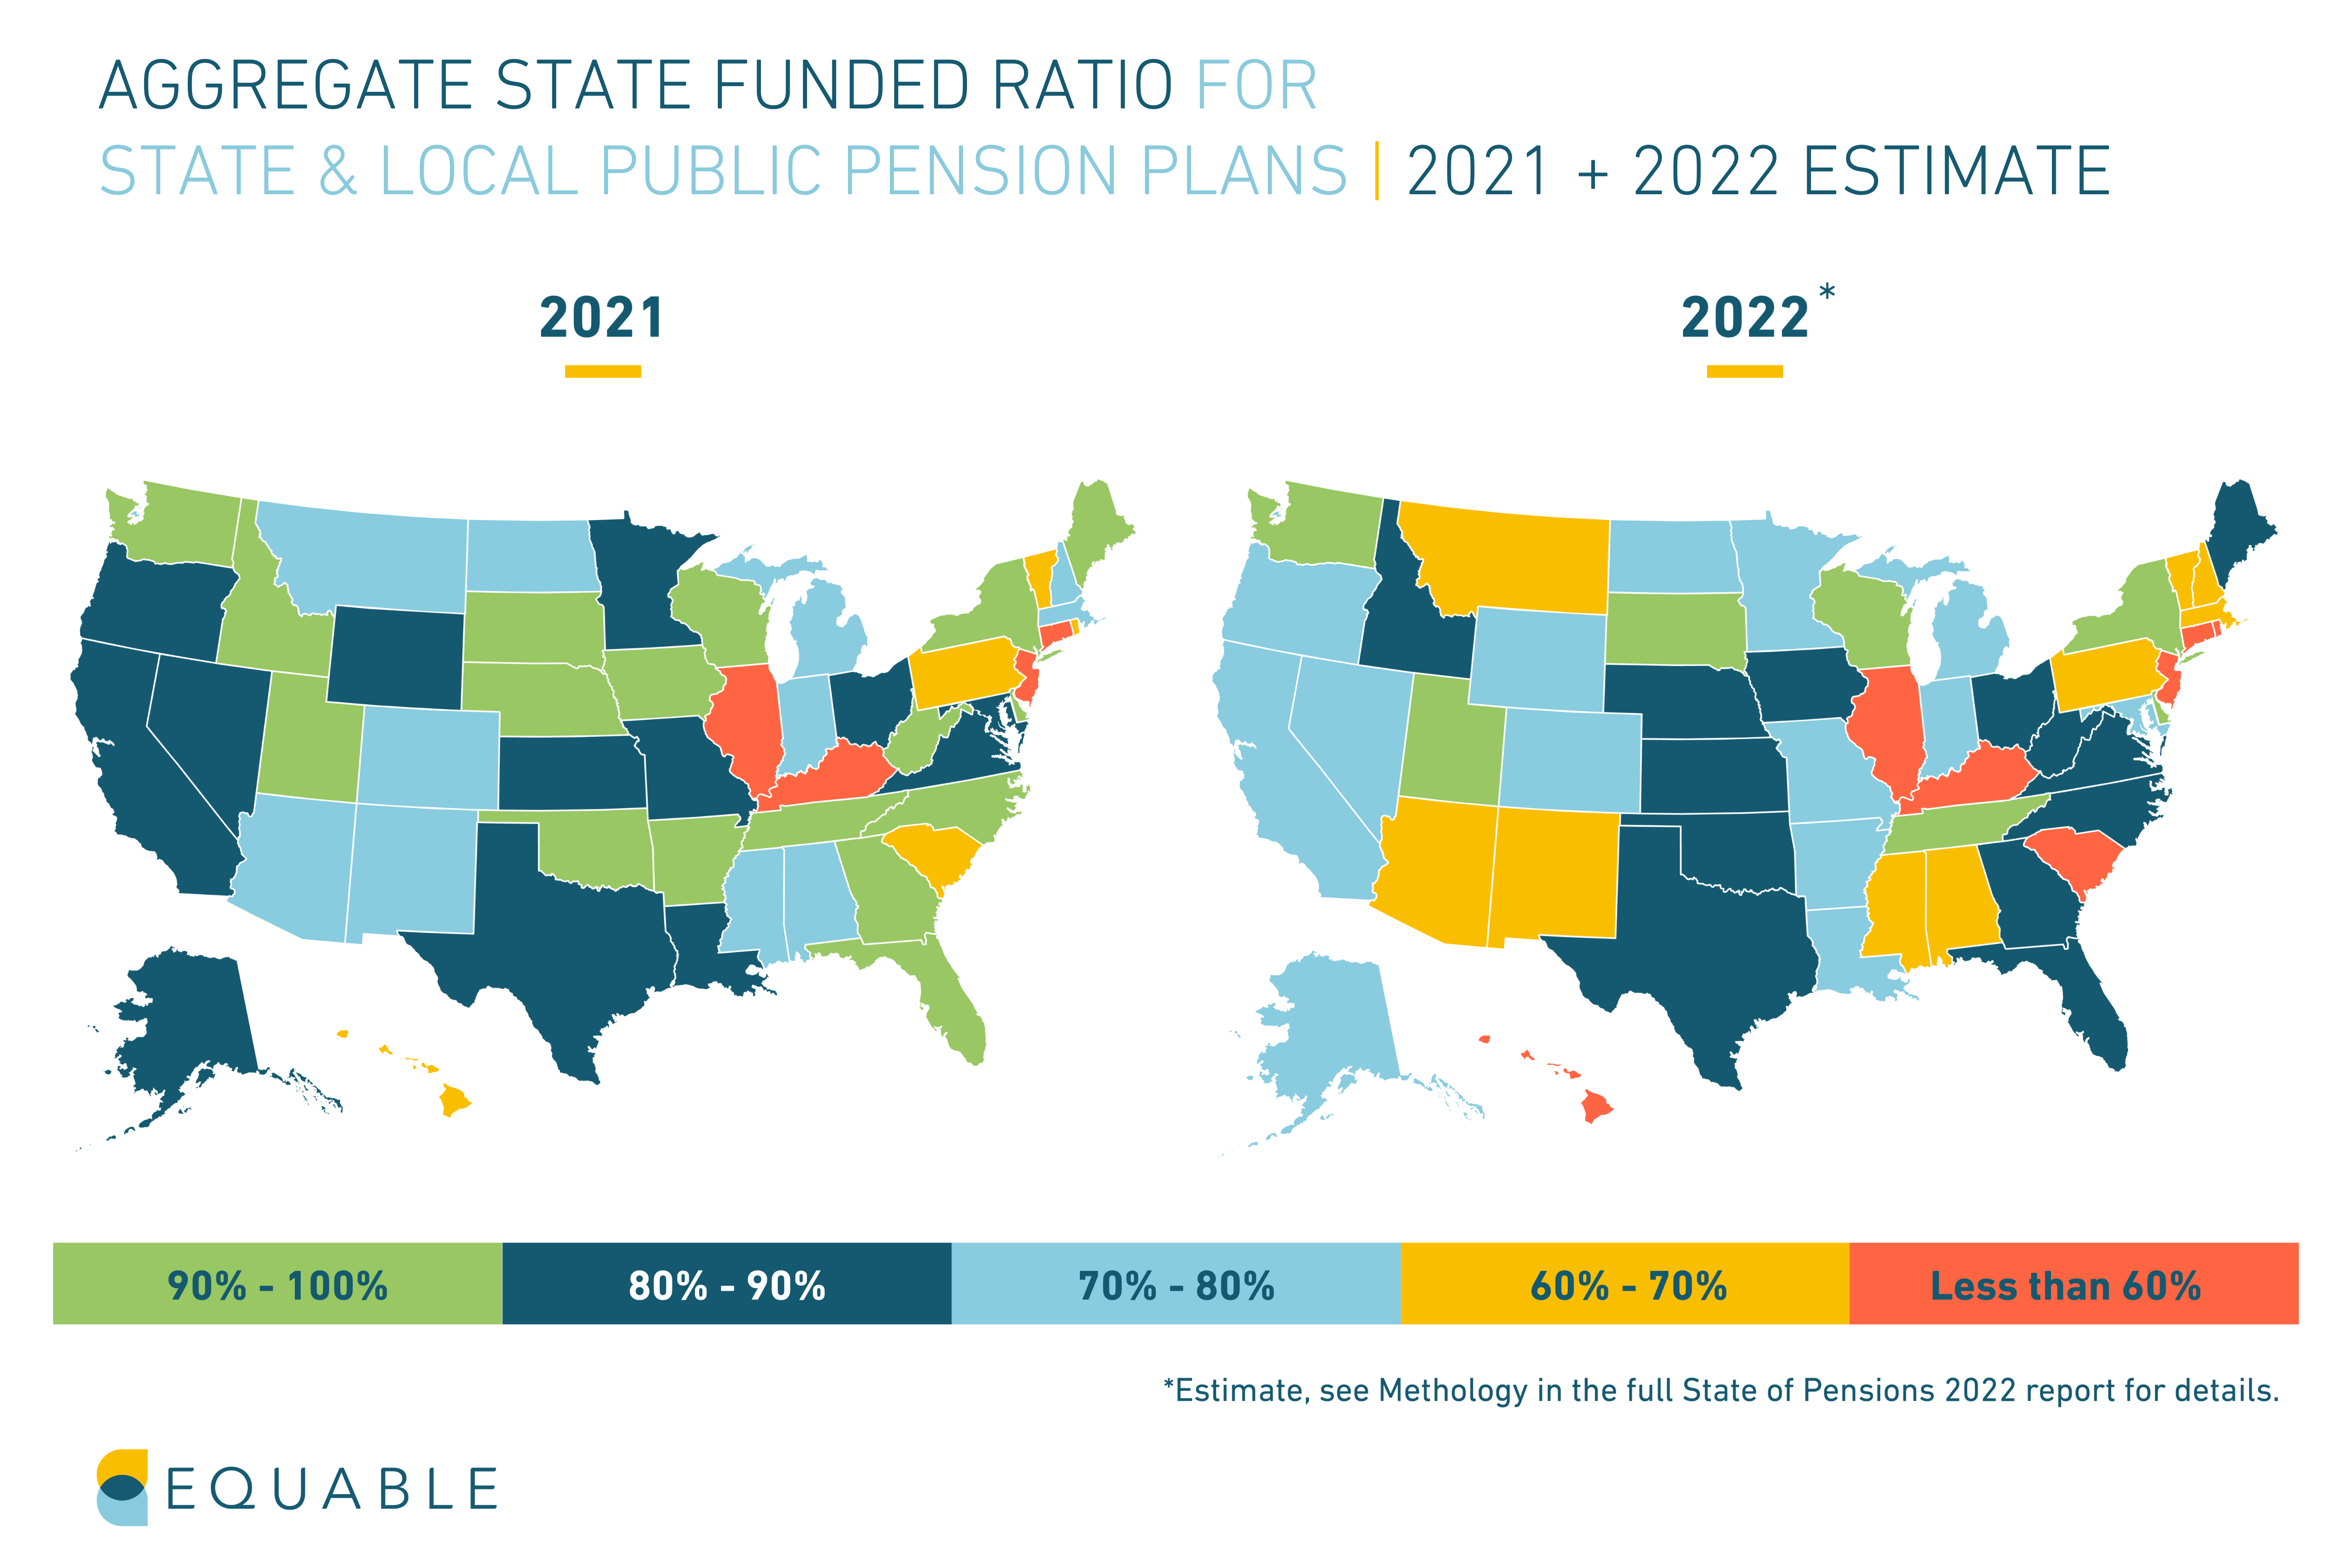
The worst funded pension plans are largely from Illinois, New Jersey, Connecticut, and Kentucky. Among the worst are a few plans funded on a pay-as-you-go basis. Here are the 15 worst pension plans by funded ratio.
*Estimate based partially on reported preliminary returns and partially on asset allocation and benchmark returns.
**Estimate based on asset allocation and benchmark returns.
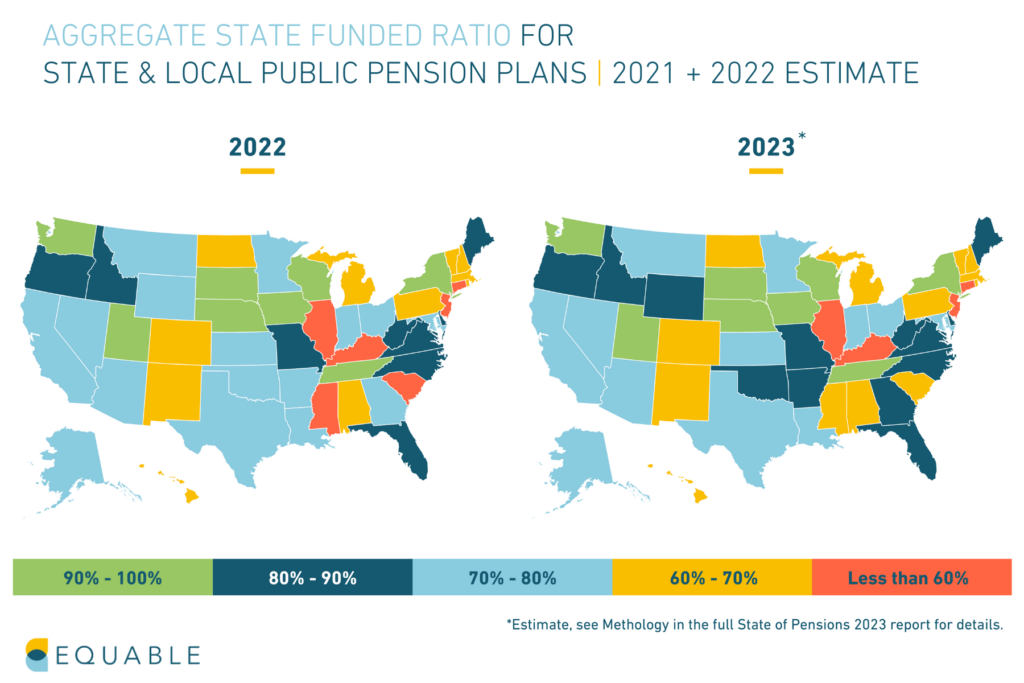
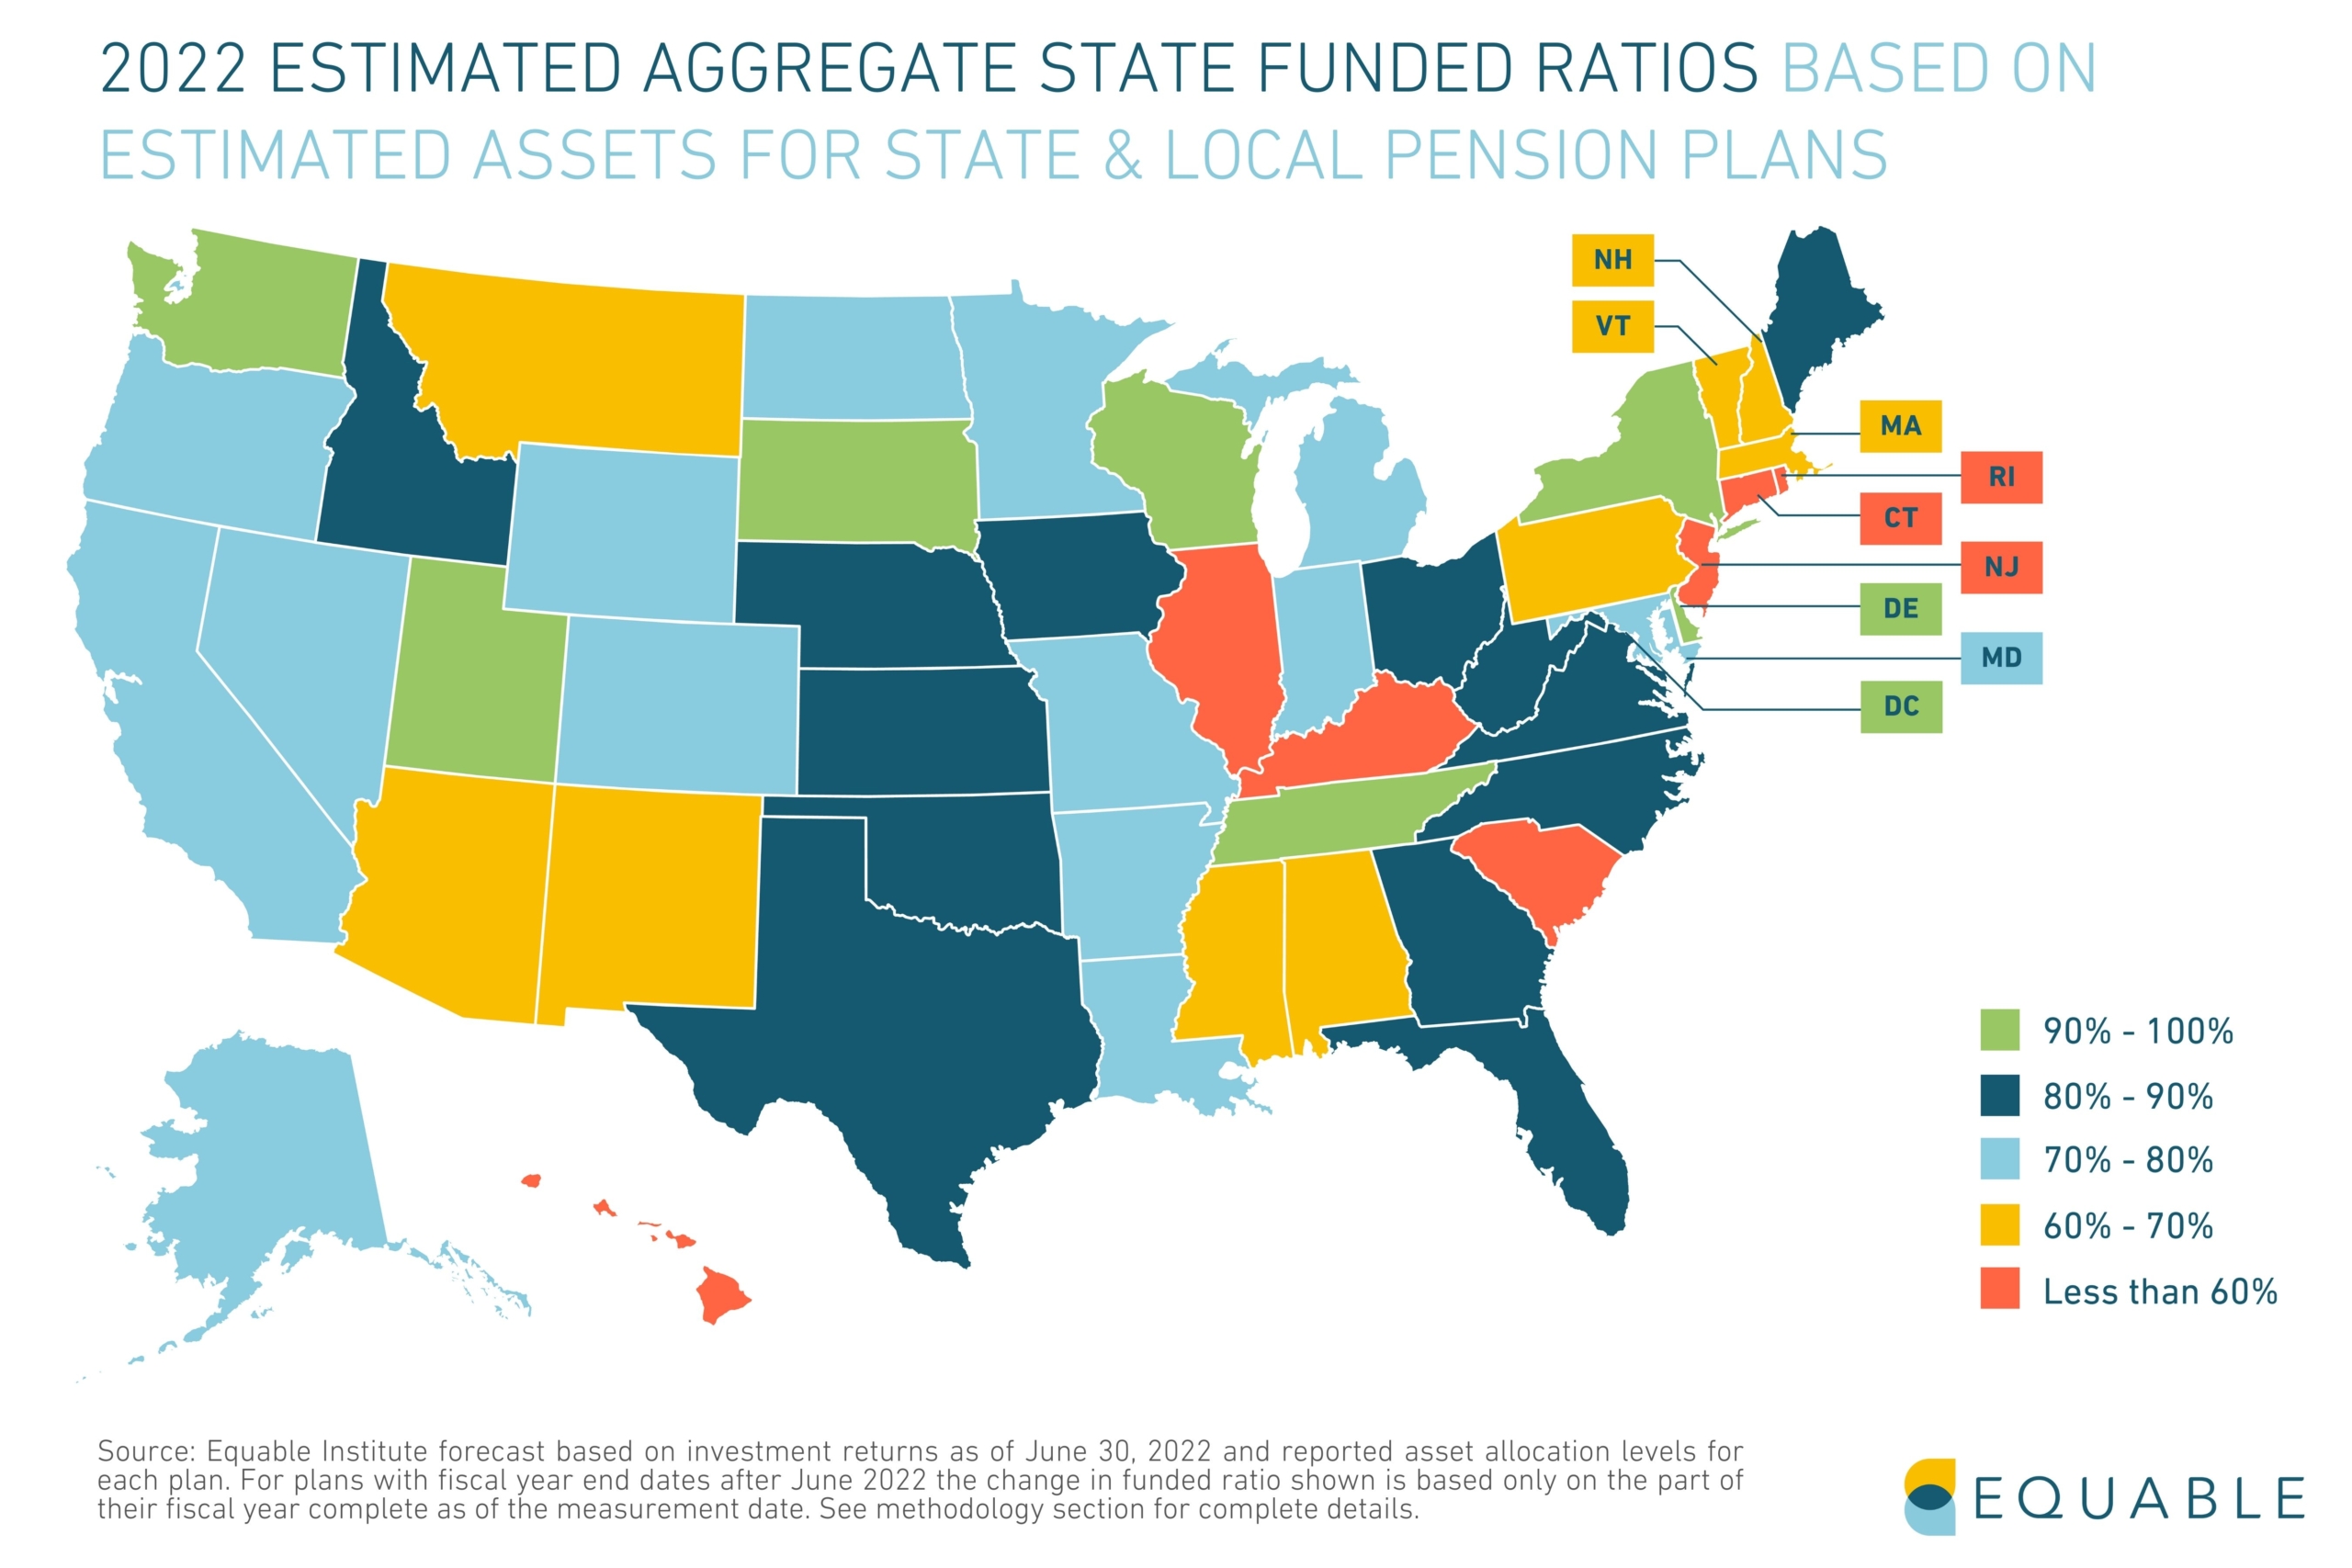
2024 Funded Status by State

A Full List of Plans by 2024 Funded Status
Teacher Pension COLAs in 2023
A key feature of teacher pension plans is that they offer guaranteed income for life. But unless the purchasing power of that pension income keeps up with inflation, the guarantee doesn’t necessary provide ensured financial security. That is why many defined benefit pensions for teachers come with cost-of-living adjustments, or COLAs.
However, just because there are many plans with COLAs doesn’t mean there is widespread protection from inflation.
The average COLA provided by teacher pension plans this year has been 1.96%.[1] This is effectively the same as the average cost-of-living adjustment offered to all public pension plan retirees.
The 1.96% figure is below most measures of actual price inflation in 2023. That is because many COLA policies do not exactly match inflation. Instead COLA rules have maximum rates (e.g., increasing at the rate of inflation up to 2%) or they are linked to other factors (e.g., a 2% COLA, but only if the pension fund for base benefits has adequate resources).
There are some reasonable financial reasons for these rules. Some years retired teachers get COLAs that are actually larger than inflation. However, the net effect in 2022 and 2023 has been that public pension COLAs frequently are less than inflation.
Teacher pension COLAs vary in how much inflation protection they provide, and in who gets the benefit adjustments. In this article, we explain some of the different kinds of cost-of-living adjustments provided to retirees from public employee pension funds.
First, here is a list of teacher pension plans and classes of benefits and the COLAs they’ve provided in 2023.
Not all teacher pension COLAs are created equal. If you are trying to determine whether or not a COLA is adequate enough to maintain the spending power of your retirement benefits, you should consider the following elements of your plan's COLA policy:
1. Compounding versus Non-Compounding Benefits
Retirement funds have two ways of adjusting underlying benefits when paying out teacher public pension COLAs.
Compounding Benefits: Retirement funds permanently adjust the base benefit and add any any future changes to benefits on top.
For example, someone with a $40,000 pension that gets a 2% COLA will have their base benefit increased to $40,800. The next year, if inflation means a 1.5% COLA, then the adjustment is calculated based on the new, higher number. So in this case, the benefit would increase to $41,412.
Non-Compounding Benefits: This means that all inflation adjustments are based on the original pension benefit value. Each year benefits increase, you get to keep the adjustment from the previous year. But, the percentage increase is based on your original pension.
For example, a former teacher with a $40,000 pension that got a 2% COLA would see $800 added on top for a total pension of $40,800. The next year, a 1.5% COLA would be calculated on the original $40,000 pension. $600 would then be added on top for a total pension of $41,200.
2. Three Types of Automatic Public Pension COLAs
There are generally three policy frameworks for those teachers who do have automatically granted COLAs that protect public worker pensions from inflation:
- Fixed-Rate COLAs: A pre-fixed specific percentage of benefit increase (or minimum dollar amount).
- COLAs Linked to Inflation: A percentage increase to benefits based on the national consumer price index (CPI), a local CPI, or the Social Security inflation rate. The actual amount is typically “up to” a maximum rate, such as 2% or 3%.
- COLAs Linked to Plan Performance: A percentage increase to benefits that is dependent on the funded ratio and/or investment performance of the underlying pension plan. The actual amount is also typically “up to” a maximum rate, but that maximum rate is determined by the specific provisions around plan performance. For example, the maximum COLA rate may be cut in half or suspended if the pension fund is under 80%.
Some state pension funds have inflation adjustments linked to both inflation and pension plan performance.
3. Ad Hoc Cost-of-Living Adjustments
There are a number of teacher pension plans that do not provide consistent inflation protection. Some of these states have no legal provisions to offer COLAs. Other states only payout COLAs if the legislature authorizes the benefit adjustment. Because COLAs are not legally required in these states, they are called "ad hoc" COLAs. These COLAS are also heavily dependent on local politics and legislative budgets.
Note [1]: This is an average of 158 classes of defined benefits, including actual reported percentage rates adjusting benefits starting in the 2023 calendar year and percentage rates based on published COLA policies.
Pension Plan Funded Ratio Rankings 2023
At the end of fiscal year 2023, the average funded ratio for American public pension plans was 78.1%. While this is a modest improvement over the losses of 2022, it is also a continuation of the fragile funded status that has persisted for more than a decade and a half after the financial crisis.
Once all public pension plans release their 2023 data, we estimate that unfunded liabilities will be $1.44 trillion. The combined funded status for the top state and local retirement systems will be 78.1%, based on available data through December 31, 2023. This is up from the 74.9% funded ratio during fiscal year 2022.
Despite modest improvements in funded status and unfunded liabilities, investment returns tell a more complex story. Strong investment returns in the last few months of the year drove the average investment return to 7.47%, beating the average 6.9% assumed rate of return. But, on a plan-by-plan basis, just 53% of plans beat their investment assumptions. Meaning 2023 was much better to some plans than others.
There’s no question that the aggregate funded status for public pension plans while improved is still mediocre. But, funded ratios and unfunded liabilities vary widely across states and plans. Below, we look at public pension funded ratios ranked by plan and by state.
State of Pensions 2023 | State Funded Status Rankings | Plan Funded Status Details
The Top 10 Plans by Funded Status for 2023
The best funded pension plans, as of fiscal year 2023, have a few things in common. Recently designed plans with cost-sharing components, plans with risk-sharing tools, and legacy plans with a multi-decade history of strong funded status all fared well.
The Bottom 15 Plans by Funded Status for 2023
The worst funded pension plans are largely from Illinois, New Jersey, Connecticut, and Kentucky. Among the worst are a few plans funded on a pay-as-you-go basis. Here are the 15 worst pension plans by funded ratio.
*Estimate based partially on reported preliminary returns and partially on asset allocation and benchmark returns.
**Estimate based on asset allocation and benchmark returns.
2023 Funded Status by State

A Full List of Plans by 2023 Funded Status
State of Pensions 2023: National Pension Funding Trends
Pension Plan Funded Ratio Rankings 2022
U.S. public pension plan funded ratios at the end of 2022 reflect a challenging year. The 2022 calendar year was not a great time to be managing pension fund assets. A few hedge funds and money managers successfully navigated the choppy and volatile investment waters of 2022. However, most lost money. Some lost a lot of money.
The investment losses in 2022 didn’t wipe out all the funded status gains from 2021. Unfortunately, this year has – yet again – exposed the lack of resilience plaguing many public pension plans.
Once all public pension plans release their 2022 data, we estimate that unfunded liabilities will be $1.45 trillion. The combined funded status for the top state and local retirement systems will be 77.3%, based on available data through December 31, 2022. This is down from the 83.9% funded ratio during fiscal year 2021.
There’s no question that the aggregate funded status for public pension plans is mediocre. But, funded ratios and unfunded liabilities vary widely across states and plans. Below, we look at public pension funded ratios ranked by plan and by state.
State of Pensions 2022 Year End Update | State Funded Status Rankings | Plan Funded Status Details
The Top 10 Plans by Funded Status for 2022
There are some common themes among the best funded pension plans as of fiscal year 2022. Recently designed plans with cost-sharing components, plans with risk-sharing tools, and legacy plans with a multi-decade history of strong funded status all fared well.
| wdt_ID | Rank | Plan Name | Funded Ratio | Unfunded Liabilities | Notes |
|---|---|---|---|---|---|
| 1 | 1 | Washington LEOFF Plans 1 & 2 | 126.60% | 5,586,311,168.00 | These two pension plans have both been around 100% funded or better since the 1990s. |
| 2 | 2 | Michigan PSERS Pension Plus Plans 1 & 2 | 121.70% | 317,528,608.00 | These are risk-sharing hybrid plans. The Pension Plus Plan opened to new members in July 2010. The PPP2 was created for members starting February 2018 with a 6% max assumed return and 50/50 cost-sharing rules. |
| 3 | 3 | Tennessee Teachers Hybrid Plan | 119.50% | 116,868,544.00 | This is the hybrid plan for Tennessee teachers that launched in July 2014. |
| 4 | 4 | Detroit Police & Fire Component 1 | 112.80% | 31,286,768.00 | This is a new hybrid plan created for members hired since July 2014 (about a quarter of members) |
| 5 | 5 | Tennessee Teachers Legacy Plan | 109.50% | 2,639,685,632.00 | This is a legacy pension plan in Tennessee that closed to new members since 2014. |
| 6 | 6 | New York City Board of Education | 108.90% | 540,272,128.00 | This is a pension plan for board of education officials. |
| 7 | 7 | D.C. Police and Fire Plan | 107.70% | 506,743,808.00 | This pension plan has been considered fully funded for the past several decades. |
| 8 | 8 | Nebraska PERS Cash Balance Plan | 107.40% | 149,662,848.00 | This is a guaranteed return plan that has been open to new members since January 2003. |
| 9 | 9 | Arizona PSPRS Tier 3 | 107.20% | 10,855,456.00 | This is a risk-sharing pension plan that was created for new public safety members as of July 2017. |
| 10 | 10 | Washington PERS Plans 2 & 3 | 106.70% | 3,708,780,544.00 | These are a pension and hybrid plan that employees are offered a choice of membership in when joining. |
| Rank | Plan Name | Funded Ratio | Unfunded Liabilities | Notes |
The Bottom 15 Plans by Funded Status for 2022
The worst funded pension plans are largely from Illinois, New Jersey, Connecticut, and Kentucky. Among the worst are a few plans funded on a pay-as-you-go basis. Here are the 15 worst pension plans by funded ratio.
| wdt_ID | Plan Name | Funded Ratio | Unfunded Liabilities | Notes |
|---|---|---|---|---|
| 1 | Illinois JRS | 46.60% | 1,666,196,736.00 | Illinois pension plan. |
| 2 | Connecticut SERS | 45.60% | 22,124,845,056.00 | |
| 3 | Chicago Teachers | 45.30% | 14,190,124,032.00 | Illinois pension plan. |
| 4 | Illinois SERS | 43.50% | 33,301,098,496.00 | Illinois pension plan. |
| 5 | Chicago Laborers** | 42.90% | 1,706,322,304.00 | Illinois pension plan. |
| 6 | Illinois TRS | 42.80% | 83,840,331,776.00 | Illinois pension plan. |
| 7 | Dallas Police and Fire* | 42.20% | 3,041,735,168.00 | |
| 8 | New Jersey Teachers Pension Annuity | 37.40% | 47,929,602,048.00 | |
| 9 | Arizona Elected Officials | 32.00% | 675,132,992.00 | This plan was not fully funded after it was closed to new members. |
| 10 | Indiana Teachers Pre-96 Plan | 28.40% | 10,067,401,216.00 | This plan is using a pay-as-you-go funding model. |
| Plan Name | Funded Ratio | Unfunded Liabilities | Notes |
*Estimate based partially on reported preliminary returns and partially on asset allocation and benchmark returns.
**Estimate based on asset allocation and benchmark returns.
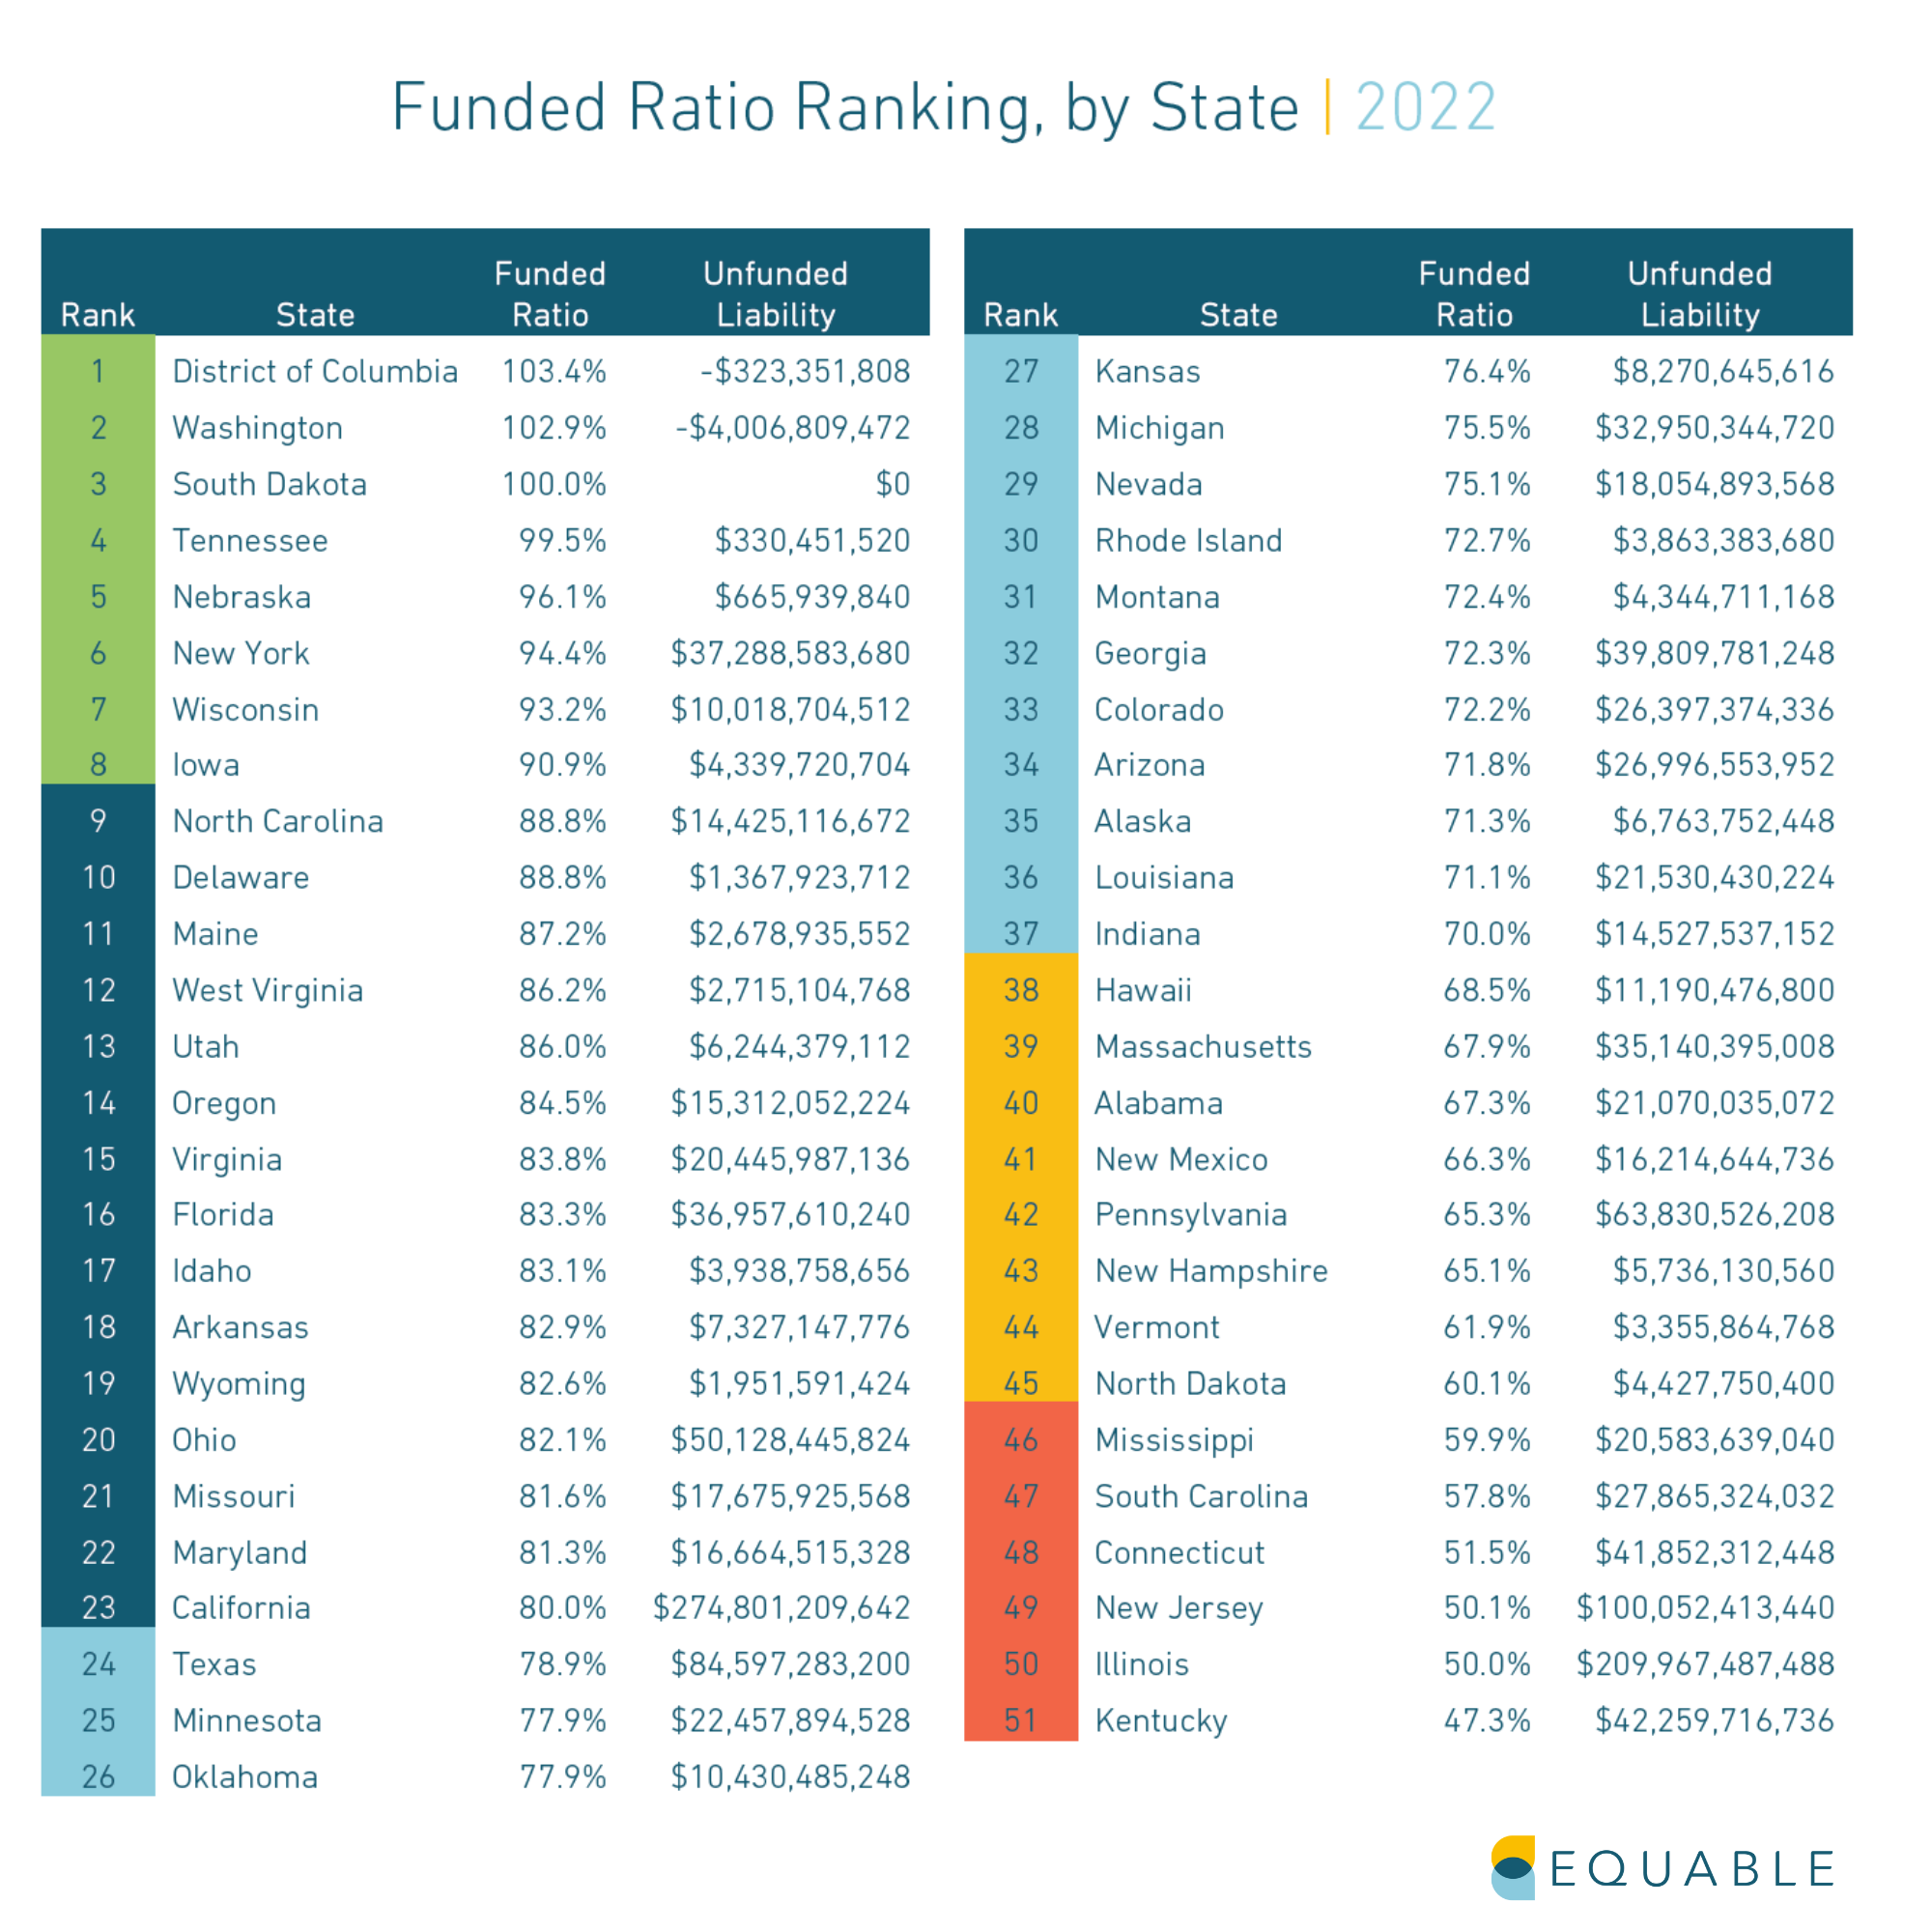
2022 Funded Status by State
A Full List of Plans by 2022 Funded Status
Pension Vesting Periods by State
In the U.S., public pension vesting periods vary widely by state. There are many reasons why states might offer longer or shorter vesting periods. But understanding the vesting terms of a public retirement plan can be a helpful metric for public employees to determine whether or not a retirement plan meets their needs.
In short, A vesting period is the amount of time an employee must work to qualify for retirement benefits. Retirement plan vesting periods are common in both the public and private sector. There are vesting rules for pension plans, defined contribution plans, guaranteed return plans, hybrid plans, and anything in between.
In this article, we will discuss how how vesting periods have changed over time for U.S. public retirement plans and provide a list of the current pension vesting periods by state, along with vesting periods for other types of public retirement plans.
JUMP TO: Vesting Periods by State
What is “Vesting”?
The minimum number of years a state or local employee needs to work in a state in order to be entitled to receive a pension benefit or the money their employer has contributed to their individual retirement account.
Why Government Employers Use Vesting Periods
The primary reason that employers give for having vesting periods is to help them with retaining staff talent. The basic logic is that people will stick around longer if they know they haven’t vested in their retirement benefits. While this logic may work for a small number of individuals who are within a few months of reaching their vesting period, in practice, the value of the retirement benefits available after just a few years are rarely sufficient to be a reason on their own for an employee to stay in civil service.
The political reality is that most state governments use retirement plan vesting periods as a way to save money. By setting vesting periods at 5, 7, or sometimes even 10 years, state governments are reducing the amount of future pensions they will have to distribute (or the employer payments to defined contribution plans they will have to release).
How Public Pension Vesting Periods Changed After the Financial Crisis
One of the ways that states responded to the Great Recession and Financial Crisis of 2007-09 was to look for ways to save money on retirement benefits. A common way that states have done this is to increase the number of years that public employees have to work to qualify for a pension.
For example, in Illinois, teachers and state workers hired before January 1, 2011 have to work four (4) years to order to vest in their pension benefits, whereas those hired from 2011 onward have to work eight (8) years.
Or in New York, public employees hired before January 2010 have a five (5) year vesting period to qualify for pension benefits while those hired after that point were, until recently, required to work 10 years to vest. Notably, in 2022, the New York state legislature reduced this vesting period back to five (5) years after a sustained campaign that demonstrated how problematic of a policy this was from the perspective of providing adequate retirement benefits to public workers.
The chart below shows the average vesting period over time for pension plans that are open to new members.
Public Pension Vesting Periods by State
Vesting periods range by state, hire date, and employee type. Vesting periods for teachers and public school employees average 6.4 years, while public safety officers have 8 year vesting periods on average. Pension plans for general civilian state and local employees average 6.9 year vesting periods.
The table below shows average public pension vesting periods by state, including data for traditional final average salary pensions, defined benefit guaranteed return plans, and hybrid plans that include a pension portion.
Defined Contribution Vesting Periods
The approach to vesting for defined contribution plans can sometimes look different than for pension benefits. In this context, employees are not vesting in the right to draw a pension check, instead they are vesting in the right to claim employer contributions made to individual accounts on their behalf.
A typical vesting period for defined contribution plans might look like this:
- After one year of service, a member has vested in 50% of the employer contributions made to their defined contribution account
- After two years of service, 75% vested
- After three years of service, 100% vested
This would be considered a three-year “graded” vesting period. Different states use a range of graded vesting period approaches. South Carolina immediately vests employees in their defined contribution benefits.
The table below lists the statewide defined contribution plans for public workers and the vesting approach that they use.
Pension Contributions by State 2022
Public pension contribution rates have increased considerably over the last few decades. Some governments have had sharper increases than others. In many places mandatory pension contribution rates for public employees have increased, too. So what is your state paying for public employee pension benefits?
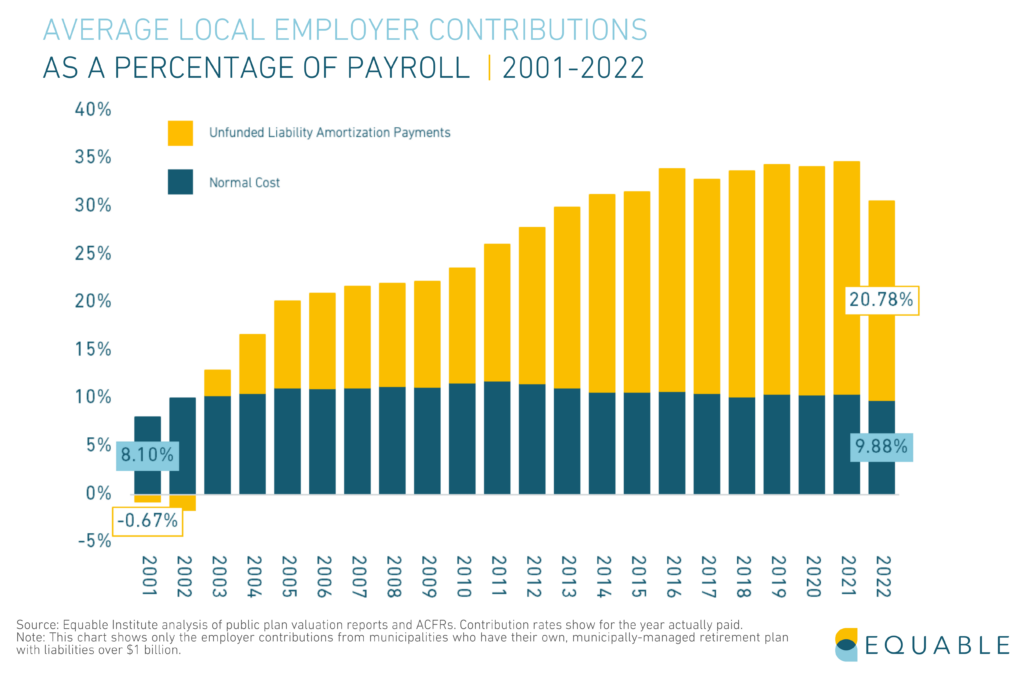
Currently, the average pension contribution rate for state and local employers is 29.82%.
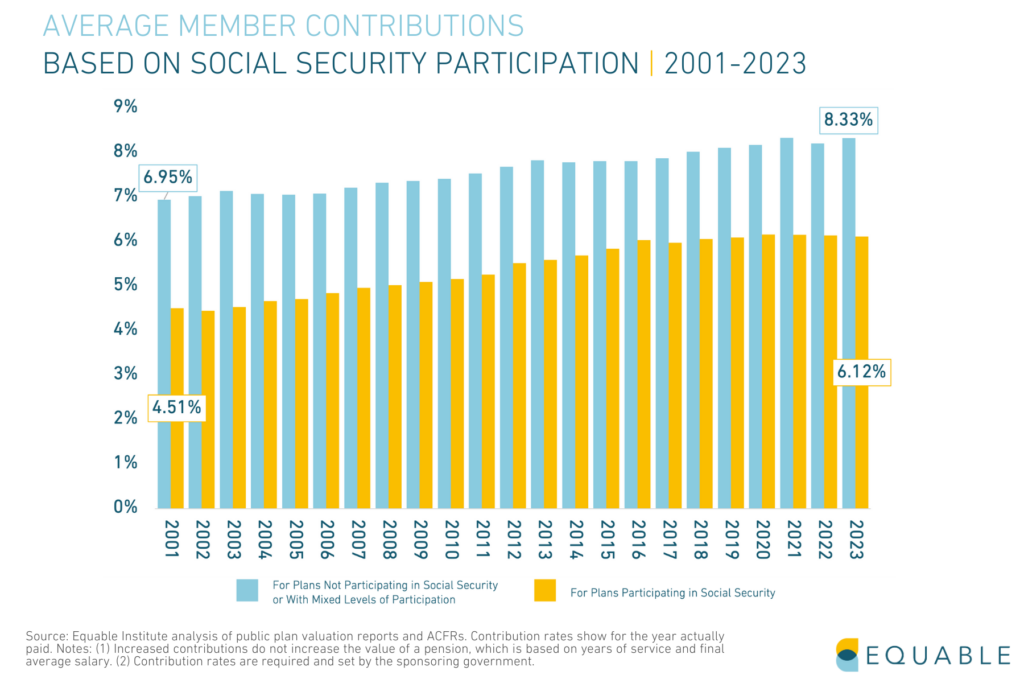
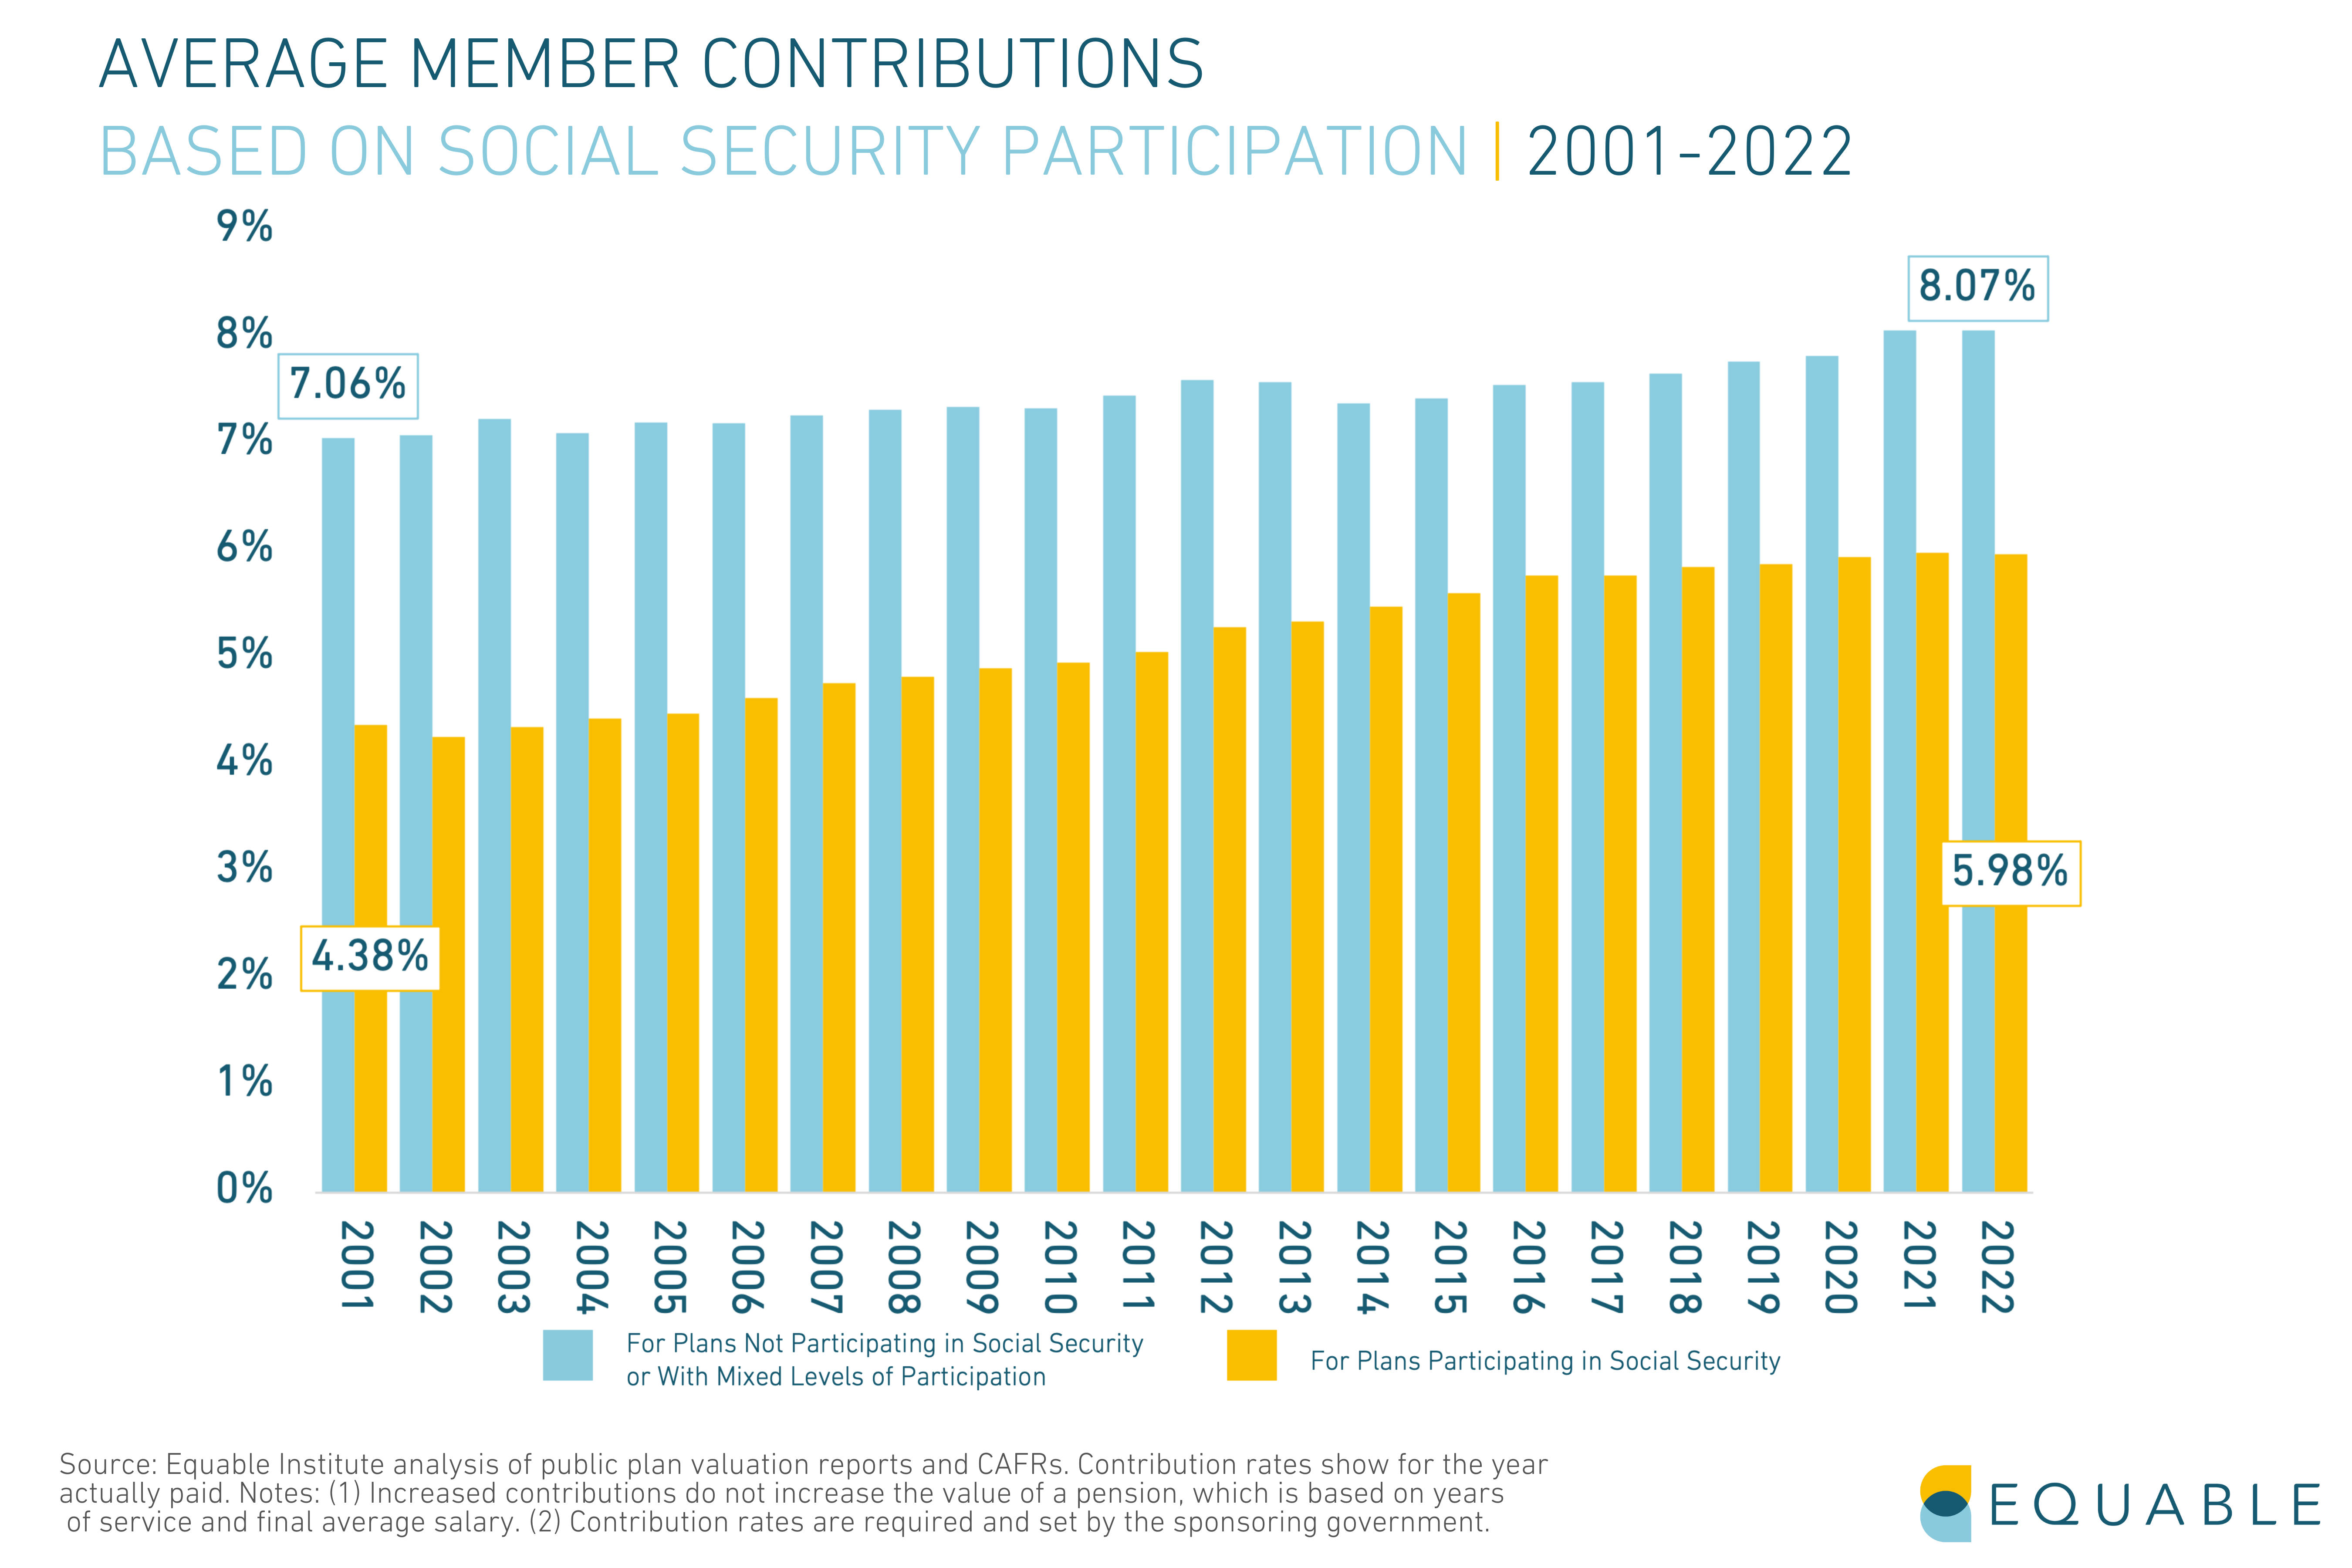
Employees enrolled in social security contribute 5.98% of their paycheck to their pension benefits, on average. While employees who are not offered social security contribute 8.07% on average.
In many states, pension contributions change from year to year and they may increase in 2023 and 2024. (Click here to see a version of this table with 2023 fiscal year data.)
It is important to keep in mind that states and cities do not uniformly participate in Social Security. Most individual government units do also enroll their employees in Social Security, but a few governments never opt-ed into the federal program. In theory, these non-participating locations should offer larger benefits and might have larger contribution rates.
The following charts show the average required contribution rates over time, broken out by state and locally administered plans, and whether or not members participate in Social Security. 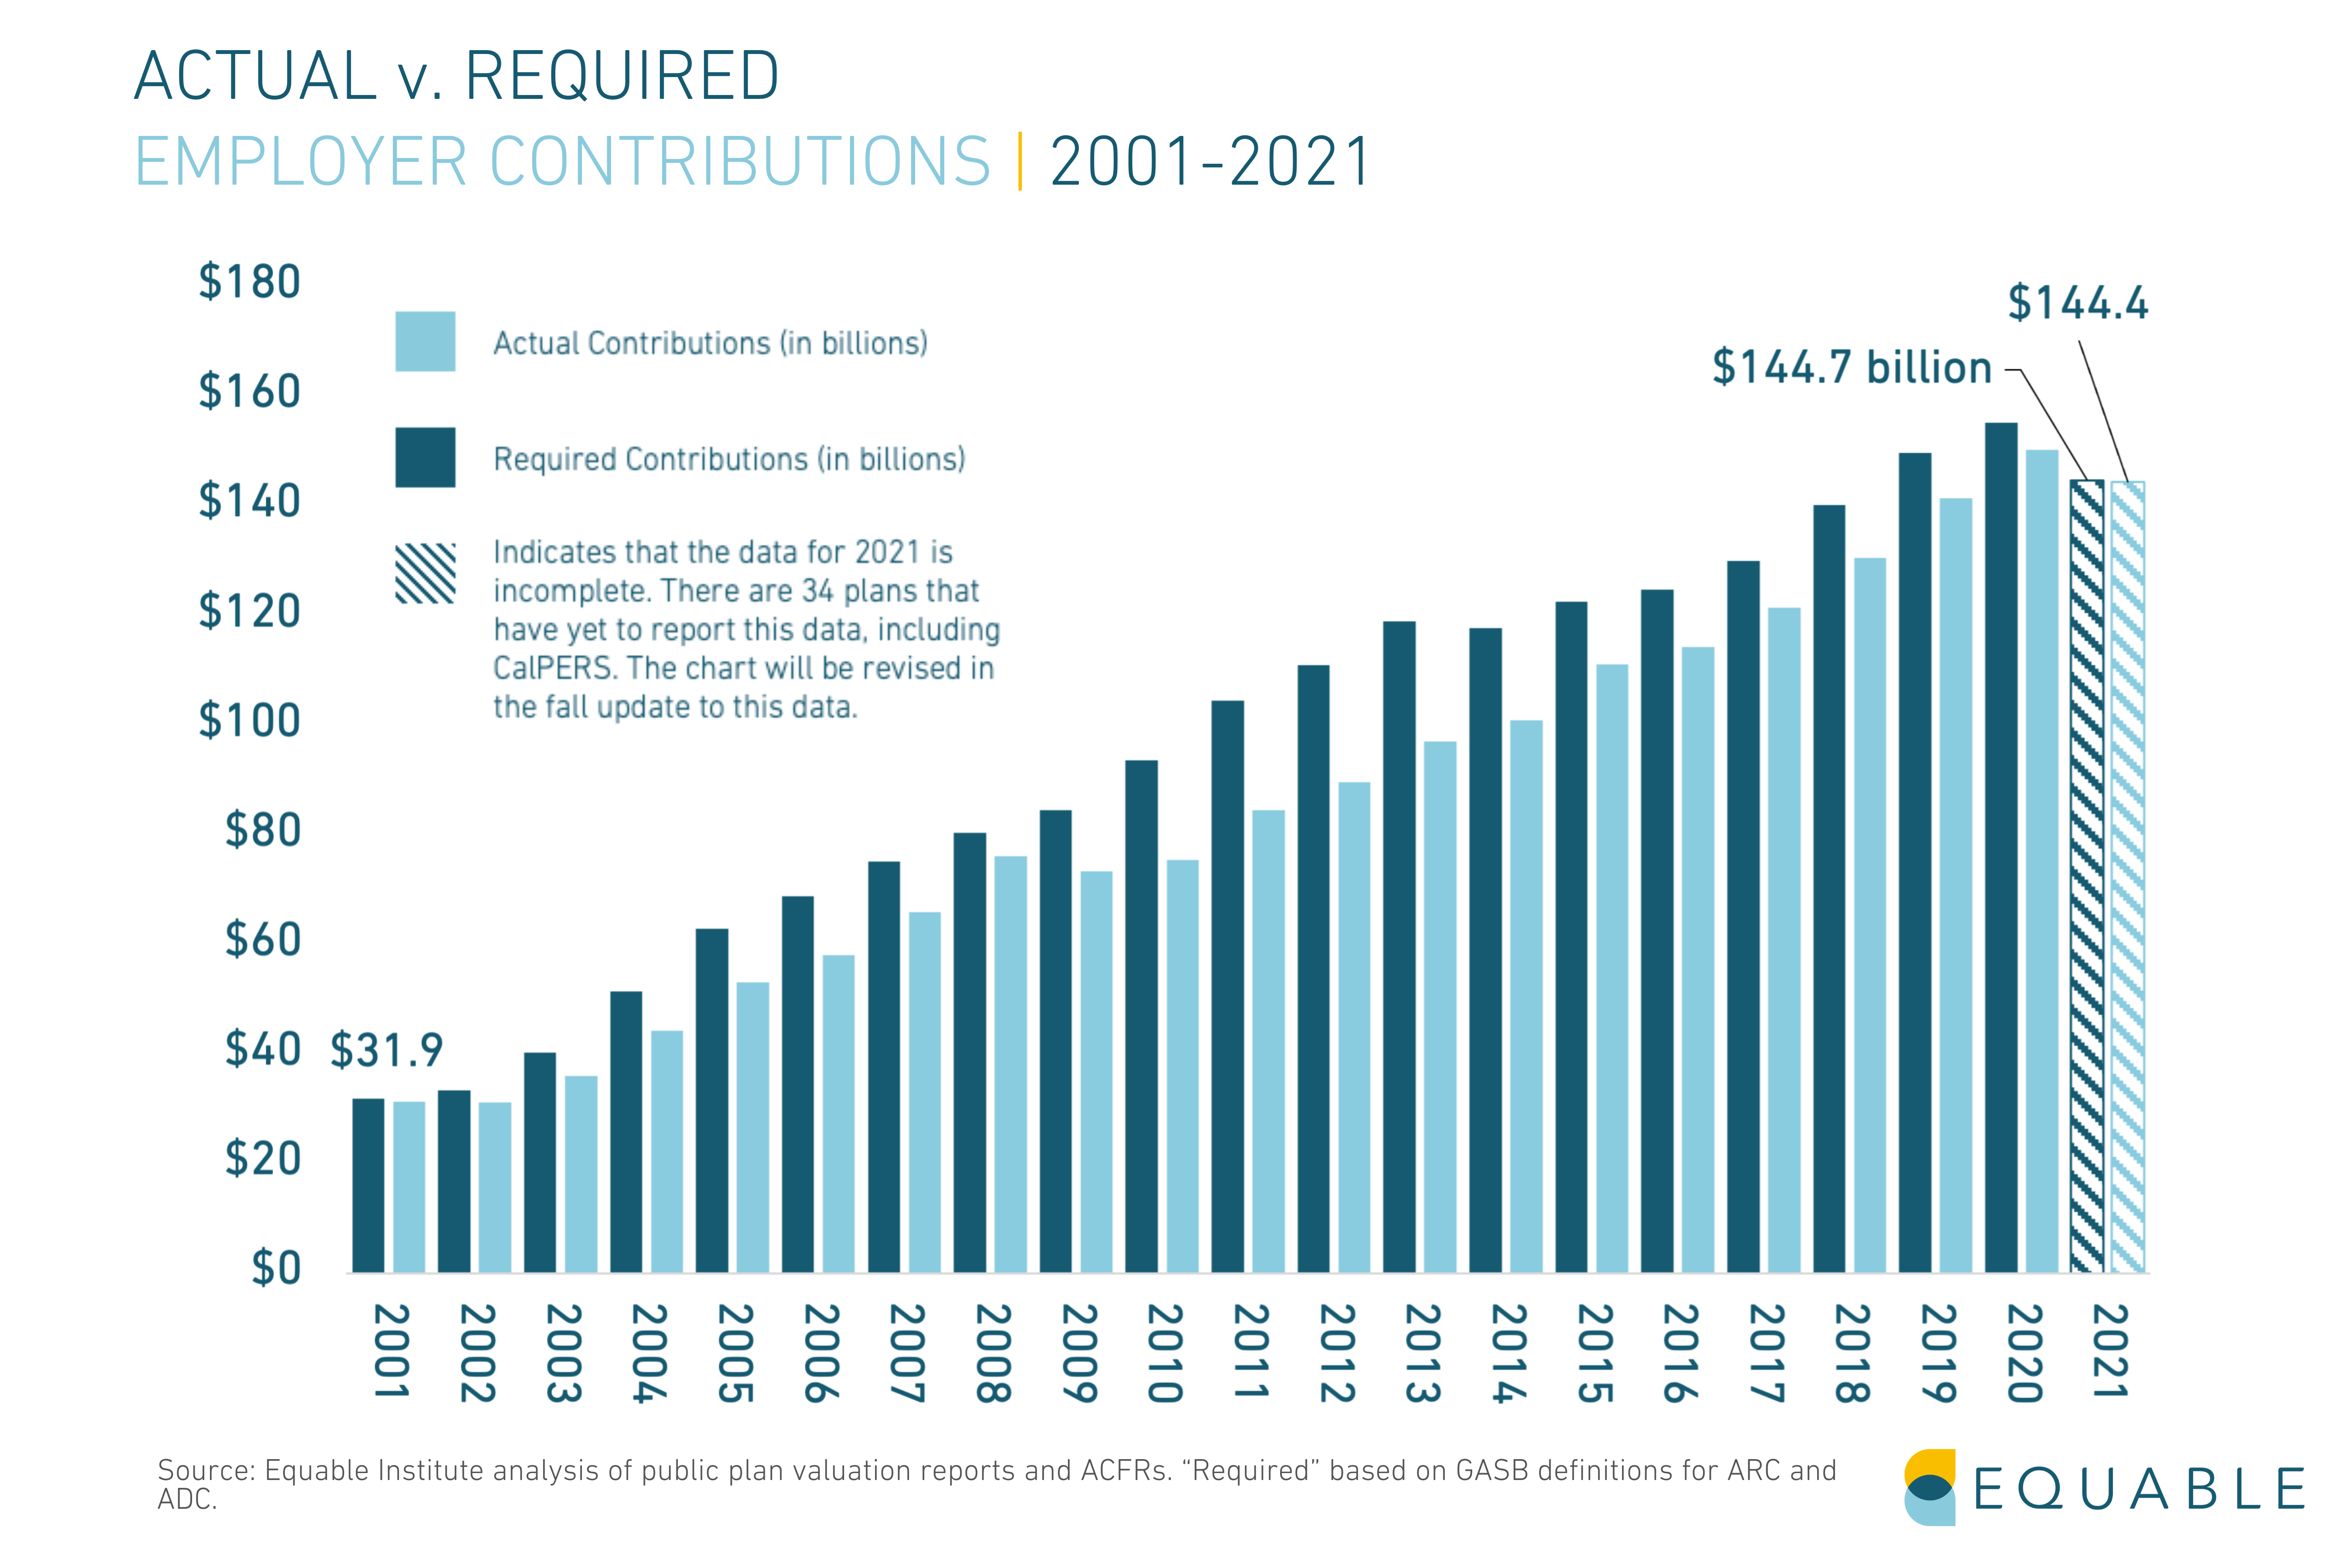
Download the contribution rate data yourself from our database, including detailed break outs of what share of state pension contributions go toward normal cost and unfunded liability payments.
Current Assumed Rate of Return for State Pensions
The average assumed rate of return for state pension plans in the United States is 6.9%, as of September 2022. The median is 7.0%.
Equable Institute tracks financial reporting for 231 defined benefit plans — e.g. pensions, guaranteed return, and hybrid plans — which are governed by 178 public sector retirement systems. Most of the plans are state administered, but our data also includes information for the 61 largest municipally-sponsored defined benefit plans in places like New York City, Chicago, Los Angeles, Houston, Orange County, Miami, and more.
Jump to the data | Learn more about the Assumed Rate of Return
*Article updated as of October 28th, 2022
Equable Analysis: Public Pensions Are Progressing Toward Lower Investment Assumptions
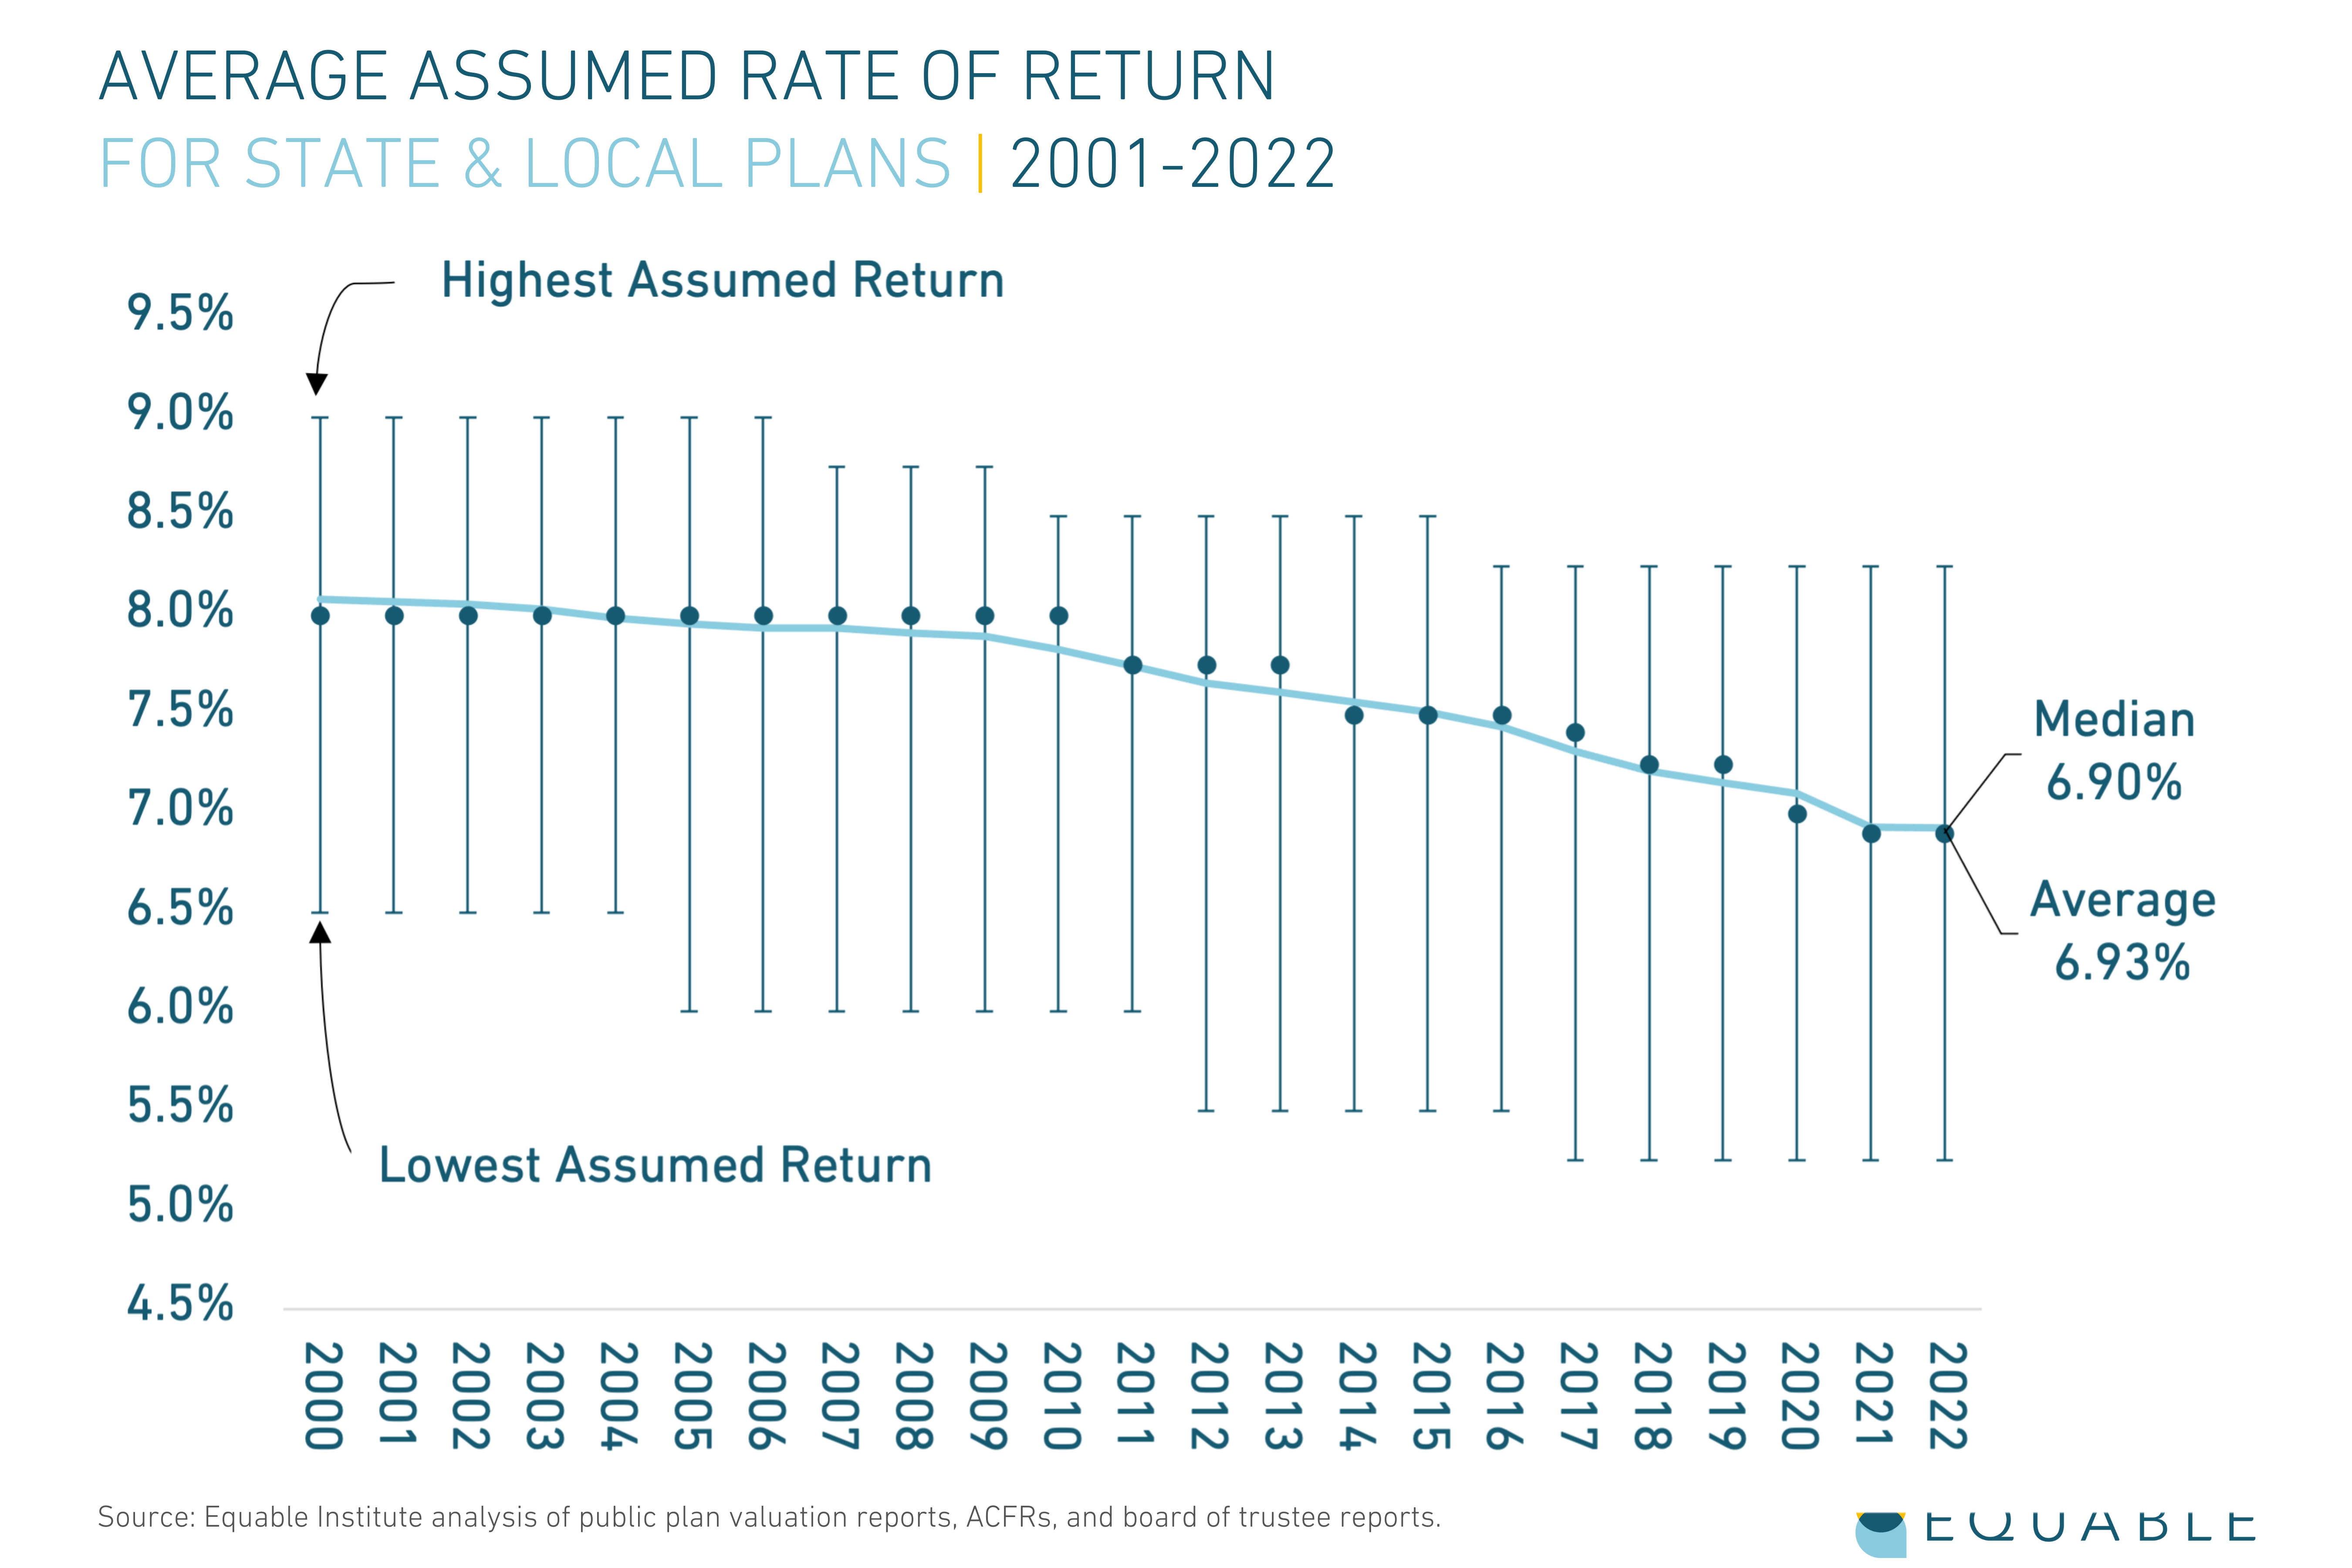
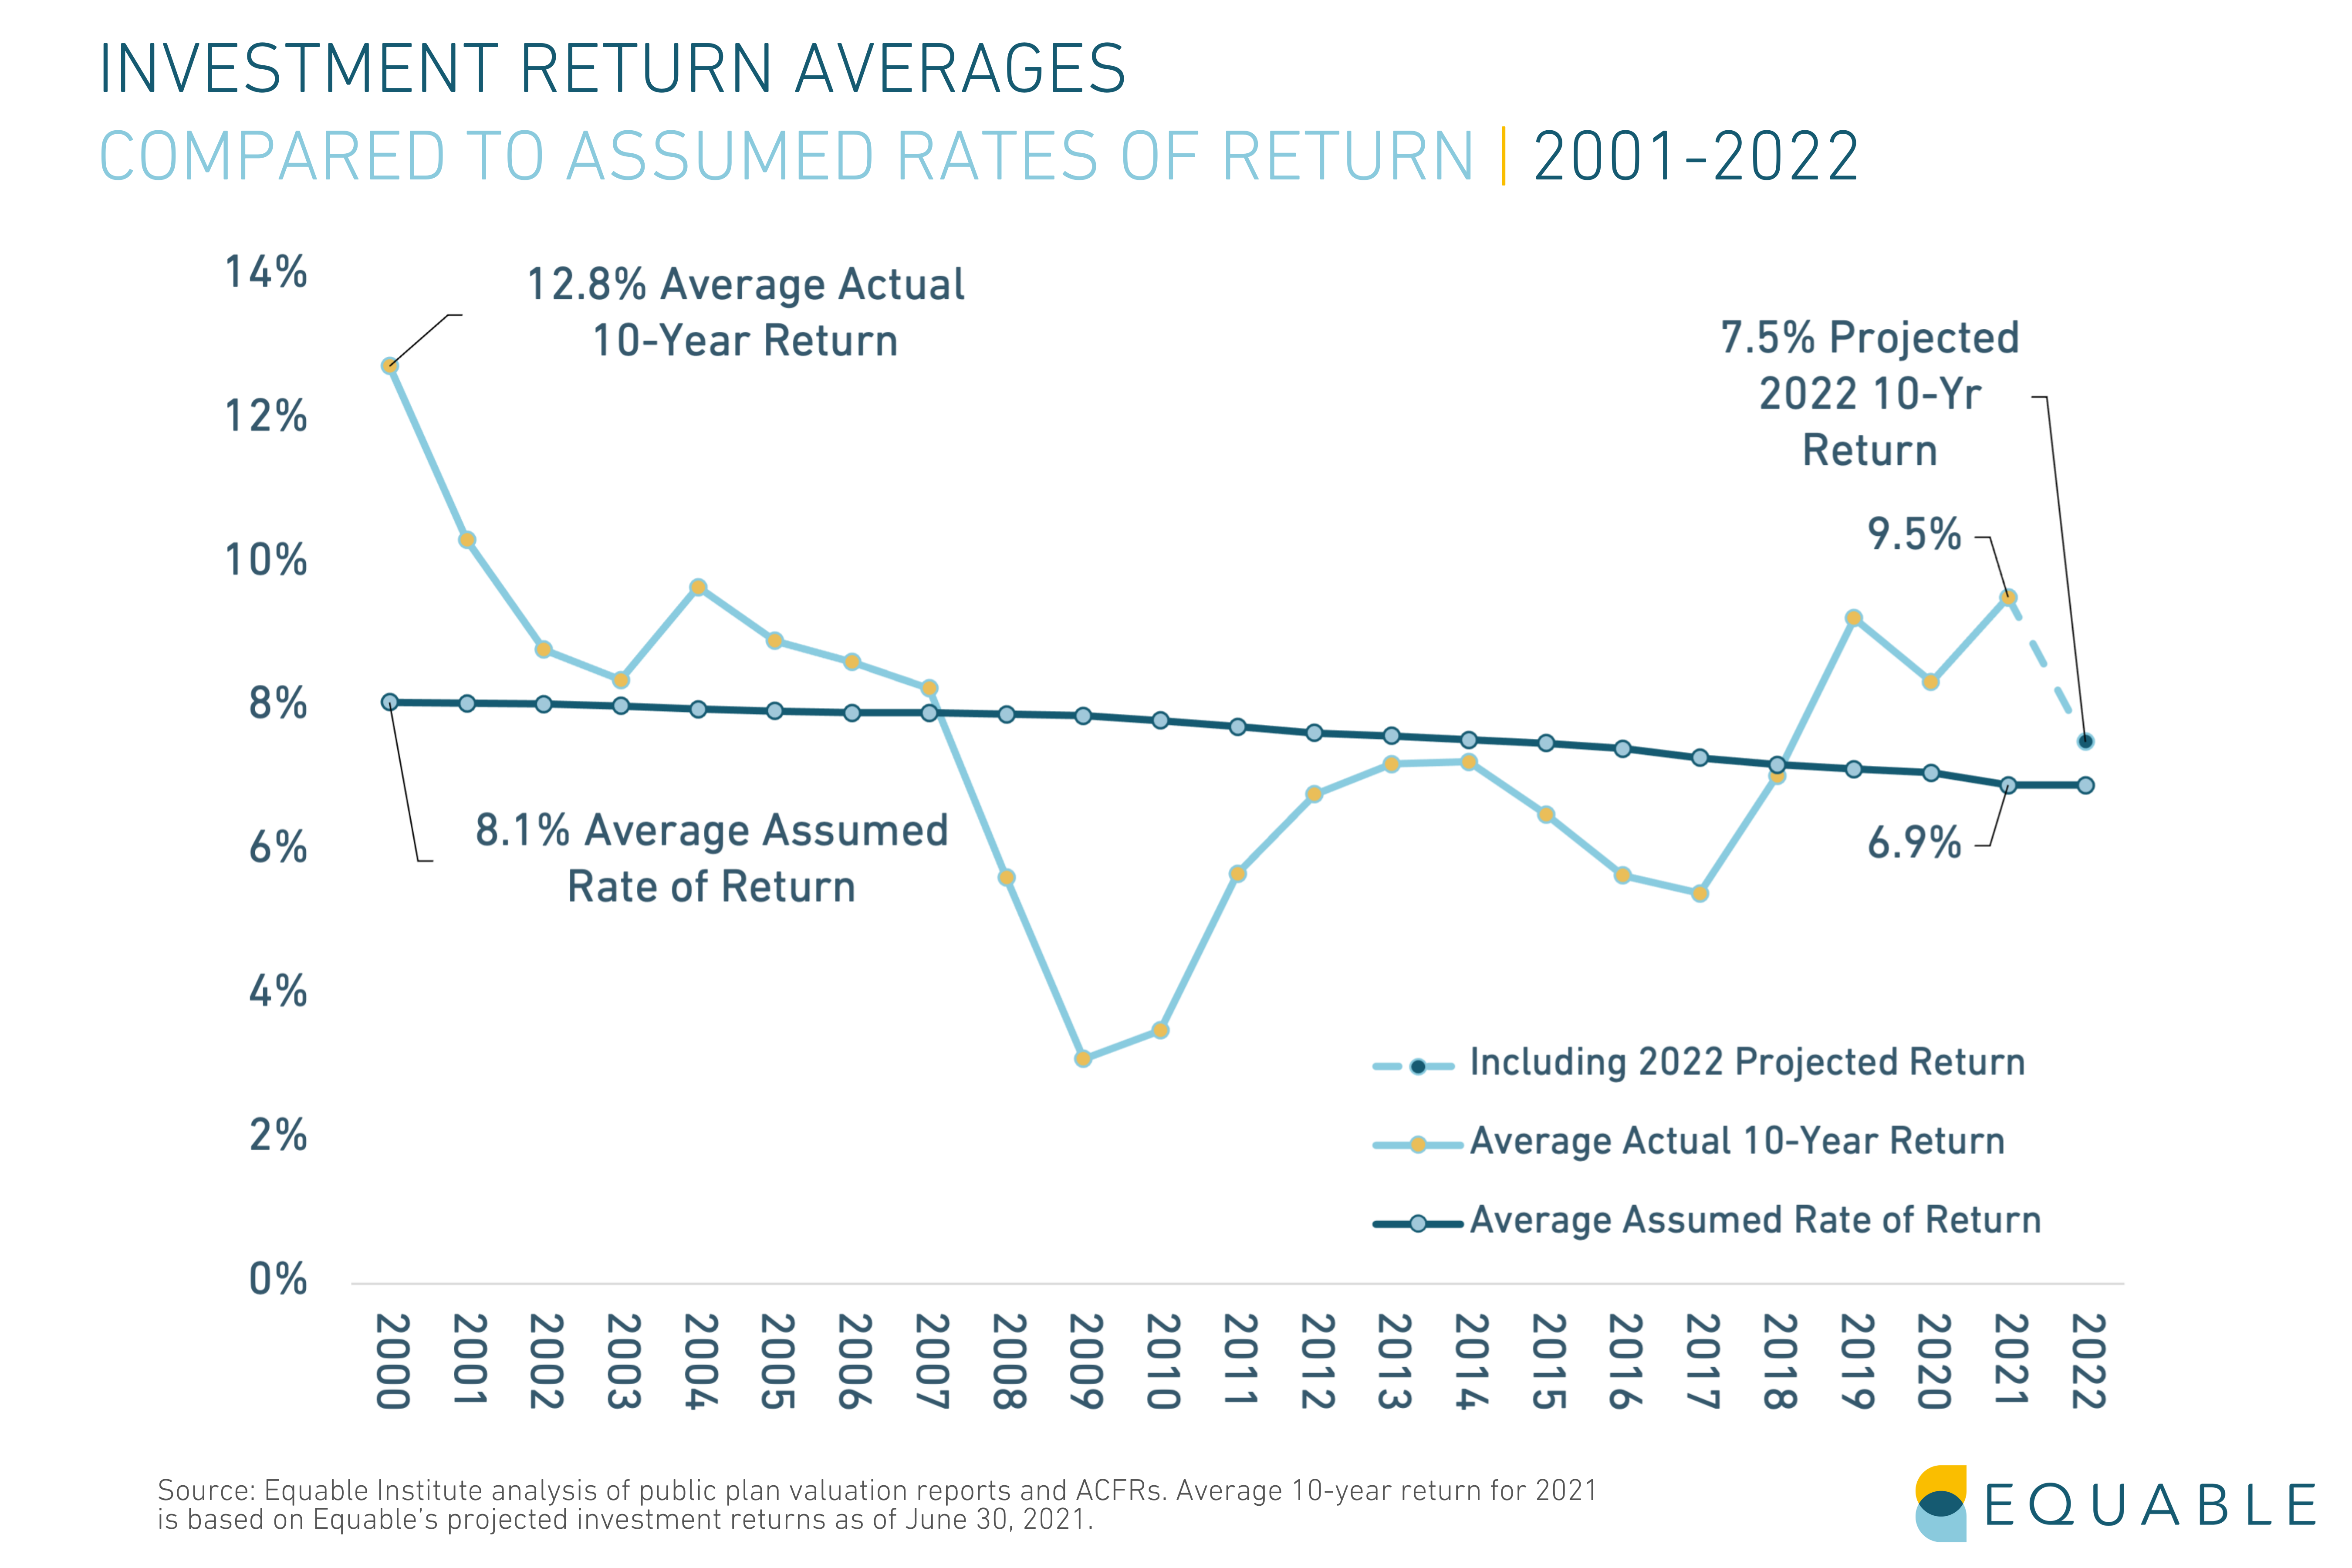
There has been a slow trend since the financial crisis of 2008-09 toward lower investment assumptions from public plans. Assumed rates of return were averaging 8% when the Great Recession hit. In the past two years have fallen below 7%.
This is generally good news. Over the last two decades the single largest contributor to the growth in unfunded liabilities has been underperforming investments. That is, states, cities, and counties were assuming unrealistic returns on their pension assets and by extension weren’t contributing enough to pay for promised benefits.
The current average of 6.9% is still overly optimistic for state and local pension funds. However, that average is likely to continue declining in coming years. New York State’s Common Fund — which manages assets for state agency workers, upstate cities, and public safety — is the third largest pension fund in the country, and last year lowered their assumed rate of return to 5.9%. The nation’s largest pension fund CalPERS lowered their investment assumption to 6.8% in 2021, and internal advisors have said they should be targeting 6%.
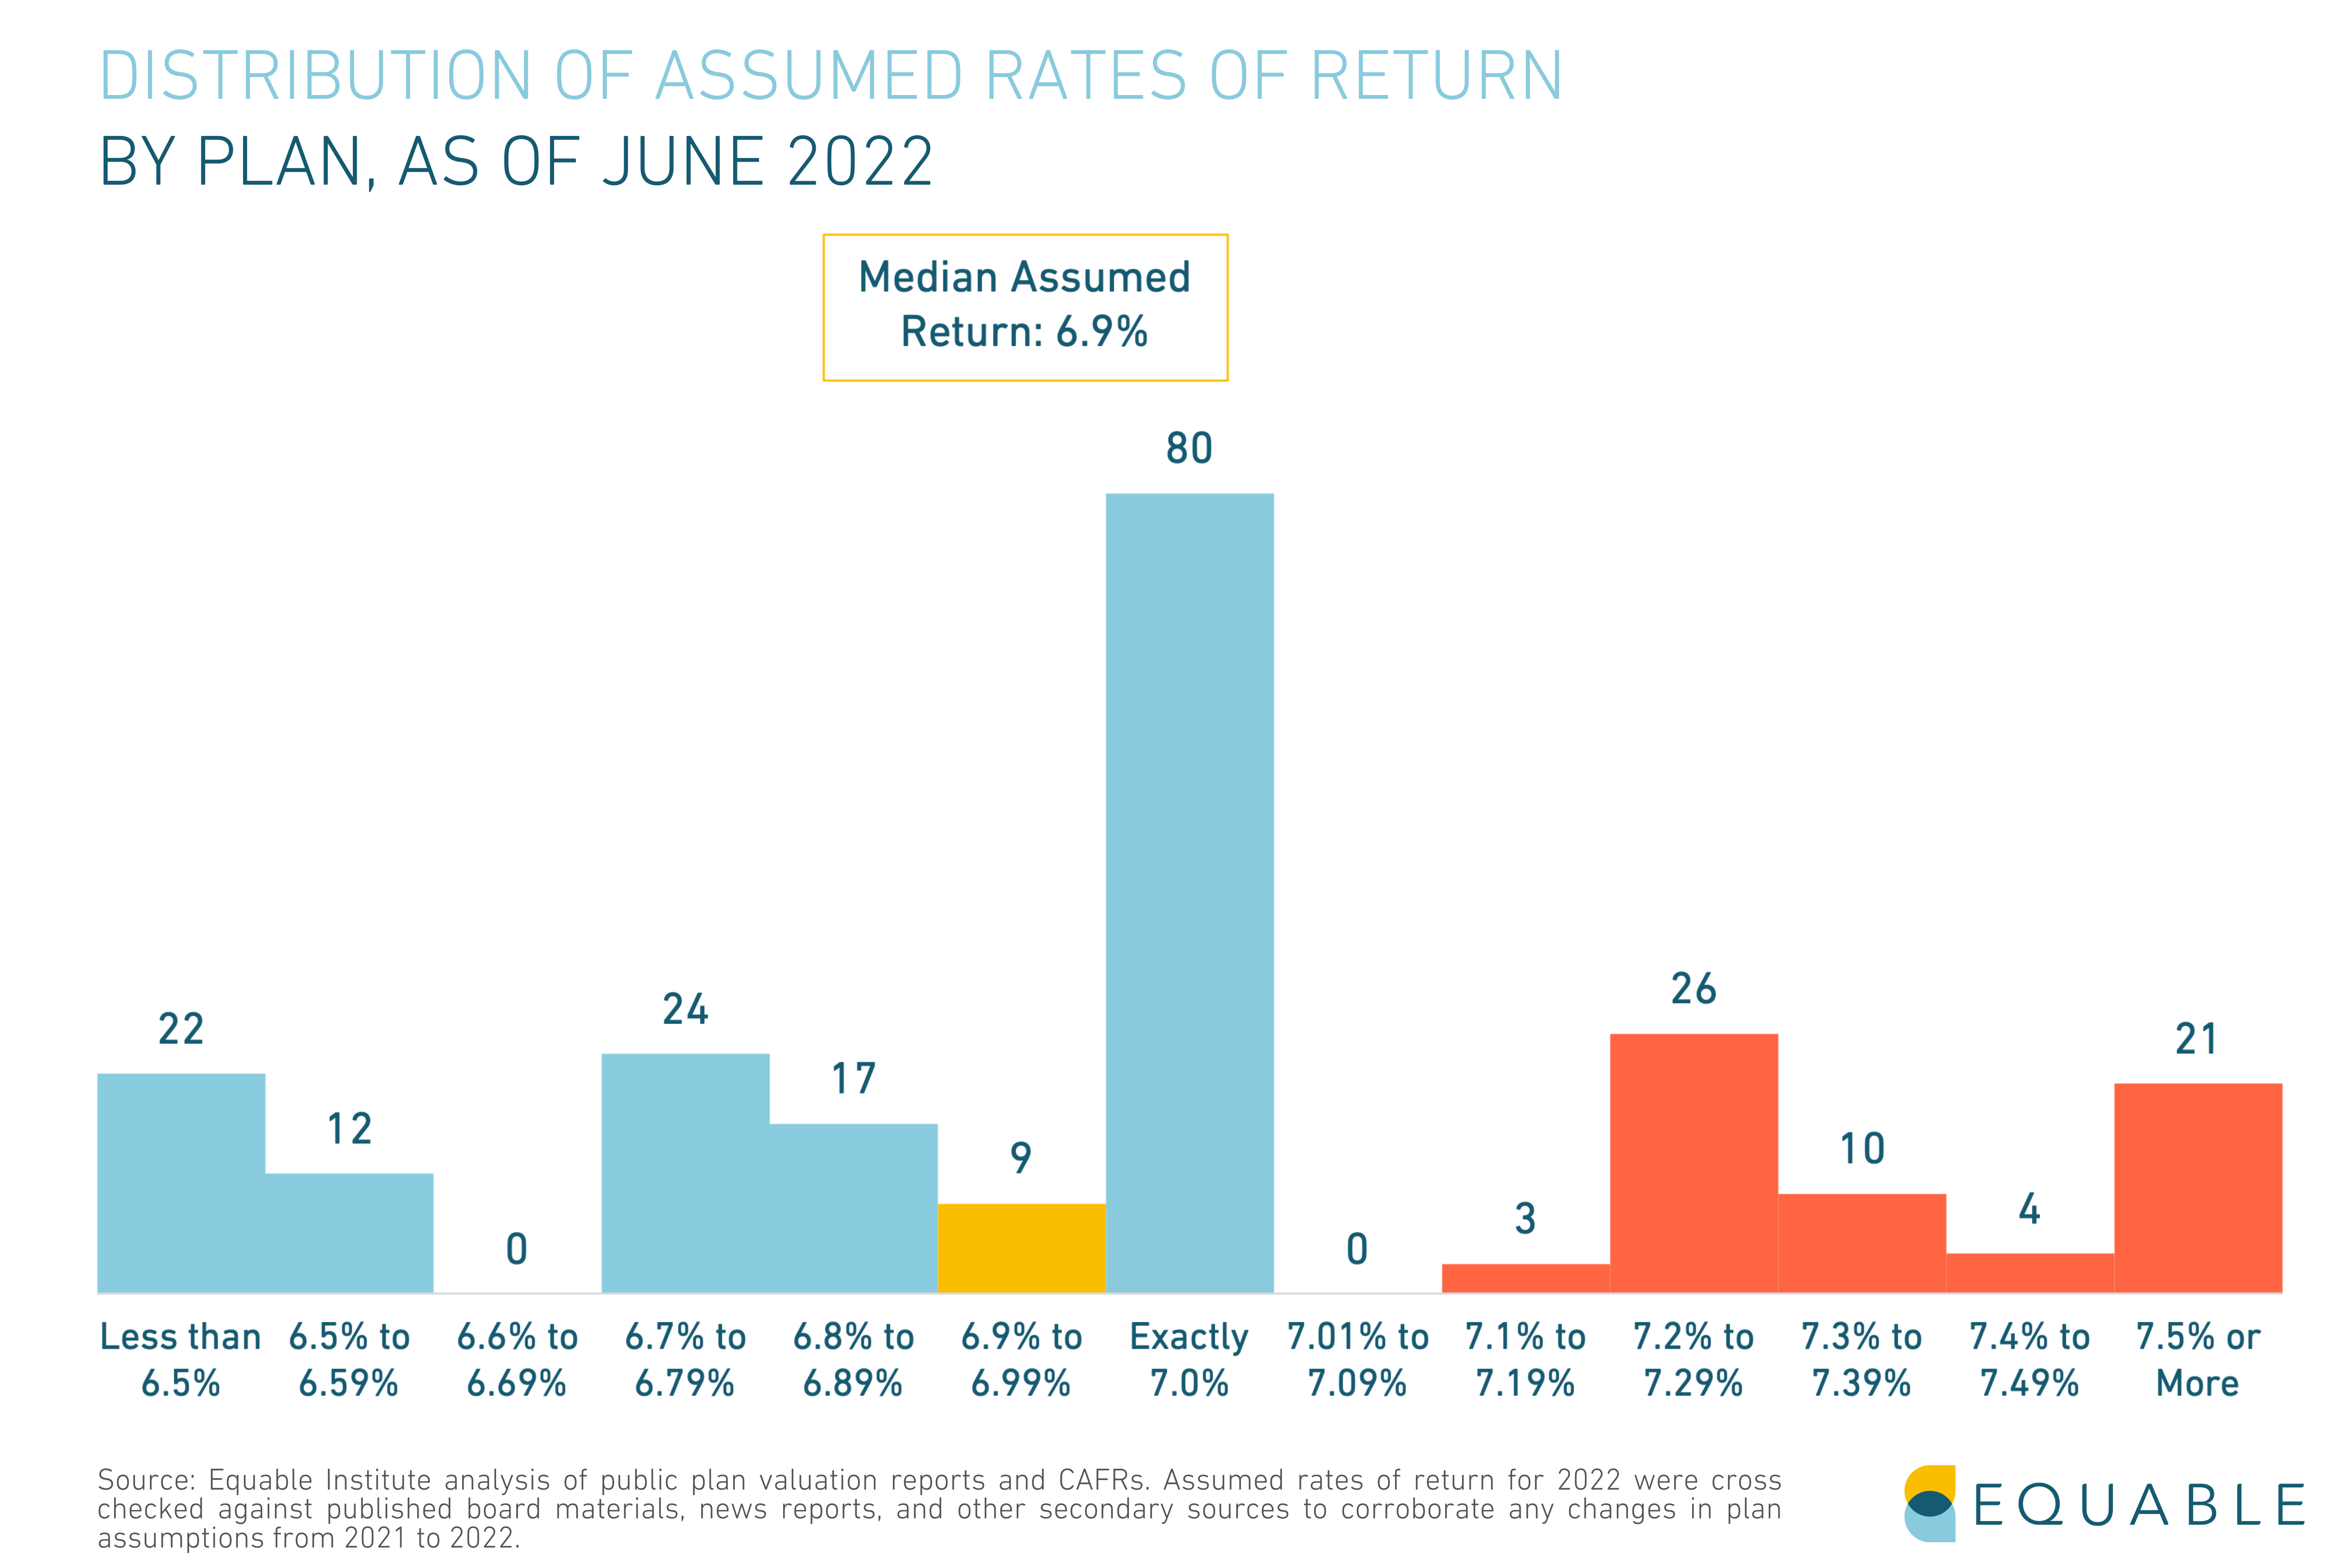
Distribution of Investment Assumptions, as of June 2022
The figure below shows the current distribution of assumed rates of return for the top state and local defined benefit plans.
Assumed Rates of Return by Retirement System
The following table provides a list of plans and their current assumed return. For an expandable table with data about previous assumed returns, investment management, and notes about known future changes, click here.
This table will be updated periodically as state plans announce changes to their assumed return via press release indicating that a board of trustees has voted to make a change, or when such a change is reported in a published actuarial valuation report.
What are the Historic Investment Assumption Trends?
State pension plans have adopted a wider range in assumptions over the past two decades. The lowest rate adopted by any plan open to new members is 5.25%. The highest rates currently used for a municipal plan is 8.25% (by Chicago Transit Authority) and for a state plan is 7.75% (by Mississippi).
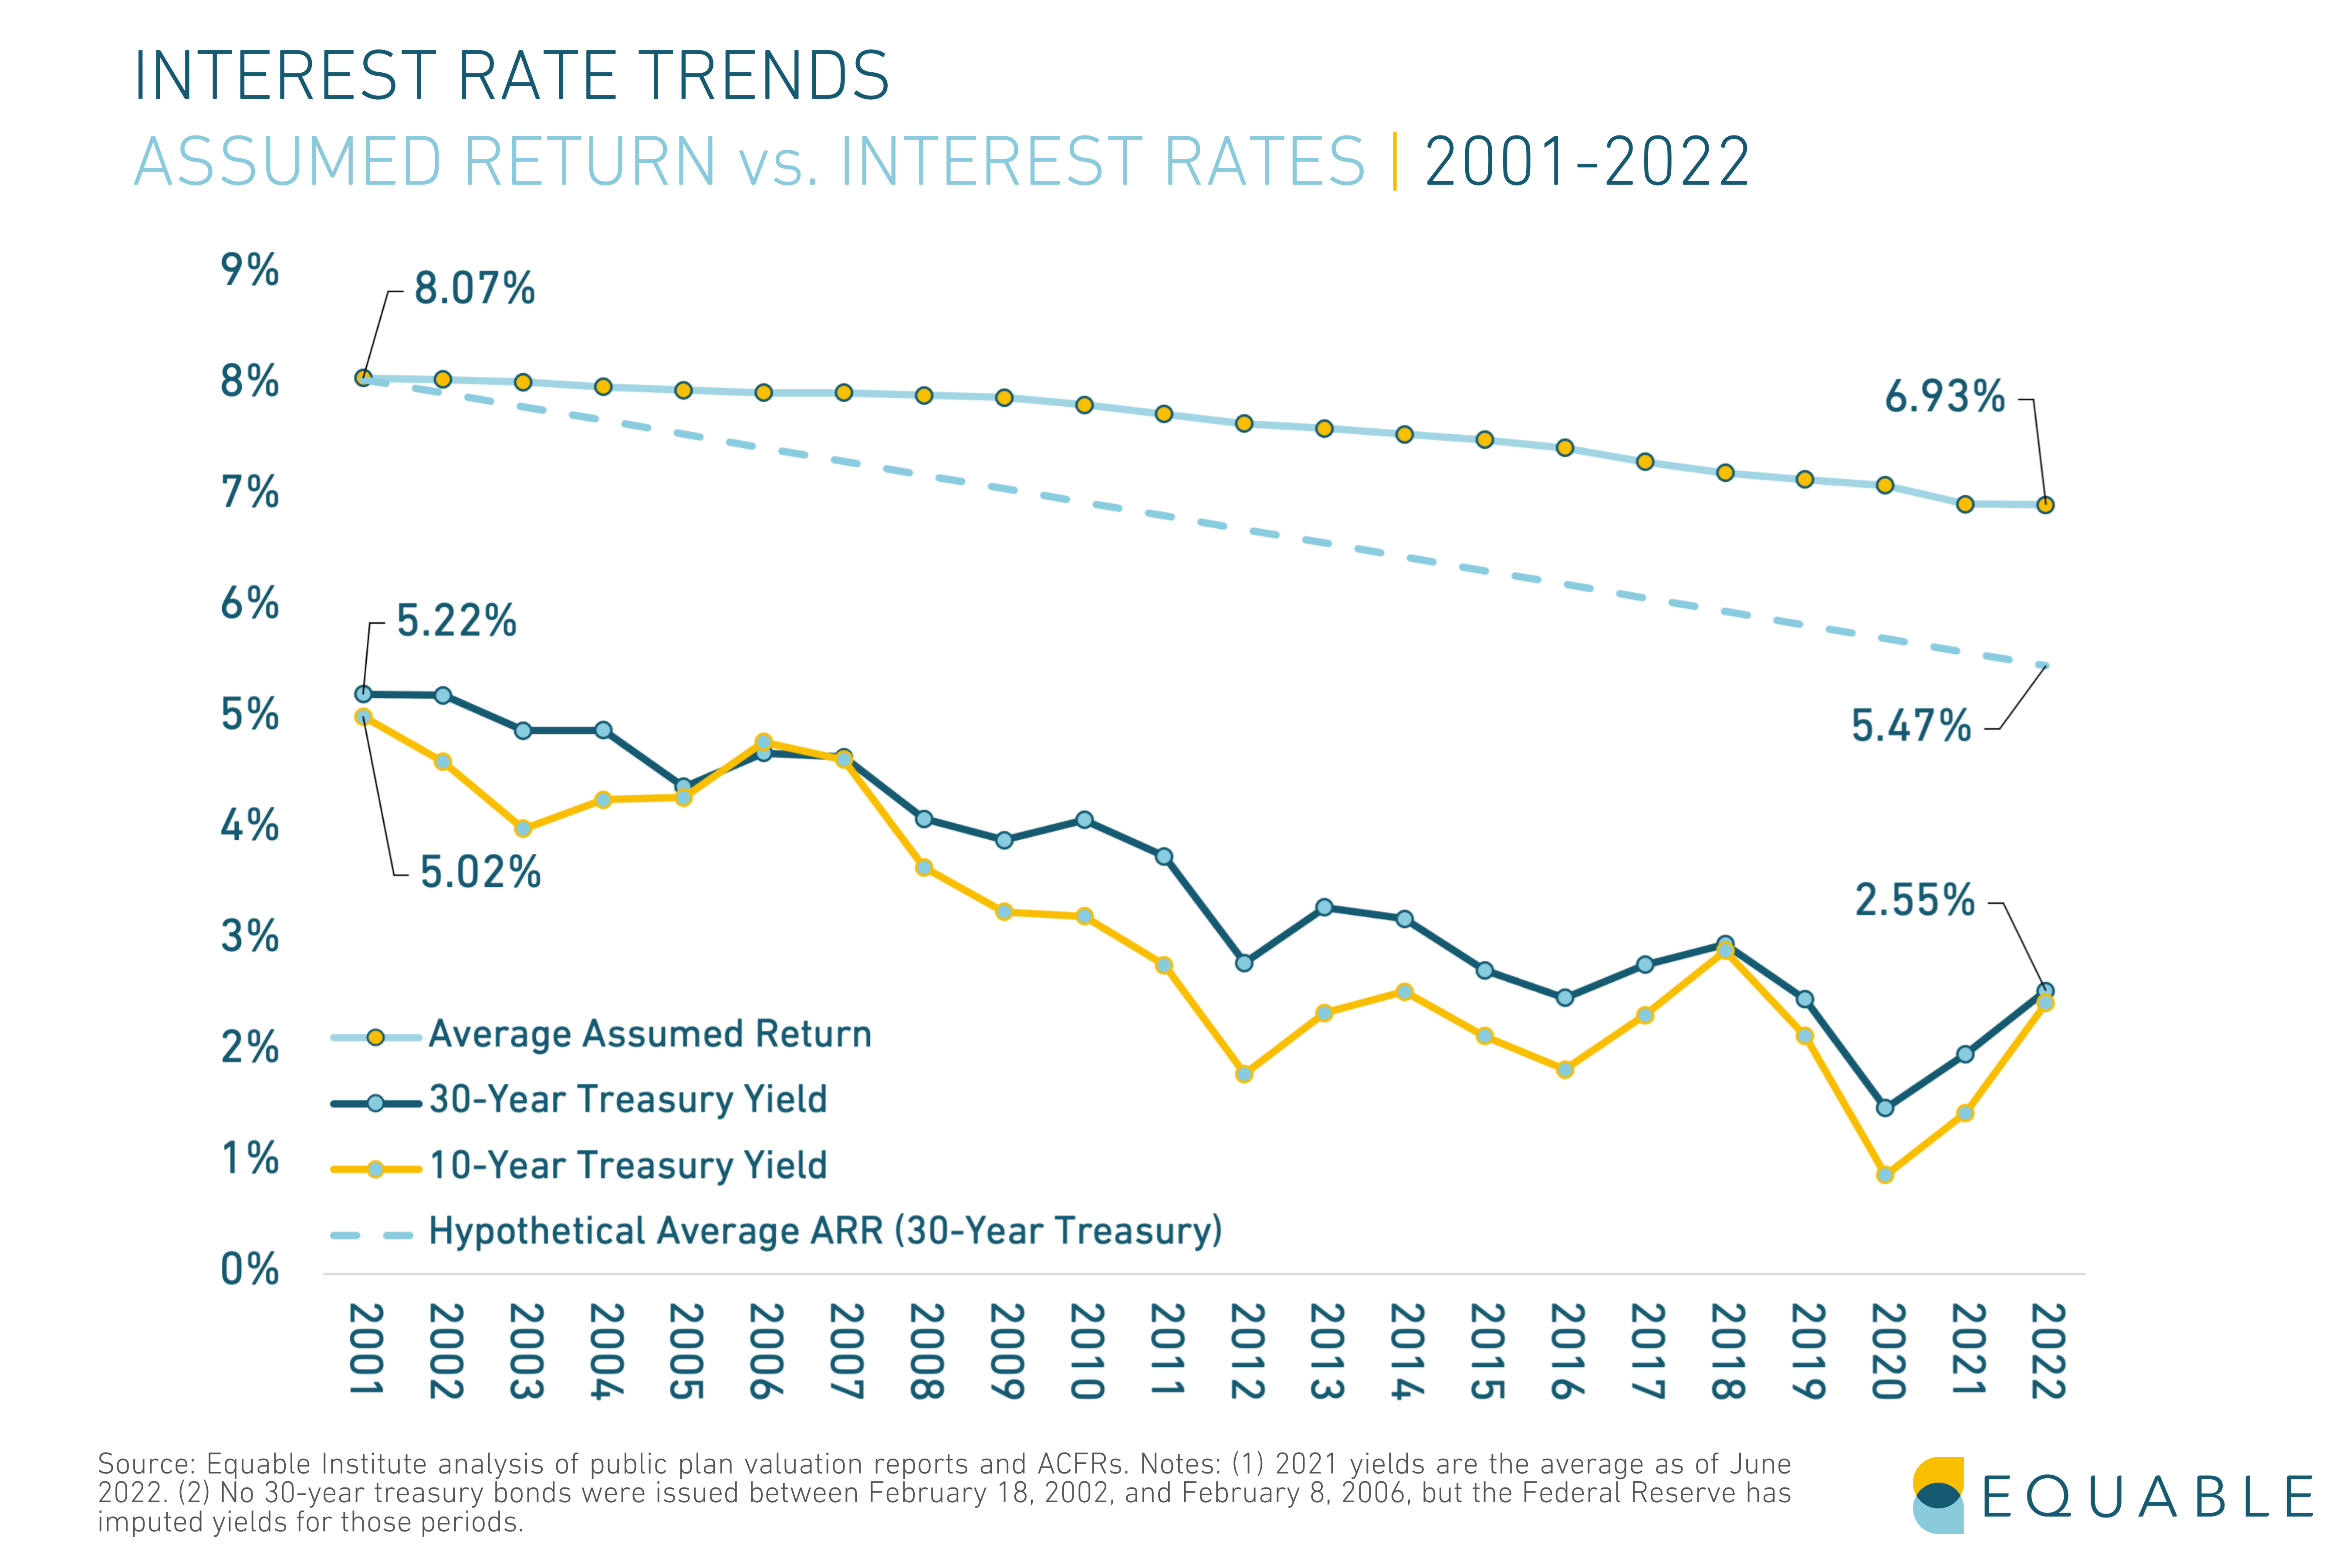
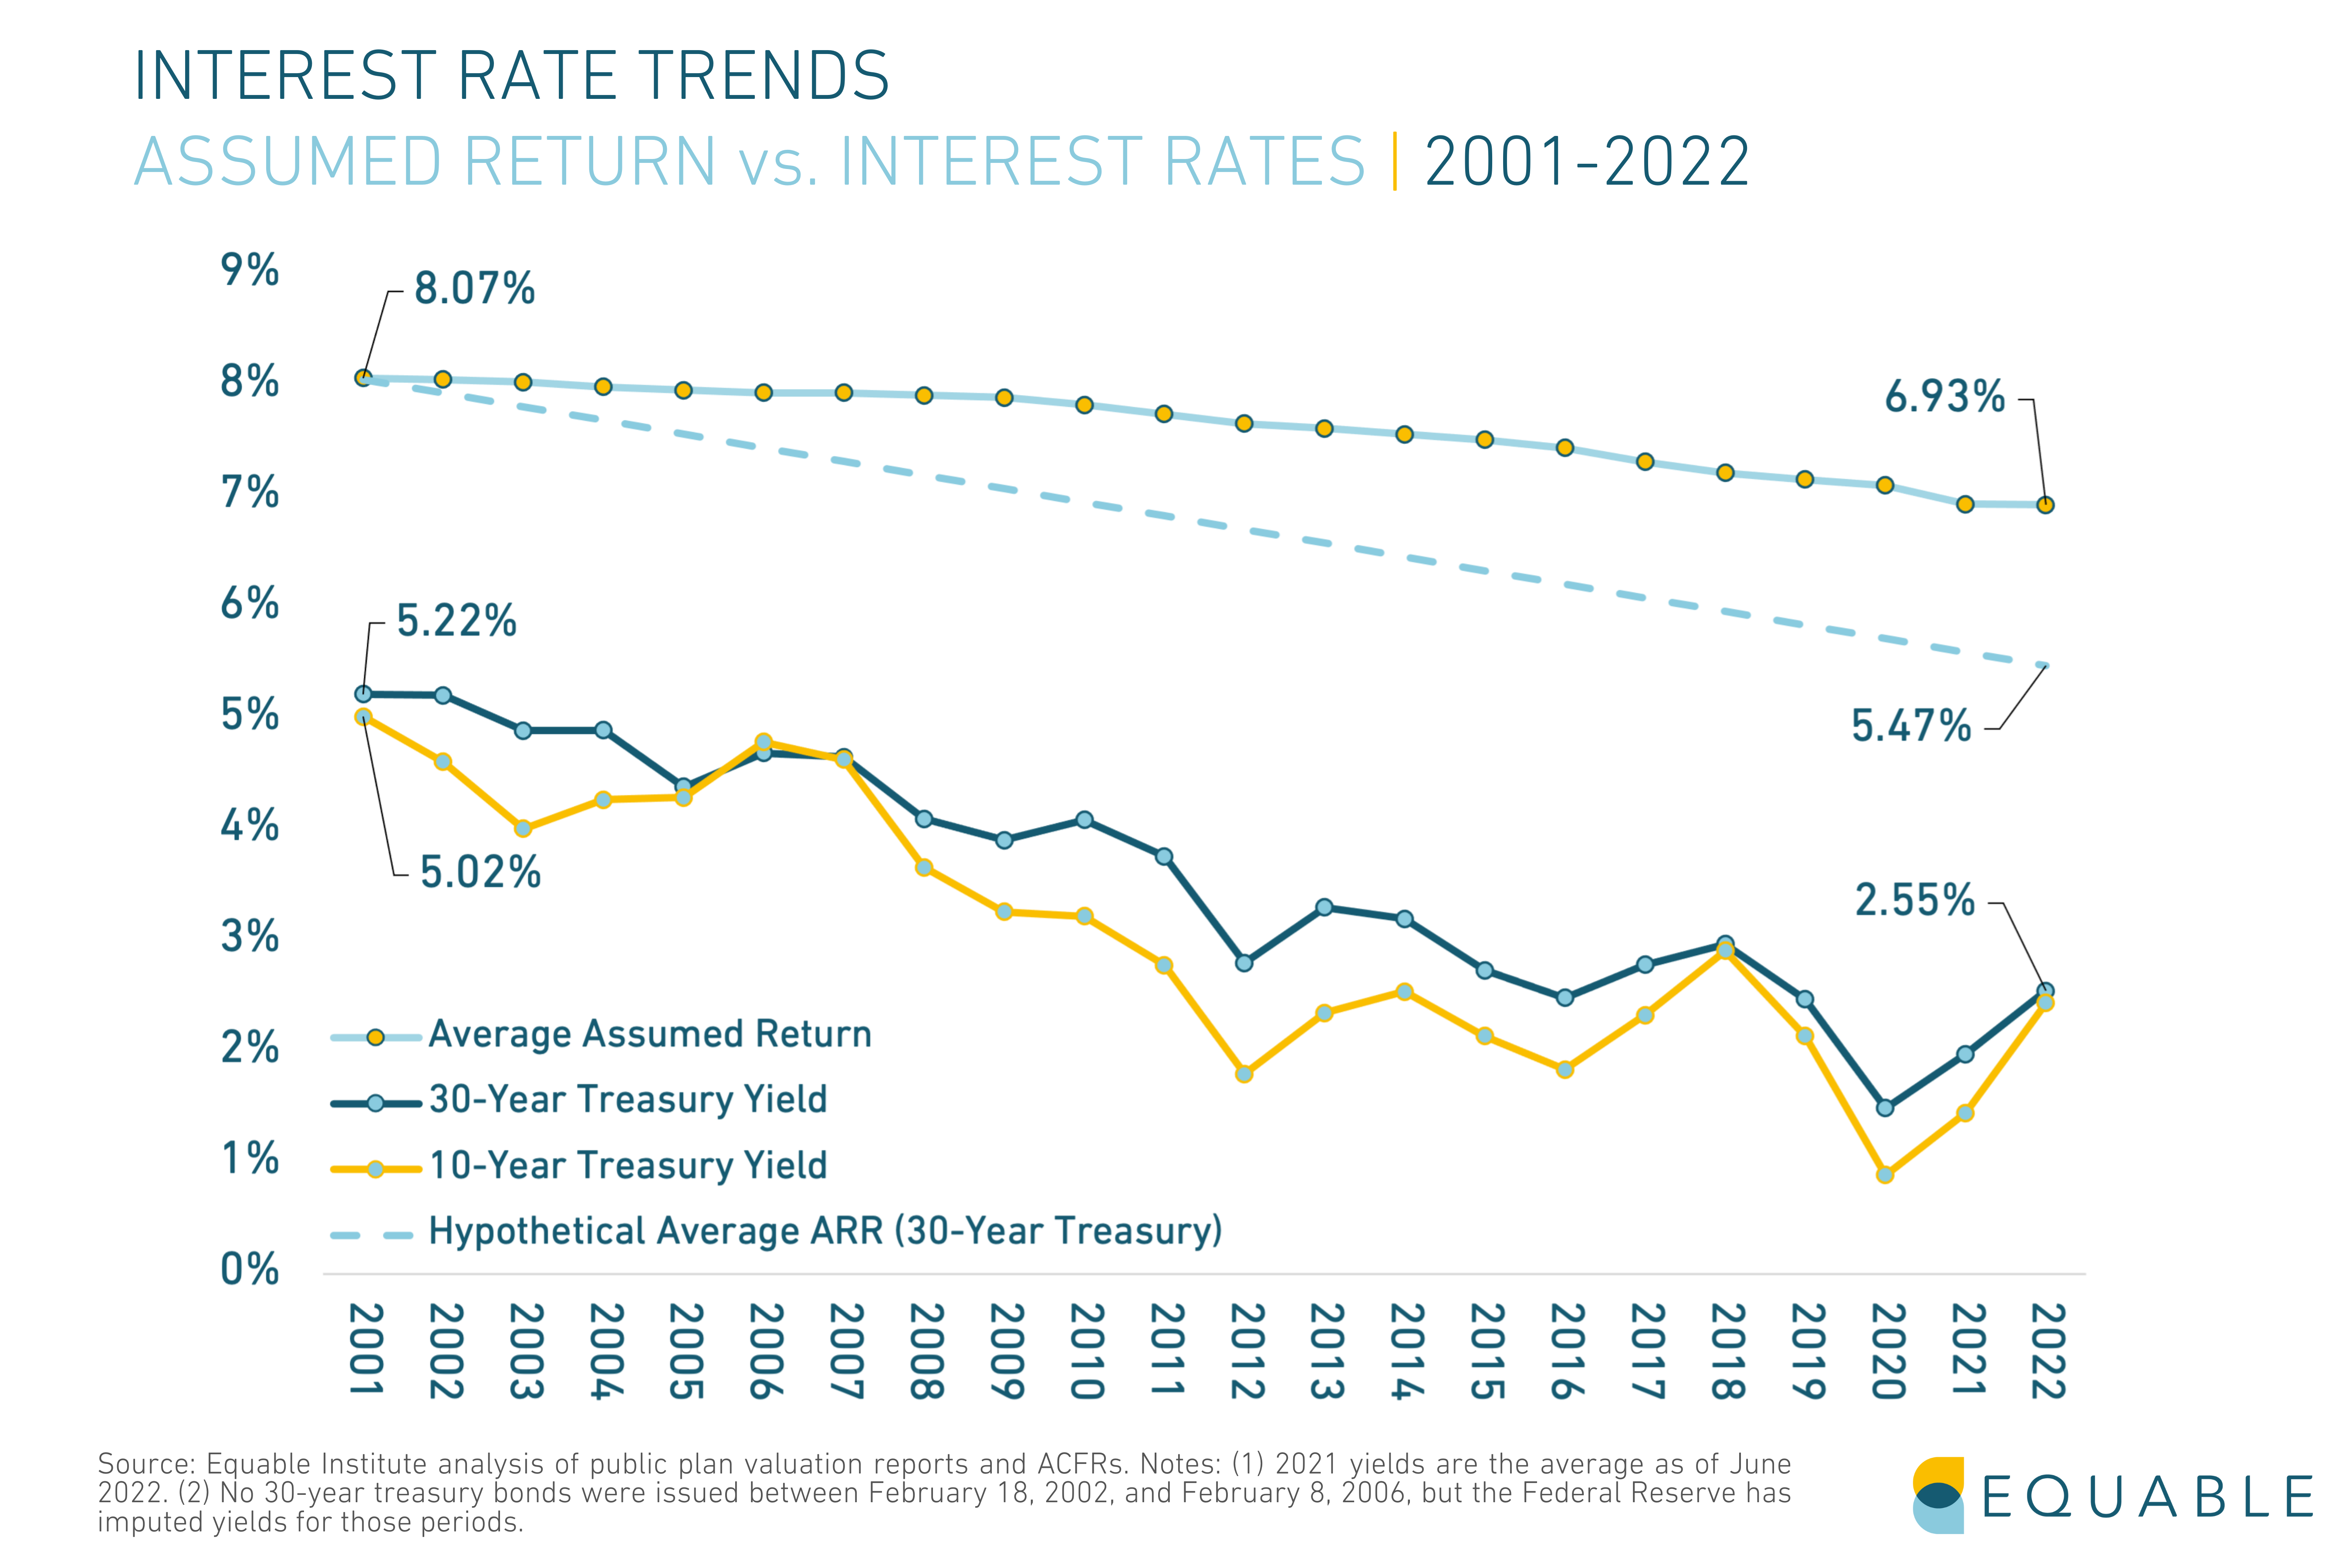
States and pension boards have been slower than they should have to reduce their investment assumptions. The growing gap between interest rates and assumed rates of return reflects as an increased amount of risk that pension funds accept. If assumptions had kept pace with declining interest rates since 2001, the average assumption in 2022 would have been around 5.47%.
Why are Assumed Rates of Return Important?
Assumed rate of return is the single most important assumption that pension systems. This assumption ensures they have enough funding to pay benefits promised. A pension fund and its actuaries make educated guesses about how much they think they can earn by investing contributions. That educated guess is called the assumed rate of return. The higher the assumed rate of return, the fewer contributions teachers and their employers have to make. The lower the assumed rate of return, the higher contributions need to be in order to pay for the benefits promised. Read more about this important investment assumption in our Pension Basics series.
Teacher Pension COLAs in 2022
A key feature of teacher pension plans is that they offer guaranteed income for life. But unless the purchasing power of that pension income keeps up with inflation, the guarantee doesn’t necessary provide ensured financial security. That is why many defined benefit pensions for teachers come with cost-of-living adjustments, or COLAs.
However, just because there are many plans with COLAs doesn’t mean there is widespread protection from inflation.
The average COLA provided by teacher pension plans this year has been 1.8%.[1] This is effectively the same as the average cost-of-living adjustment offered to all public pension plan retirees.
The 1.8% figure is well below most measures of actual price inflation in 2022. That is because many COLA policies do not exactly match inflation. Instead COLA rules have maximum rates (e.g., increasing at the rate of inflation up to 2%) or they are linked to other factors (e.g., a 2% COLA, but only if the pension fund for base benefits has adequate resources).
There are some reasonable financial reasons for these rules. Some years retired teachers get COLAs that are actually larger than inflation. However, the net effect in 2021 and 2022 has been that public pension COLAs frequently are less than inflation.
Teacher pension COLAs vary in how much inflation protection they provide, and in who gets the benefit adjustments. In this article, we explain some of the different kinds of cost-of-living adjustments provided to retirees from public employee pension funds.
First, here is a list of teacher pension plans and classes of benefits and the COLAs they’ve provided in 2022.
Not all teacher pension COLAs are created equal. If you are trying to determine whether or not a COLA is adequate enough to maintain the spending power of your retirement benefits, you should consider the following elements of your plan’s COLA policy:
1. Compounding versus Non-Compounding Benefits
Retirement funds have two ways of adjusting underlying benefits when paying out teacher public pension COLAs.
Compounding Benefits: Retirement funds permanently adjust the base benefit and add any any future changes to benefits on top.
For example, someone with a $40,000 pension that gets a 2% COLA will have their base benefit increased to $40,800. The next year, if inflation means a 1.5% COLA, then the adjustment is calculated based on the new, higher number. So in this case, the benefit would increase to $41,412.
Non-Compounding Benefits: This means that all inflation adjustments are based on the original pension benefit value. Each year benefits increase, you get to keep the adjustment from the previous year. But, the percentage increase is based on your original pension.
For example, a former teacher with a $40,000 pension that got a 2% COLA would see $800 added on top for a total pension of $40,800. The next year, a 1.5% COLA would be calculated on the original $40,000 pension. $600 would then be added on top for a total pension of $41,200.
2. Three Types of Automatic Public Pension COLAs
There are generally three policy frameworks for those teachers who do have automatically granted COLAs that protect public worker pensions from inflation:
- Fixed-Rate COLAs: A pre-fixed specific percentage of benefit increase (or minimum dollar amount).
- COLAs Linked to Inflation: A percentage increase to benefits based on the national consumer price index (CPI), a local CPI, or the Social Security inflation rate. The actual amount is typically “up to” a maximum rate, such as 2% or 3%.
- COLAs Linked to Plan Performance: A percentage increase to benefits that is dependent on the funded ratio and/or investment performance of the underlying pension plan. The actual amount is also typically “up to” a maximum rate, but that maximum rate is determined by the specific provisions around plan performance. For example, the maximum COLA rate may be cut in half or suspended if the pension fund is under 80%.
Some state pension funds have inflation adjustments linked to both inflation and pension plan performance.
3. Ad Hoc Cost-of-Living Adjustments
There are a number of teacher pension plans that do not provide consistent inflation protection. Some of these states have no legal provisions to offer COLAs. Other states only payout COLAs if the legislature authorizes the benefit adjustment. Because COLAs are not legally required in these states, they are called “ad hoc” COLAs. These COLAS are also heavily dependent on local politics and legislative budgets.
Note [1]: This is an average of 158 classes of defined benefits, including actual reported percentage rates adjusting benefits starting in the 2022 calendar year and percentage rates based on published COLA policies.
Is There a Pension Crisis in the US?
Is there a state pension crisis in the United States?
The short answer is no. Despite headlines claiming that state pension funds are in trouble, there is no widespread crisis of public pension plans facing the prospect of near-term insolvency or bankruptcy.
However, there are many states and pension plans that face dire long-term sustainability challenges. These can come with serious ramifications if they continue to go unaddressed. There are many communities who are suffering today from the effects of unsustainable increases in costs for paying off pension debt.
That being said, a longer and more complete answer must define “crisis” in the context of state or local pension plans.
There is no shortage of commentators arguing that there is currently a US public pension crisis. Though exactly what that crisis might be depends on who you ask.
Some have said pensions will soon go bankrupt. Others have said pensioners (or retirees) are at risk of plunging into poverty. While others have focused on investment mismanagement of pension assets. Often the concept of a “pension crisis” is mixed with a “retirement crisis.” The latter of which is a more general concern about if Americans are saving enough for retirement.
In this article, we break down some of the different metrics we use to measure the health of pension funds. We use actual data to determine whether or not there is a state pension crisis in the United States.
Ultimately, our assessment of the data shows there is no near-term “solvency” crisis for most state pension funds. However, there is a “sustainability” crisis in many states. Specifically, this “crisis” threatens states, cities, and counties where growing contribution rate requirements threaten a range of public services such as school programs, infrastructure programs, defenses against the effects of climate change, public housing programs, and more.
Ways to Define a Public Pension Crisis
There are multiple ways to think about whether a public defined benefit pension plan could be facing a “crisis”:
- Near-term Insolvency Crisis: Is the pension fund at risk of running out of money to pay benefits in the next 2, 5, or 10 years?
- Long-term Insolvency Crisis: Is the pension fund at risk of running out of money at some point in the future? Several decades from now, but still forecast to one day become insolvent/go bankrupt?
- Management Crisis: Are the pension fund’s trustees mismanaging assets? This includes using very risky investment strategies or paying out very high fees without a reasonable return.
- Retirement Crisis: Are retirees in general at risk of falling into poverty because of a lack of adequate pension benefits?
- Budgetary Cost Crisis: Are the costs of paying for the unfunded liabilities of pension plans “crowding out” or threatening other public goods and services?
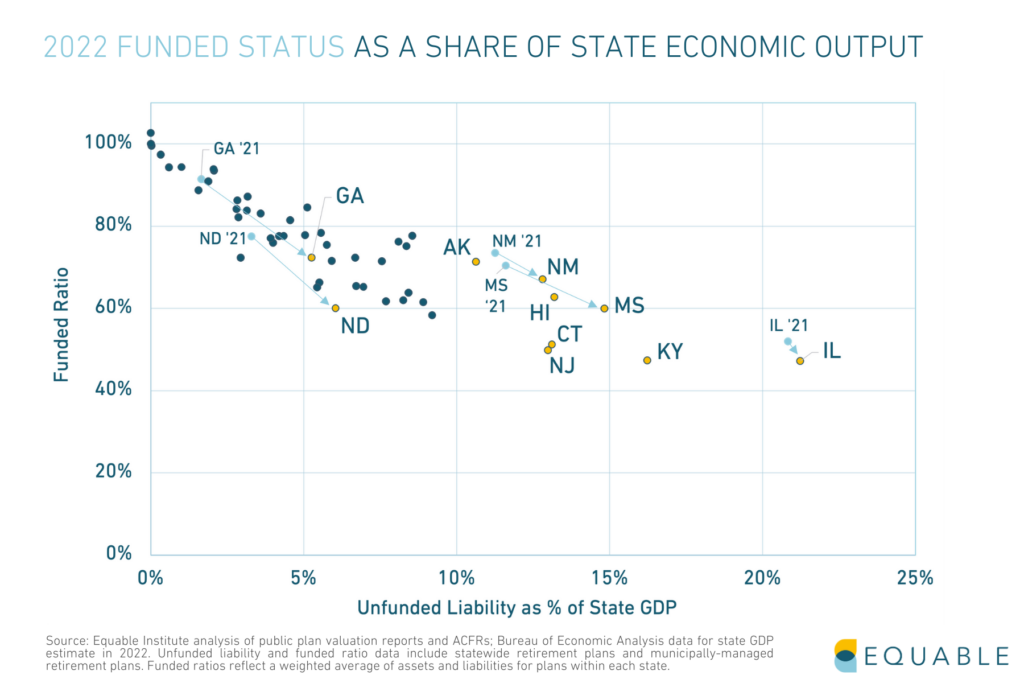
- Sustainability Crisis: Are the costs of a pension fund growing so large as a share of government budgets or state GDP that future taxpayers are unlikely to be able to adequately provide funding to a pension plan?
What the Data Says: Public Pension Insolvency Concerns
First, let’s look at the financial data on the solvency of pension funds in the United States. In this context, a “solvent” pension fund is one that has enough money on hand to pay out all promised benefits for at least a year.
This isn’t a very high standard to meet. The lower the assets in a pension fund, the more likely it is at some point to become insolvent. But as long as there are assets, in theory, a pension fund can generate investments returns on their money. They can also continue to receive contributions from government employers and members.
So how many pension funds in America today at risk of near-term or long-term insolvency? Somewhere between 10% and 20% of the largest state and local pension plans in the United States are at risk.
That number is based on an estimate from a group of retirement policy experts using data from 2019. This group defined two levels of extreme risk for pension fund solvency:
- “Deep Red”: Projected to become insolvent in 20 years; AND the ratio of inactive to active participants is more than 2 to 1, OR the plan is less than 80 percent funded.
- “Red”: Received less than 100 percent of the actuarially determined contribution (ADC) over the past 5 years; AND the funded ratio is under 65 percent.
Plans Designated as Deep Red Zone or Red Zone
| wdt_ID | Plan Name | Risk Zone | Funded Ratio | Percent of ADC paid over prior 5 years | Ratio of active employees to beneficiaries | Ratio of contributions to normal cost plus UAAL interest | Ratio of Non- Investment Cash Flow to Beginning of Year Assets (%) |
|---|---|---|---|---|---|---|---|
| 1 | Arizona State Corrections Officers | Red | 52 | 84 | 88.00 | 0.77 | 68.00 |
| 2 | Charleston (WV) Firemen's Pension | Red | 13 | 78 | 264.00 | 86.00 | 462.00 |
| 3 | Chicago Fire | Red | 21 | 81 | 114.00 | 92.00 | 410.00 |
| 4 | Chicago Police | Red | 24 | 73 | 116.00 | 83.00 | 21.00 |
| 5 | Chicago Teachers | Red | 48 | 90 | 126.00 | 80.00 | -479.00 |
| 6 | Colorado School | Red | 63 | 81 | 75.00 | 82.00 | -344.00 |
| 7 | Colorado State | Red | 61 | 83 | 93.00 | 83.00 | -434.00 |
| 8 | Denver Employees | Red | 62 | 99 | 155.00 | 101.00 | -305.00 |
| 9 | Hawaii ERS | Red | 58 | 86 | 90.00 | 82.00 | -115.00 |
| 10 | Illinois SERS | Red | 41 | 83 | 127.00 | 89.00 | -65.00 |
| Plan Name | Risk Zone | Funded Ratio | Percent of ADC paid over prior 5 years | Ratio of active employees to beneficiaries | Ratio of contributions to normal cost plus UAAL interest | Ratio of Non- Investment Cash Flow to Beginning of Year Assets (%) |
Source: Urban Institute
What the Data Says: Pension Management Crisis
A common concern for public pension plan is that they pay out too much in fees.
There is no question that this is a real concern. For example, a Pennsylvania state commission issued a report running nearly 400 pages to consider best practices and management of their statewide retirement systems. One of the key focuses of that report was the fees paid by the state’s pension plans. Another example is New York City, whose comptroller once found compelling data revealing that after accounting for fees, city pension plans were underperforming.
A related concern is that investment managers for pension funds adopt “bogus benchmarks” to measure themselves against. Every pension fund wants to measure how well its investments are performing. How they should do that is a subject of debate. However, every pension fund adopts a set of “benchmarks” to grade their performance against. Typically these benchmarks are widely available measurements of how other investors have performed or how financial markets as a whole have performed. For example, if the entire S&P 500 stock market index gained 5% but a specific pension fund gained 4%, then the fund underperformed relative to that benchmark.
The criticism leveled against state and local pension funds is that they choose benchmarks that are too easy to over perform against. This allows pension funds to avoid making important and difficult decisions about ways they could improve their investment strategy.
While there are reasonable concerns about both investment management fees and benchmarking policy, are these creating a “crisis” for pension funds? It depends on how broadly the word “crisis” should be used. In general fees are not the reason that pension funds have a more than $1 trillion funding shortfall, as of 2022 data.
Equable analyzed the sources of unfunded liabilities accumulated between 2000 (when state and local pension plans were last effectively fully funded on average) and 2019 (before the pandemic). We found that 41% of their reported unfunded liabilities were from underperforming investments, after accounting for fees.
Put another way, pension funds over the past two decades assumed that they could earn investment returns between 7% and 8% a year on average. But they didn’t. And the underperformance against this expectation created over $567 billion in pension debt between 2000 and 2019 for the largest state pension plans. So if there is a “management crisis” for pension funds it is the use of unrealistic assumed rates of return.
For example:
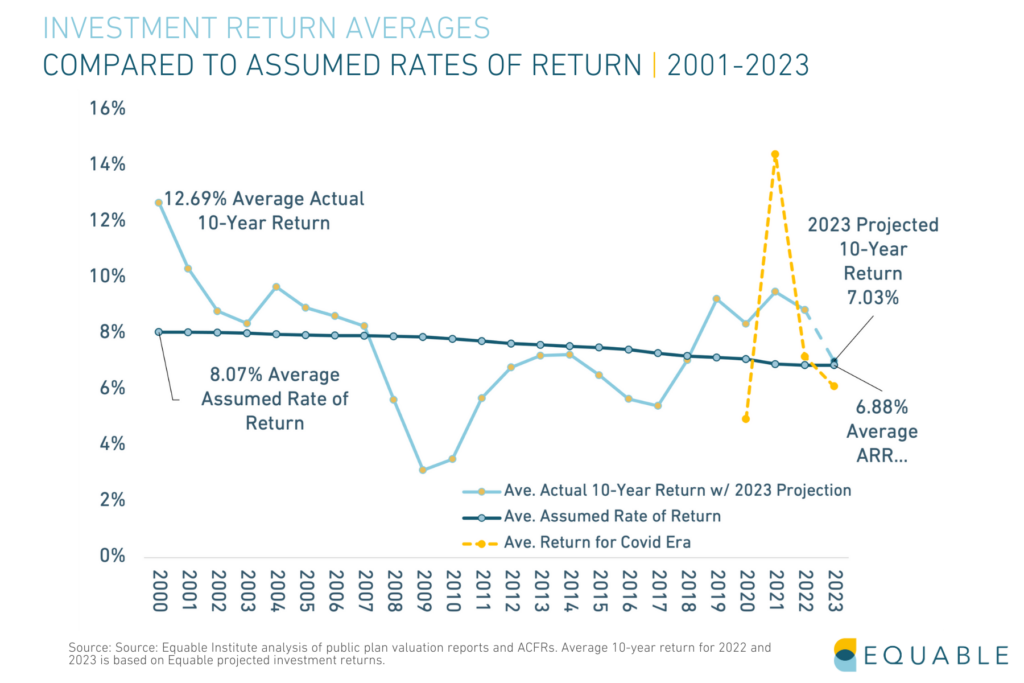
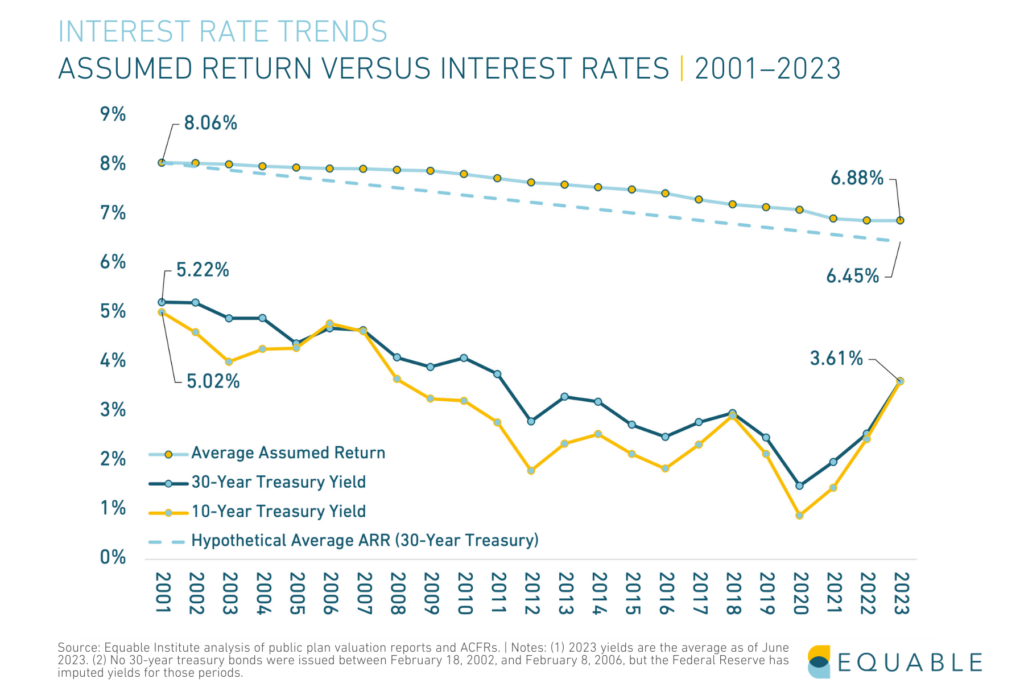
The chart below shows the average assumed rate of return for state and local pension funds over the past two decades (the light blue line). For comparison, we also show how interest rates have changed over the same period, whether considering the 10-year treasury yield (yellow line) or 30-year yield (dark blue line).
The difference between interest rates and the assumed rate of return reflects how much pension funds think they can get by taking risks with their investments beyond just buying perfectly safe U.S. Treasury bonds. If pension funds had maintained a consistent attitude toward their risk as they did back in 2001, then the average assumed rate of return in 2022 should be somewhere around 5.5% (see the dashed light blue line). However, the trustees managing state pension funds have taken on more risk with their investments. They have adopted unrealistic assumed rates of return on those investments, all in order to keep their costs down. If there is a “crisis,” it is there.
What the Data Says: Public Retirement Crisis
Are people saving enough for retirement? Recent analysis of retirement savings for private sector individuals who don’t have pensions suggests that they might not be. There are some common counter arguments to this concern that point out Social Security benefits are actually better than many people understand, particularly for retirees on the poverty line. And Social Security benefits are set to receive a very large inflation adjustment in the coming year.
However, the general concerns about a “retirement crisis” that get circulated in the media are almost uniformly about the private sector. There is very little concern about retirement income values for those who have a public sector pension.
There is no “crisis” of retirement income values for public sector retirees. But, that doesn’t mean there are no reasonable concerns. Equable recently analyzed the value of retirement plans for new teachers, and found that since 2005 states have systematically cut the value of pension benefits for new hires.
What the Data Says: State Budget Cost Crisis
If there is any “crisis” for pension plans, it starts with the costs of paying for growing unfunded liabilities. State and local pension funds reported more than $1 trillion in unfunded liabilities in 2020. They reported just under $1 trillion in funding shortfall for 2021. Once 2022 numbers are formally reported, the unfunded liabilities for pension funds will be back over the $1 trillion mark. Reaching this point has meant higher costs for states, cities, and school districts.
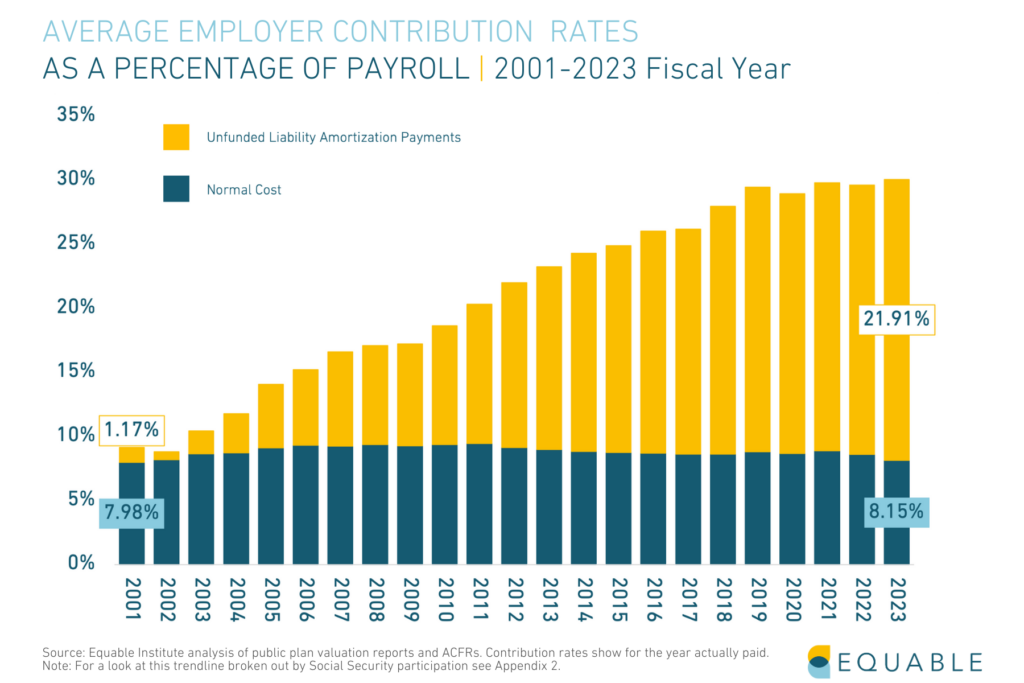
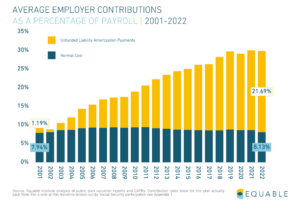
The figure below shows the contribution rates paid by government employers.
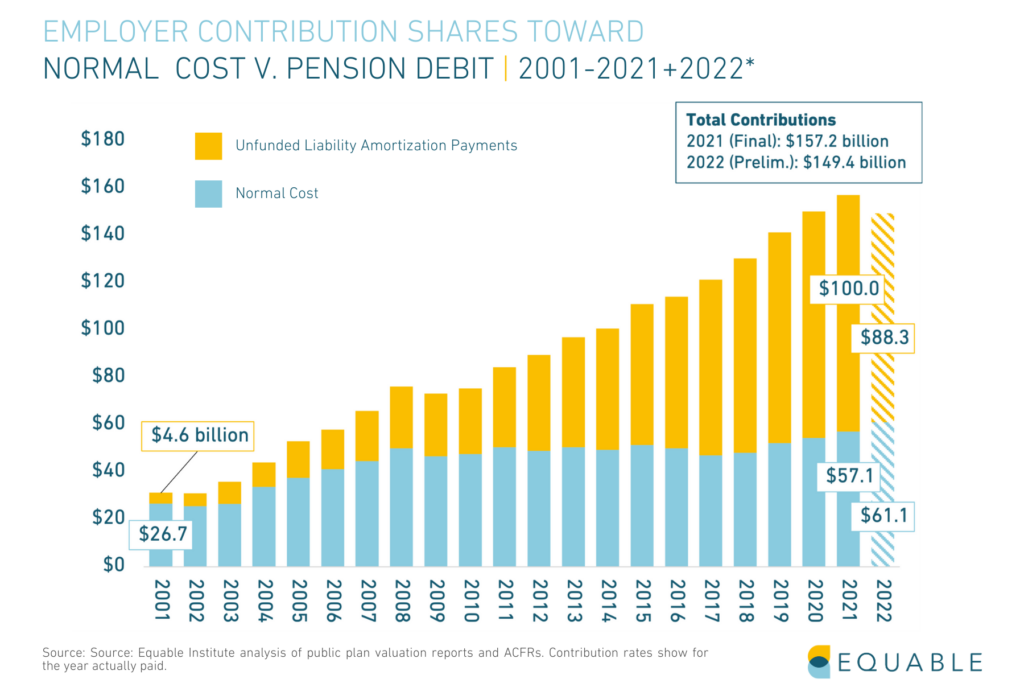
Note that the driving factor is a growth in payments toward unfunded liabilities.
These growing costs have a real effect. Consider the growth in costs for teacher pension benefits. Equable found that between 2001 and 2018 the share of state education K–12 budgets that were used to pay pension costs increased from 7.5% to 14.4%. This has meant fewer resources for schools and students. In California, school board members reported cutting arts and music programs, taking out loans, delaying school building upgrades or technology purchases, and increasing class sizes. Growing teacher pension costs are explicitly cited as the reason for these cuts.
That means pension costs are influencing education quality, programs, and experiences for students right now. That probably qualifies as a “crisis.”
This isn’t the case in every state. Some states have very low pension costs relative to their K–12 budgets. Other states have managed to increase their education budgets even as pension costs have grown. But nationally, there is a problem with increasing “crowd out” of education funding by teacher pension costs. This is because legislatures failed to ensure students are held harmless as teacher pension unfunded liabilities have increased.
What the Data Says: Sustainability Crisis
Measuring the fiscal health of a retirement system is a complex project. As we’ve written elsewhere: we define financially healthy, sustainable retirement systems as those that are both resilient and affordable.[2] Resilience matters because for governments to thrive and be effective. They need their programs and services to be prepared for negative shocks and tail risk events. Public sector retirement systems should not be prone to significant destabilization due to external factors, mismanagement, or political whims. Further, retirement systems should be able to adapt to changing economic and demographic conditions in both the short- and long-term. They should not be designed in ways that allow threats to build over time, to threaten the retirement security of members, or to impede the fiscal stability of their sponsoring government’s budgets.
Measuring pension plan sustainability means looking at both solvency metrics over time (funded ratios and unfunded liability levels). Costs of providing the retirement plan relative to existing tax revenues should be looked at as well. The larger required pension payments are relative to the size of state budgets, the harder it is for the state to ensure responsible funding policies. This is because of the higher cost burden. If such costs are growing because of consciously made policies that set benefit levels in a known way with clearly allocated resources to pay them, this might not be a problem. When larger payments are required because unfunded liabilities are growing, that represents a funding threat.
Here is a multi-factor framework for determining which the status of a retirement system.
There are five factors that we consider in setting this measurement:
- Funded Ratio (Funded Status)
- Unfunded Liability as a % of GDP (Ability to Pay)
- Assumed Rate of Return (Underperformance Risk)
- Share of Required Contributions Received (Willingness to Pay)
- Risk-Sharing Tools (Future Flexibility)
In Equable’s most recent State of Pensions 2022 report, we look at each of these metrics.
The following figure shows the number of retirement systems with “resilient,” “fragile,” or “distressed” funded ratios . We also show different states stack up on their unfunded liabilities as a percentage of state GDP in the next chart.
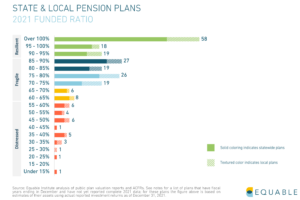

The good news is there are not many distressed pension plans relative to the rest of the country’s large state and local pension plans.
States with unfunded liabilities over 10% of GDP should be concerned. But, most are not in a place on this metric to be concerned about a “crisis.”
However, these charts do show that there are considerable unfunded liabilities to be addressed. Most pension funds are fragile and could fall into a distressed category if there is a particularly bad set of financial shocks that hit their balance sheets hard. Even if pension funds stay fragile, they have large costs for maintaining those unfunded liabilities, which we just discussed in section 5 of this article.
All of this points to a high degree of concern, even if it is not a “sustainability crisis.”
Note [1]: It is worth highlighting that since 2019, most pension funds have had a slight improvement in their funded ratios. Assets dipped in 2020, surged significantly in 2021, and then lost some value in 2022. The net effect is that between 2019 and 2022 there is a minor funded ratio improvement for many of the plans on the list above. But not so much as to save them all. It is also worth noting that in 2021 legislation was adopted in Arizona, Kentucky, and Texas. In various forms this legislation was intended to address insolvency concerns for plans on the list above. But it is also possible that data points for some of the plans in Chicago may have gotten worse over this time frame. So the list from Table 4 in the Urban Institute paper is not currently comprehensive. Even though it provides a good directional list of plans that are facing some level of insolvency risk. The 33 plans that list are 17% of the plans measured for the analysis in the paper. But it is likely that several have fallen off the list or will have shuffled between the “Red” and “Deep Red” categories. A reasonable estimate is that at least 10%. 10% of the plans are still in this insolvency risk range as of 2022.
Note [2]: Retirement systems also need to provide benefits in a transparent and responsible way (a set of activities we broadly define under the rubric of “accountability”). Plus, the benefits should provide a path to retirement income security for all participants in the system. But without resilience, there are no funds to manage in an accountable way or use for providing retirement income.
Are Public Pensions Protected From Inflation?
Retirees with a pension from state or local governments were made a promise: guaranteed income for the rest of their lives. But in a number of states, that doesn’t necessarily mean a financially secure retirement — if pension income doesn’t keep up with inflation, then it is not really a secure retirement income. Unfortunately, there isn’t universal cost-of-living adjustment coverage for retired teachers, firefighters, city workers, and other public workers with pensions. So who is protected from inflation, and by how much? Here is what you need to know about if public workers’ pensions are protected from inflation in America.
Is Your COLA Automatic?
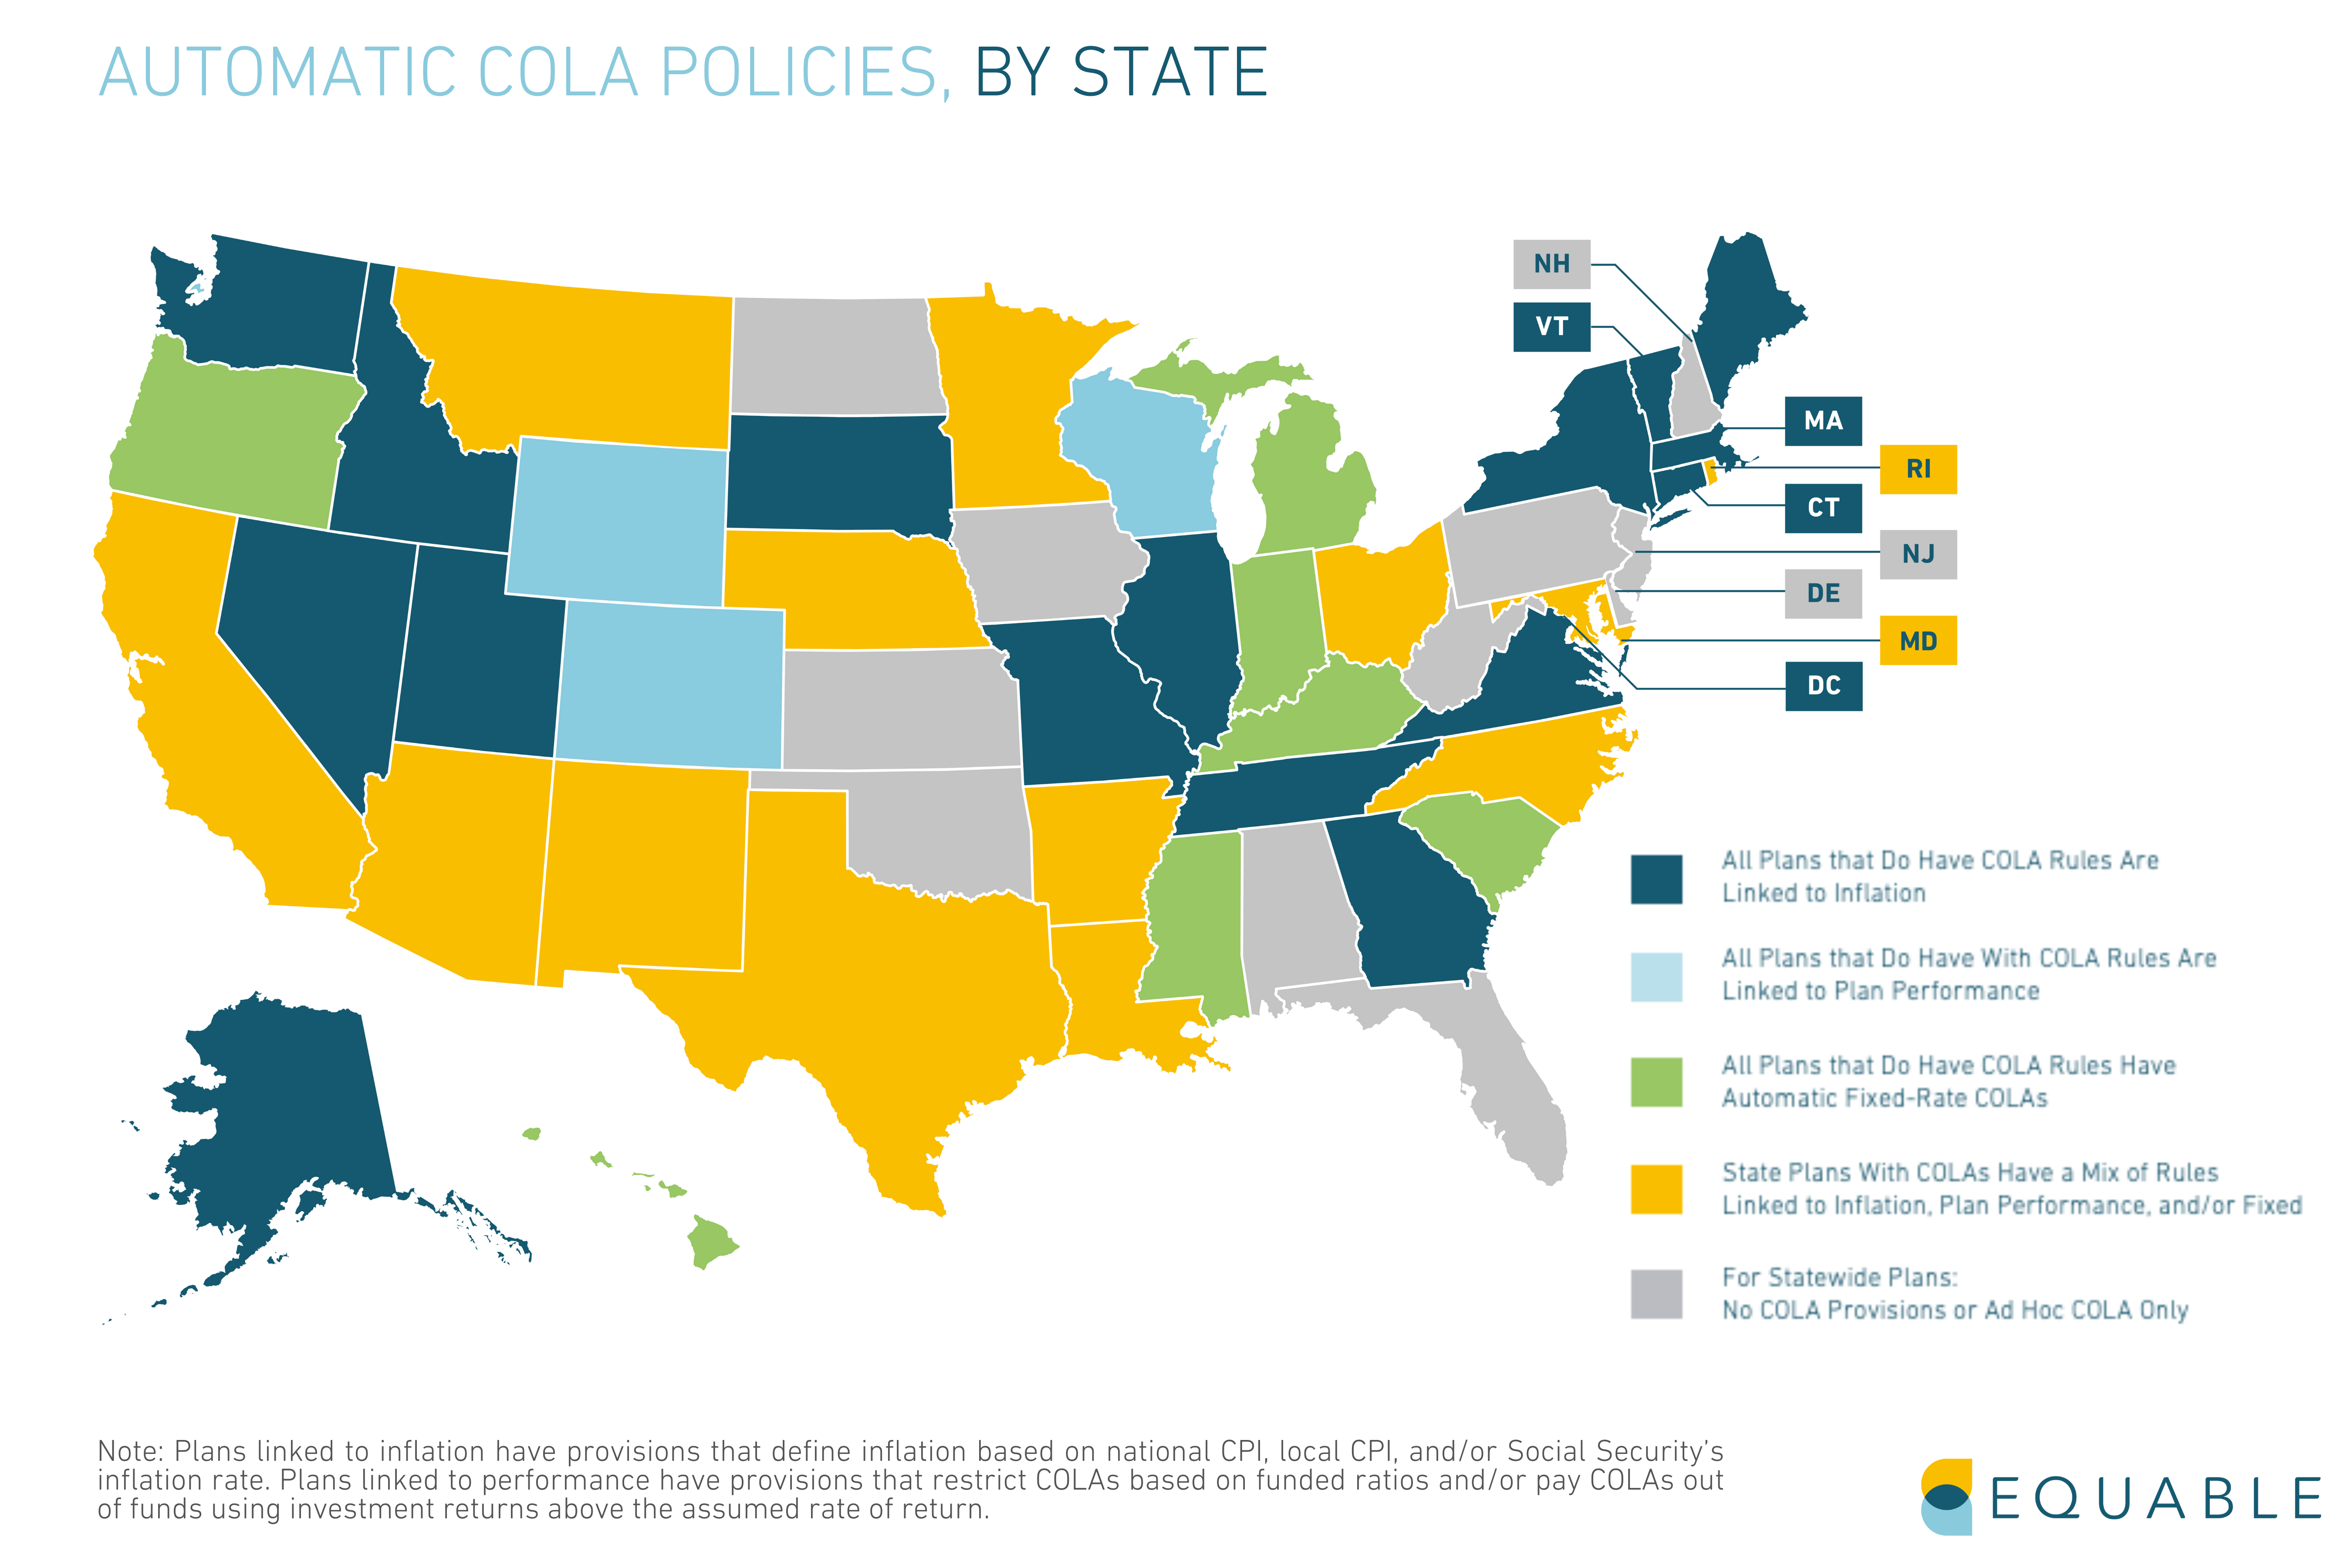
The map above reflects information about statewide Public Worker Retirement systems and their Protection From Inflation (such as “CalPERS” in California) or large city systems (like New York City’s Employees’ Retirement System).
The colors reflect the varied range of cost-of-living adjustment (COLA) policies, depending on the state paying out pensions — sometimes this protection is called a “post-retirement increase” or “post-benefit increase” instead.
If you retired from a state in blue or green then you likely have some level of COLA protection:
- Dark blue means that all of the state’s pension plans adjust retirement income based on actual annual inflation, usually up to some limit like a maximum annual adjustment of 2% or 3%; there are a few pension plans that will match the actual inflation rate for a given year if the previous few years have had low inflation.
- Light blue means that all retiree pension benefits will get adjusted for inflation to some degree, but only if the underlying pension fund has sufficient resources to payout those increased rates. For example, in Colorado retirees can get a COLA up to 2%, but if the state is not ensuring a sufficient level of contributions into the pension fund then that maximum COLA rate gets reduced.
- Green means that any of the state pension plans that do offer COLAs are providing fixed rates that they adjust retirement benefits for that automatically happen each year. The rate is prescribed ahead of time, which means in some years it will be greater than inflation and in other years less than inflation.
If you retired from a state in yellow or gray then you should definitely double check the COLA rules from your specific pension plan:
- Yellow means that there is a mix of COLA coverage in the state. For example, Arizona police and firefighter retirees have COLAs that are up to 2% increases each year, depending on local inflation levels and the availability of resources to pay those increases; but Arizona’s retired teachers, state workers, or municipal employees don’t have any COLA protection on their benefits when inflation hits.
- Gray means that among the statewide retirement systems in the state, there are no COLA benefits offered at this time. In some cases this might be because of a COLA freeze (like in Oklahoma or New Jersey), or there might be city pension plans that offer inflation protection even if the state pension fund doesn’t (like Florida). But there may simply be no built-in provisions for inflation protection (like Iowa or Alabama).
Three Types of COLA Frameworks
There are generally three policy frameworks for those who do have automatically granted COLAs that protect public worker pensions from inflation:
- Fixed-Rate COLAs: A pre-fixed specific percentage of benefit increase (or minimum dollar amount).
- COLAs Linked to Inflation: A percentage increase to benefits based on the national consumer price index (CPI), a local CPI, or the Social Security inflation rate. The actual amount is typically “up to” a maximum rate, such as 2% or 3%.
- COLAs Linked to Plan Performance: A percentage increase to benefits that is dependent on the funded ratio and/or investment performance of the underlying pension plan. The actual amount is also typically “up to” a maximum rate, but that maximum rate is determined by the specific provisions around plan performance. For example, the maximum COLA rate may be cut in half or suspended if the pension fund is under 80%.
Some state pension funds have inflation adjustments linked to both inflation and pension plan performance.
Other states do pay out COLAs in certain years, but only if the legislature authorizes the benefit adjustment. These are called “ad hoc” COLA benefits because they aren’t legally required and they are heavily dependent on local politics and legislative budgets.
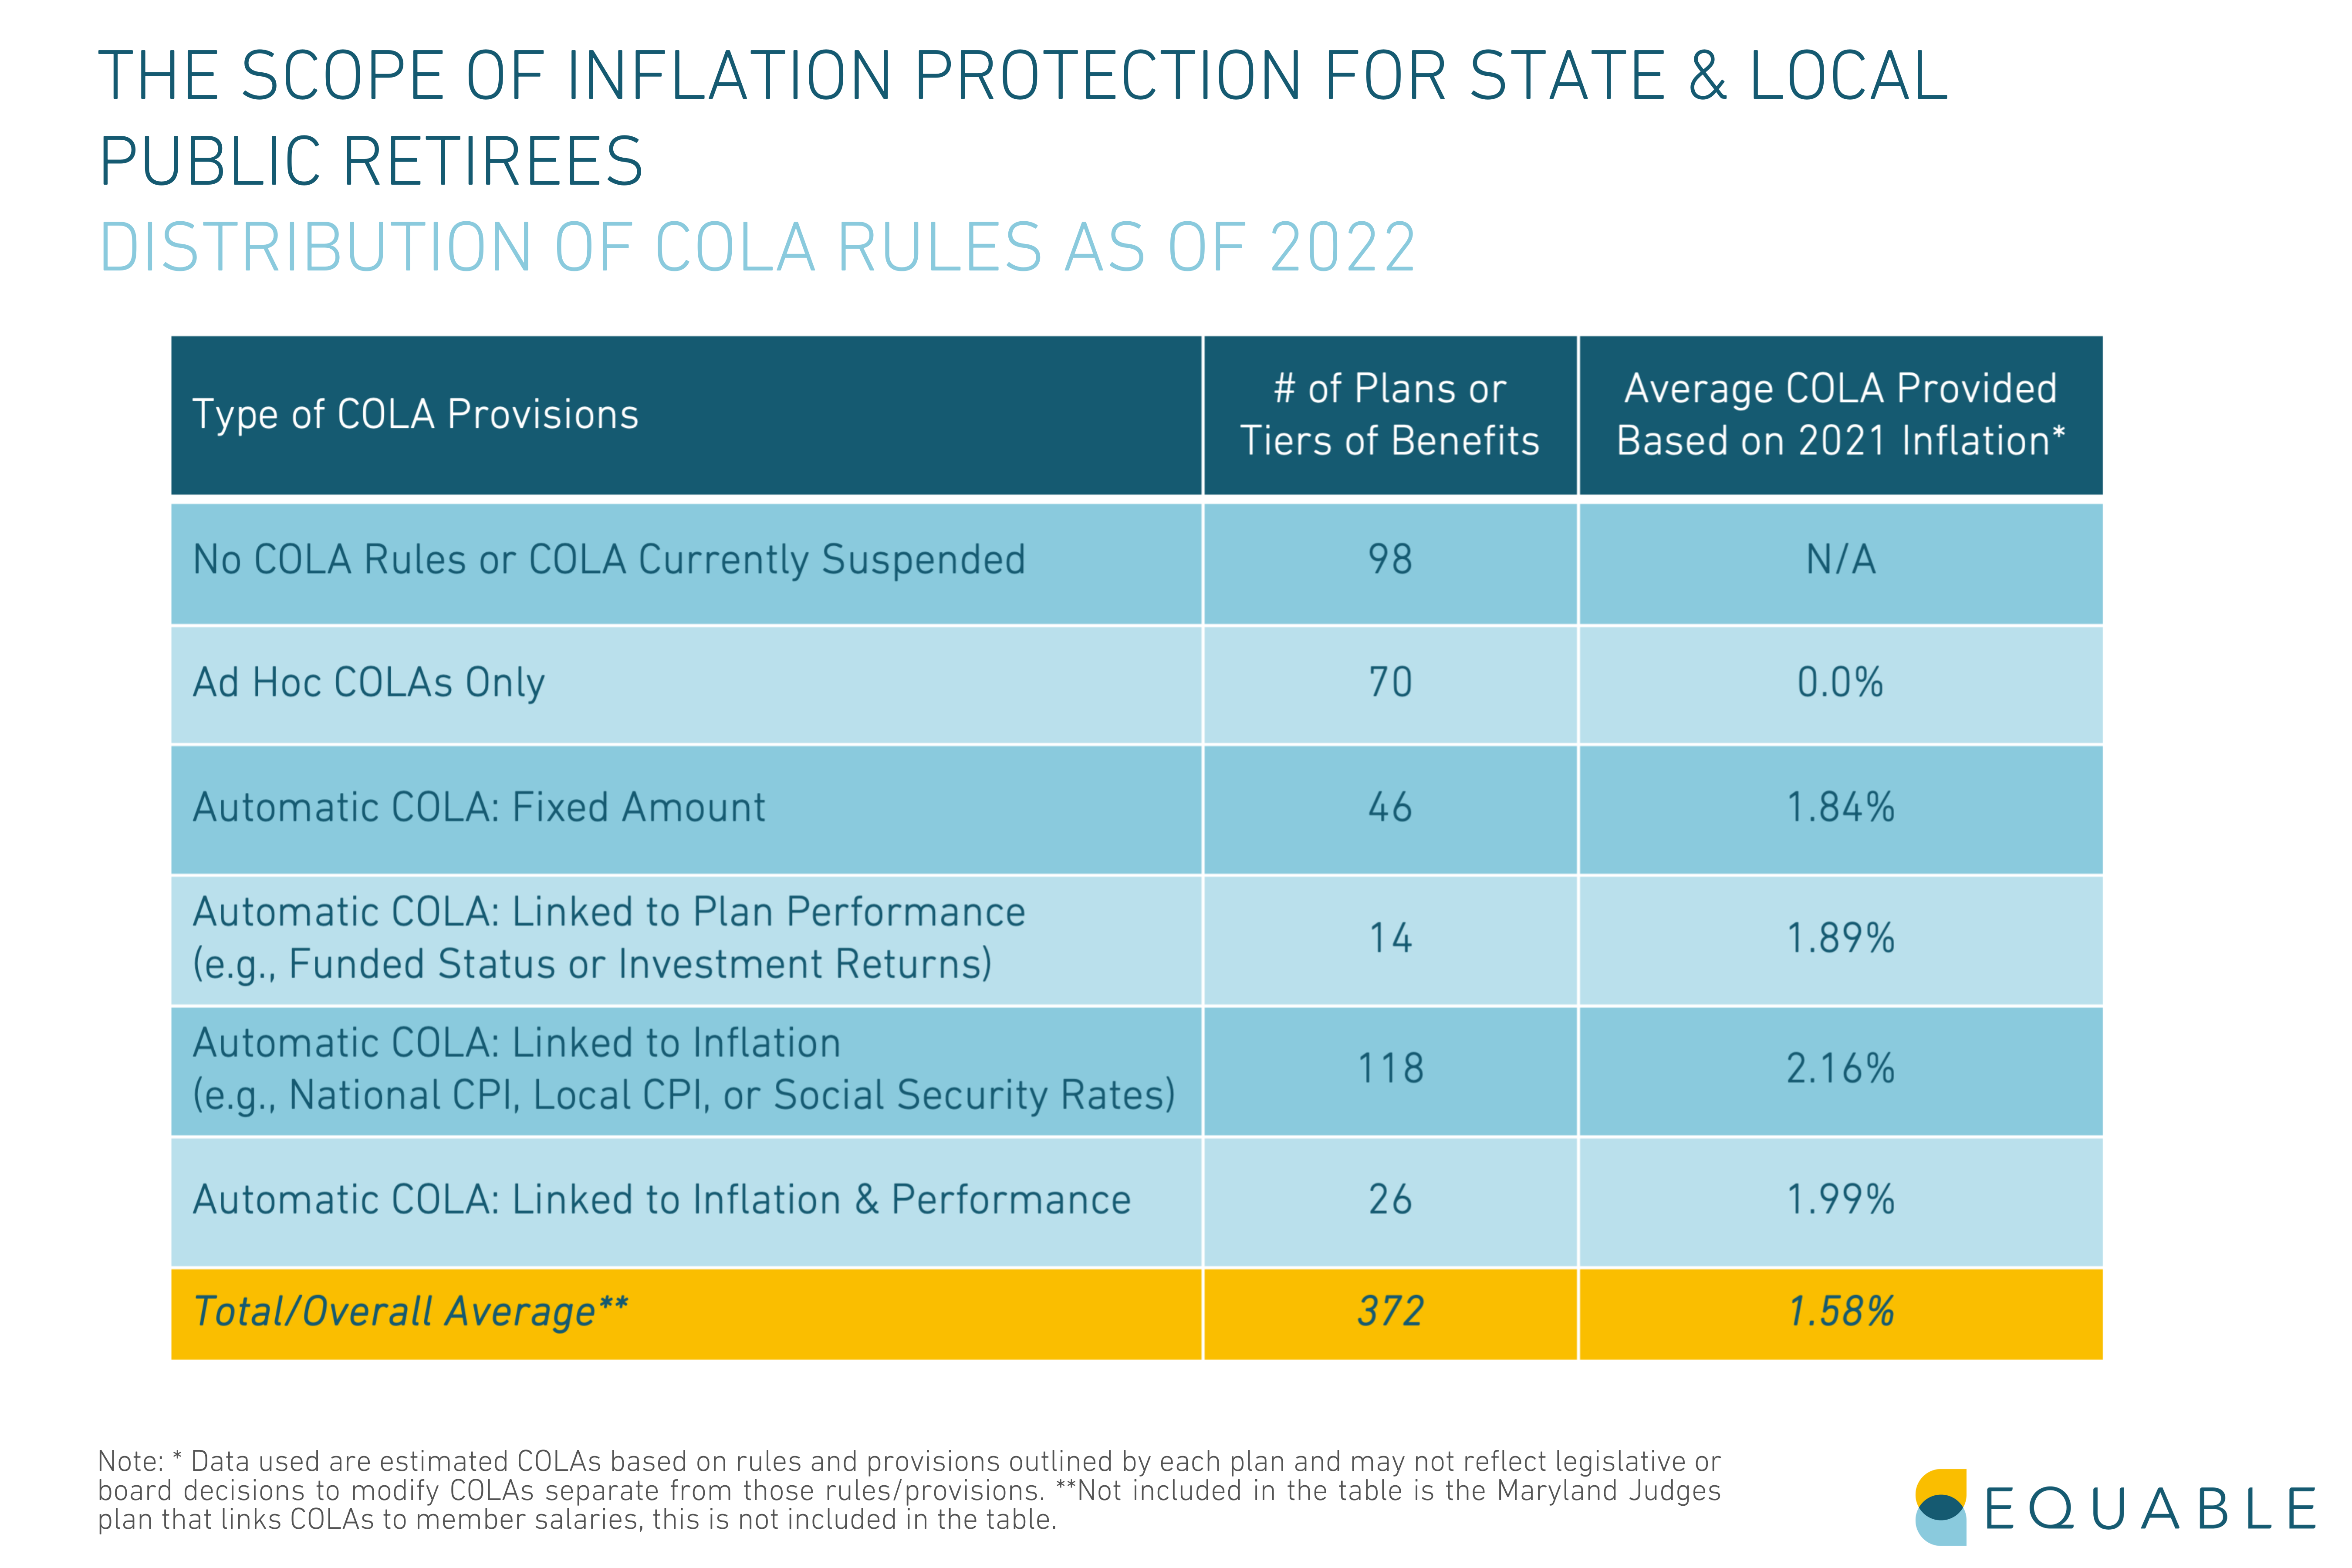
The table below shows the total number of pension plans (or tiers of pension benefits within the same plan) that offer COLAs of different kinds. The table also shows the average COLA that was paid out in 2021 based on the underlying plan provisions.
Do COLAs Really Keep Up With Inflation?
The majority of public pension COLAs have maximum annual increases of 2% or 3%, which is typically sufficient to keep up with inflation and protects public worker retirees protected from inflation. Over the past decade, the average annual rate of inflation has been less than 2%. But in the context of 2022, inflation rates are significantly higher and most COLA rules will not be keeping up with inflation.
There are some pension plans that ensure the purchasing power of pension income doesn’t fall too far behind inflation. For example, CalSTRS has rules for offering modest annual COLAs. However, if those fail to keep up with inflation, then they will adjust benefit values for certain retirees at a faster rate. Specifically, they have promised that the value of pension income will at least maintain 85% of the purchasing power it had in the year when the pension benefit was first issued. This is a very reasonable level of benefit protection, but unfortunately for public workers it is not common.
Compounding versus Non-Compounding
When COLAs are paid out, there are two basic ways that the underlying benefit is adjusted:
- Compounding Benefits: This means that the base benefit gets permanently adjusted and any future changes to benefits are added on top. For example, someone with a $40,000 pension that gets a 2% COLA will have their base benefit increased to $40,800. The next year, if inflation means a 1.5% COLA, then the adjustment is calculated based on the new, higher number. So in this case, the benefit would increase to $41,412.
- Non-Compounding Benefits: This means that all inflation adjustments are based on the original pension benefit value. Each year that benefits are increased you get to keep the adjustment from the previous year, but the percentage increase is based on your original pension. For example, someone with a $40,000 pension that got a 2% COLA would see $800 added on top for a total pension of $40,800. The next year, a 1.5% COLA would be calculated on the original $40,000 pension and $600 would be added on top for a total pension of $41,200.
For more on why COLAs are important for retirement security, see this article from 2019.
To learn more about the specifics of your public retirement plan, check out our interactive database of Retirement Security Scorecards.
State of Pensions 2022: National Pension Funding Trends
In the first half of 2022, U.S. public pension funds have weathered a bear market, geopolitical conflict, and record inflation. Despite these difficult economic headwinds, a new Equable Institute report on national pension funding finds that there has been a net positive funding trend over the last three years: even with losses this year, pension funding at the end of 2022 will likely be better than it was at the end of 2019.
Retirees with public pension benefits do not need to worry that their state will go bankrupt over the next few years. There are concerns about inflation protection of those benefits in some states, however. But there is enough money in the vast majority of pension funds to pay benefits for decades.
The concerning most threat resulting from recent financial market volatility is the cost of funding pension benefits. They will likely keep rising, reducing money that would otherwise be used for schools, public works, or government services.
In this post, we will look at pension funding trends and how pension fund health in an increasingly unpredictable market. We will also highlight the core reasons why pension funds are still struggling to keep up after 2021’s once-in-a-century investment returns.
State of Pensions 2022: Public Pension Debt is Volatile
What is the pension funding gap in 2022?
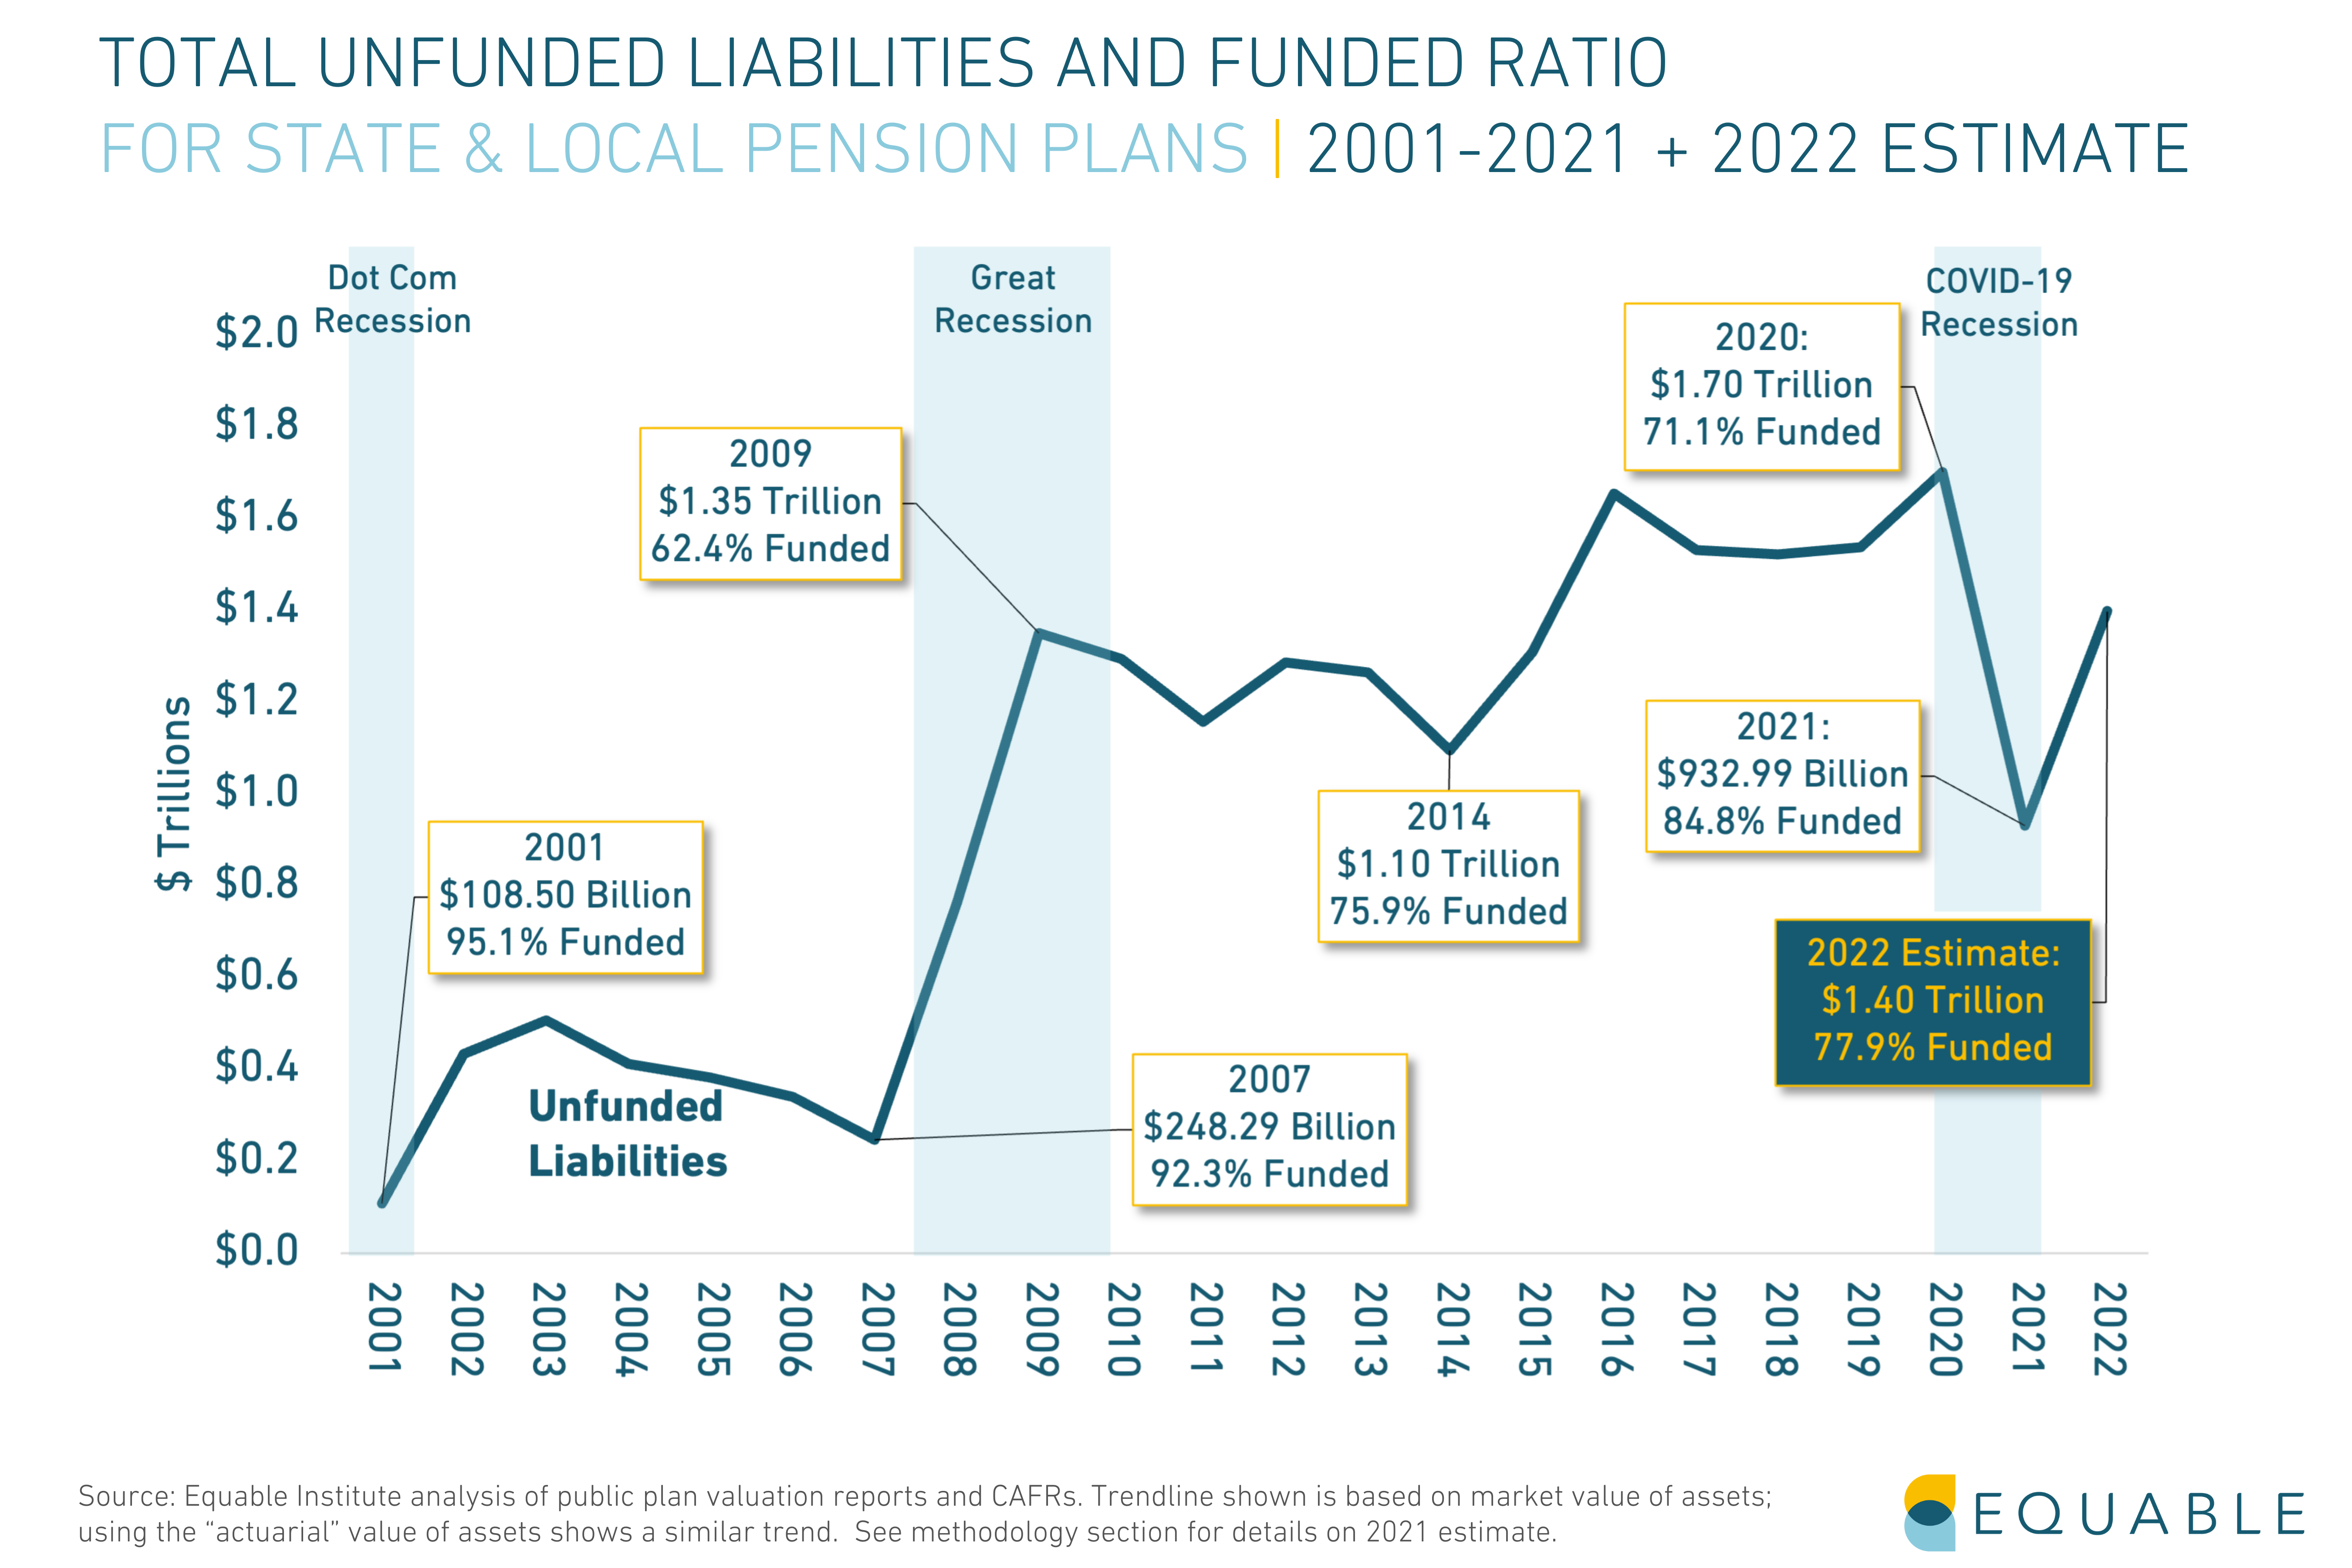
The national pension funding shortfall (or pension debt) for statewide retirement systems was $933 billion at the end of 2021, per Equable Institute’s State of Pensions 2022 report.
The funding shortfall is the gap between money held by pension funds and the value of all future benefits it has promised to pay. This formally called “unfunded liabilities” and is also sometimes called pension debt.
The shortfall was, in part, caused by investment volatility set off by the Covid-19 pandemic. The change in funded ratios over the last three years reflects that volatility. While pension funding trends are net positive in that time period, 2021 saw a rapid reduction of pension debt (thanks to an average investment return of 25.3%), followed by an immediate and drastic rise in 2022.
Preliminary 2022 investment returns for state and local plans are -10.4% on average. As a result of these disappointing returns, Equable Institute estimates that debt will increase to $1.4 Trillion in 2022.
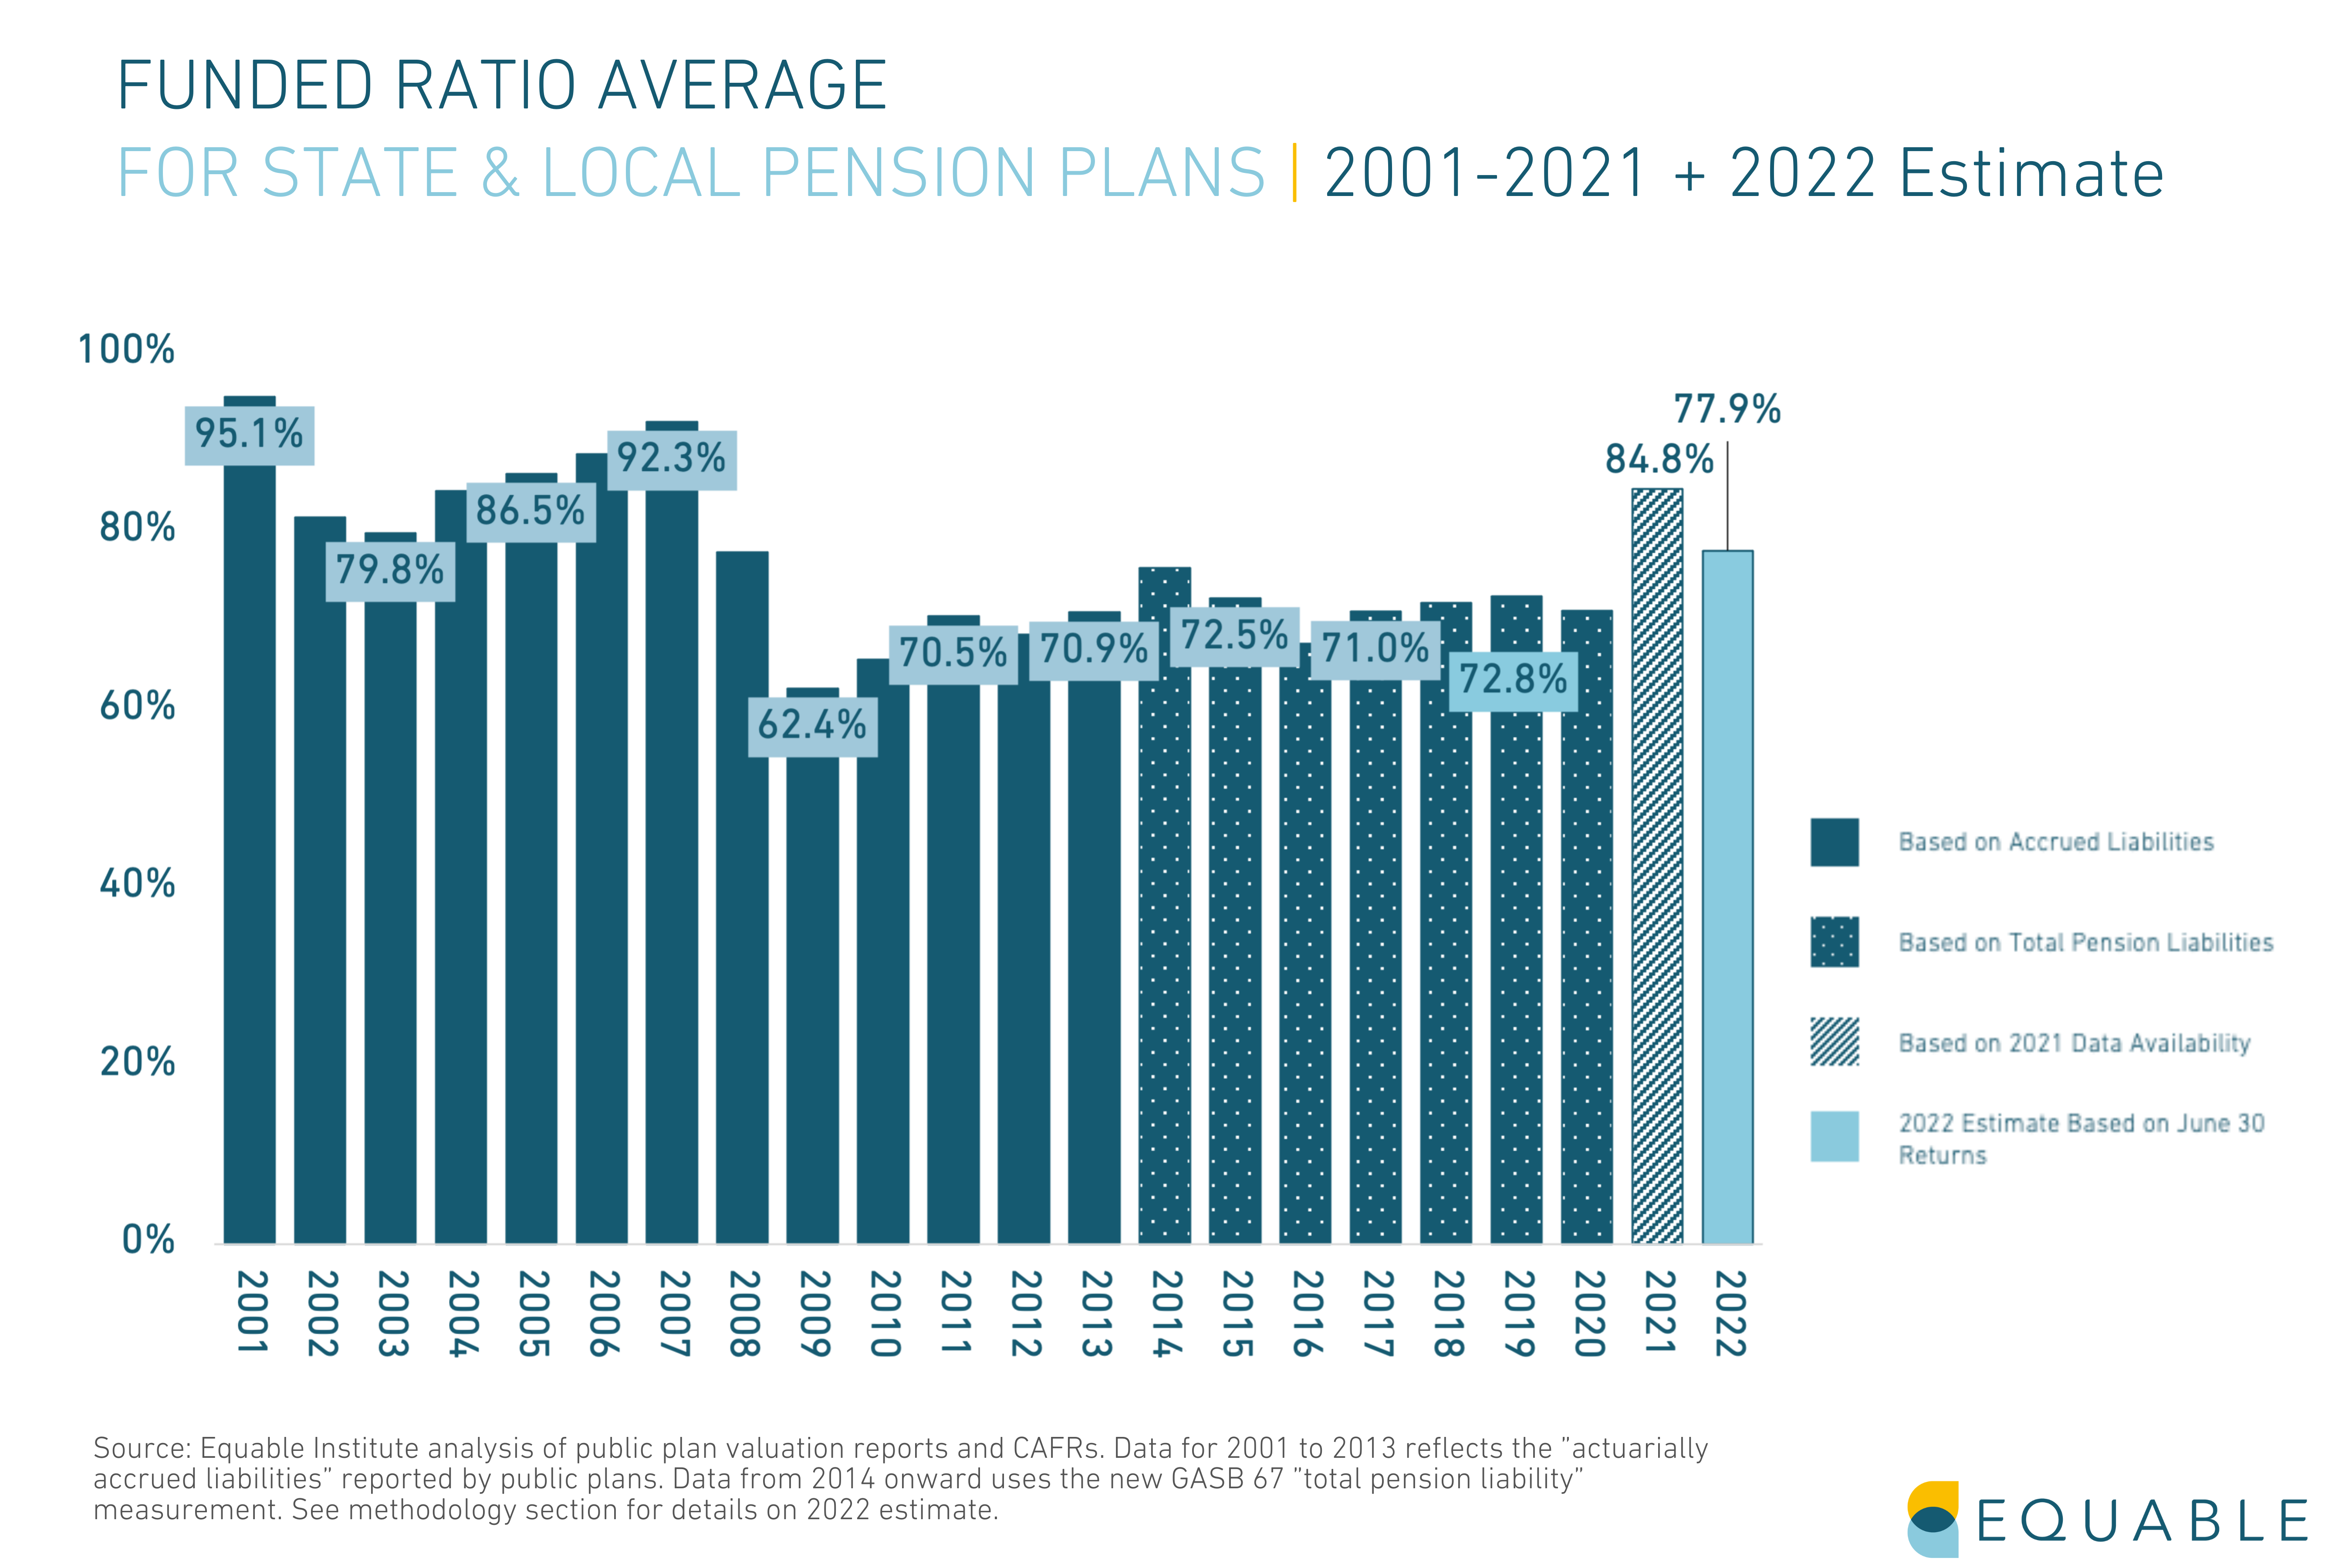
What does this mean? On average, American public pensions plans currently hold 77.9% of assets needed to pay future retirees their pension benefits. This is positive, but still much lower than the 84.8% funded ratio in 2021. More importantly, it’s lower than the pre-Great Recession funded ratios of 2007 and 2008.
In contrast, retirement systems in the U.S. had 93.8% of the money promised public retirees in 2007, before the Great Recession. Losses because of the Financial Crisis of 2008 knocked this funded ratio down to 80%.
Pension funds have been able to recoup the losses experienced during the beginning of the Covid-19 pandemic. But, they still have not recovered from the 2008 recession. And capital market forecasts are warning future returns are likely to be muted.
To maintain the positive trends in pension funding, states will need to adopt safer practices. This includes establishing realistic assumed rates of return and appropriately managing the risk level of their investments.
Why the Assumed Rate of Return Matters
There is a significant gap between projected earnings and fiscal reality for public pension plans in many states. This gap has persisted for several years.
Still, the assumed rates of return used by many retirement systems have remained significantly higher than actual investment earnings. However, a few states have meaningfully reduced their assumed rates of return in response to economic shifts. The average assumed rate of return is now 6.9% in 2022—down from 8.05% in 2001.
Interest rates are considered an indicator of future market performance. Declining interest rates indicate that investments will likely see slower investment return gains in the future. This is important because it means that historic performance is not a good indicator of future performance. Many pension funds report that they have had strong investment returns over the past 30 or 40 years. And this is true. But unfortunately those numbers do not actually mean very much for the future. They include investment returns from the 1980s or 1990s, which were very different economic times.
Pension fund assumed rates of return have not kept pace with rapidly declining interest rates over the last two decades. Many funds are over-estimating what their investments will earn. Others are making a lot of high risk, high reward investments to try and hit their optimistic targets. Some funds are doing both.
The chart below shows the recent trend in assumed rates of return in tandem with interest rates. They have not kept pace with each other. For the first time in modern history, the average assumed rate of return for statewide pension funds is below 7%. As of 2022, the average assumed rate of return is now at 6.9%. However, if assumed returns had kept pace with declining interest rates since 2001, the average assumed rate of return for 2022 would have been around 5.47%.
The highly optimistic assumed rate of return used by most pension funds to make financial decisions may be increasingly hard to achieve if America’s economic future remains uncertain.
How does national pension debt affect public workers?
The pension debt carried by governments is costly to pay down and creates pressure on the public budget. It may cause an increase in required pension contributions for public employees or benefit reduction like the elimination of cost-of-living (COLA) adjustments for retirees, which in an era of record inflation is increasingly important. Higher employee contribution rates means less money in public workers’ paychecks. In recent years, the first number has been growing while the latter shrinks.
Public workers who are enrolled in Social Security paid 160 basis points more in 2022 than they did in 2001. This is a 36.5% increase over the last two decades. They paid 23.7% more than they did in 2008, before the financial crisis.
Those who do not participate in Social Security paid 14.3% more this year than in 2001. They paid 10.1% more than in 2008.
In times of economic hardship, higher contribution rates for governments may have other impacts. They may result in higher property taxes, delayed raises, cuts in school funding, or reductions in essential services.
Pension Funding in 2022: Public Pension Plans Are Managing Their Debt with Risk and Responsibility
How are pension plans investing their assets?
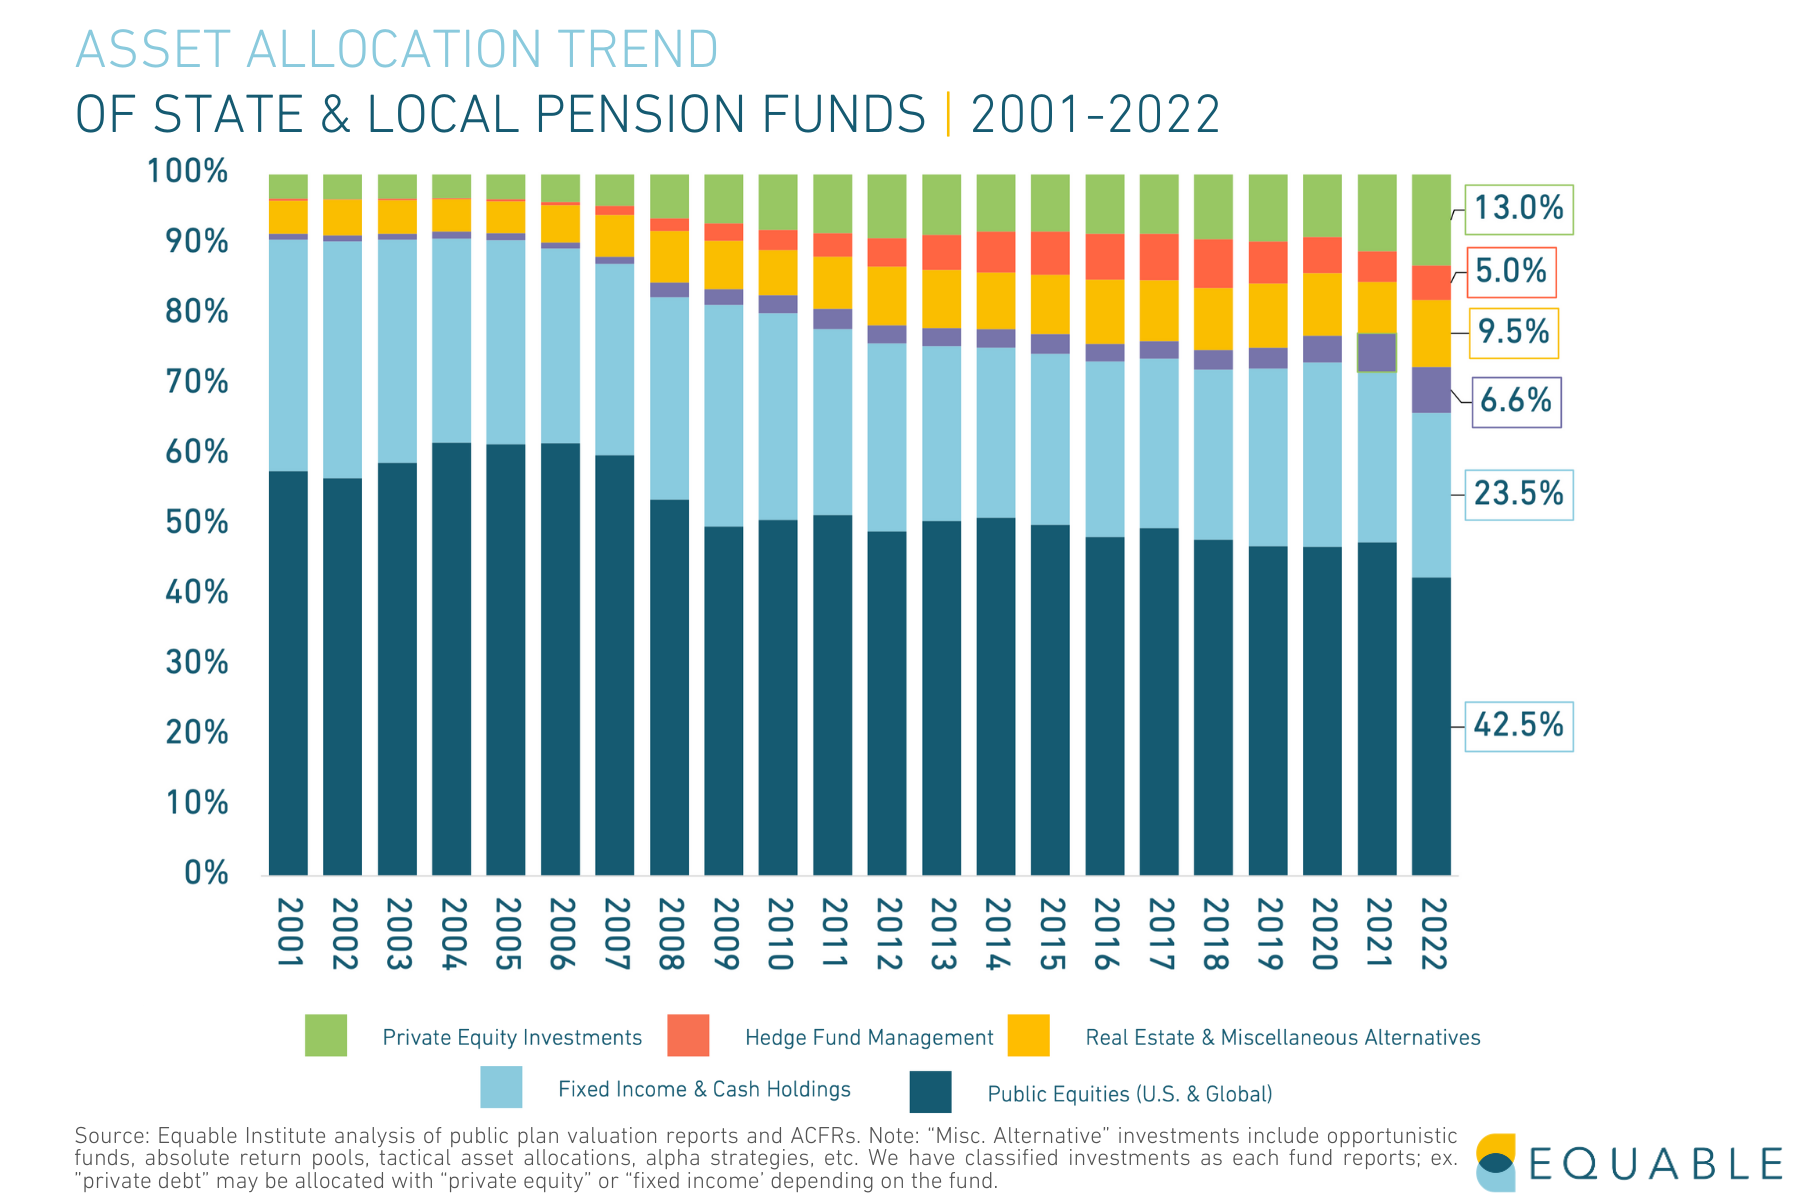
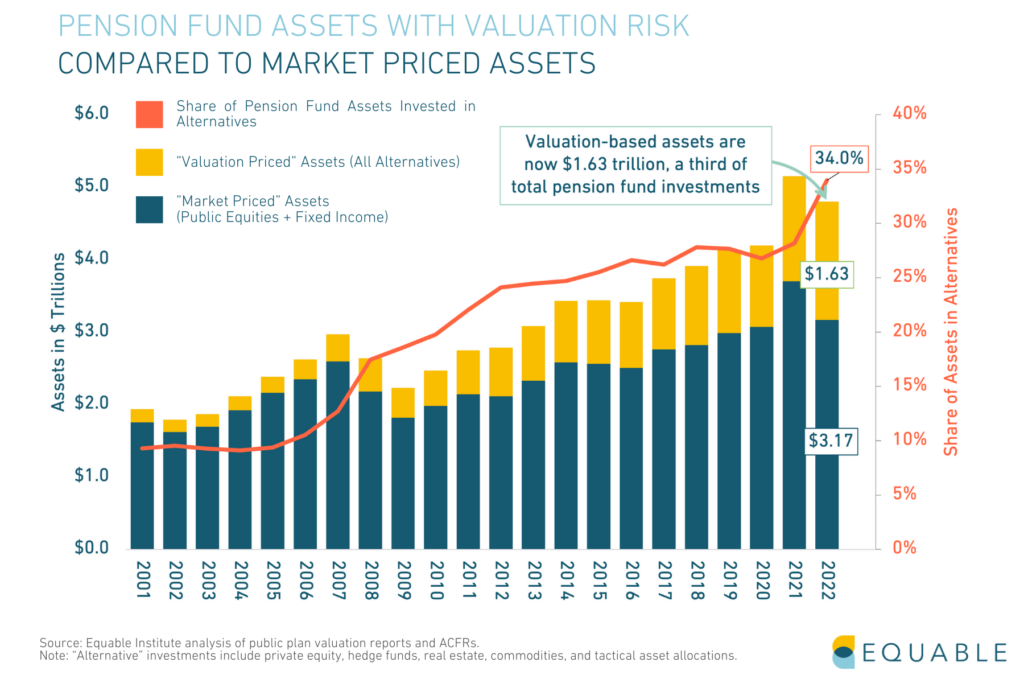
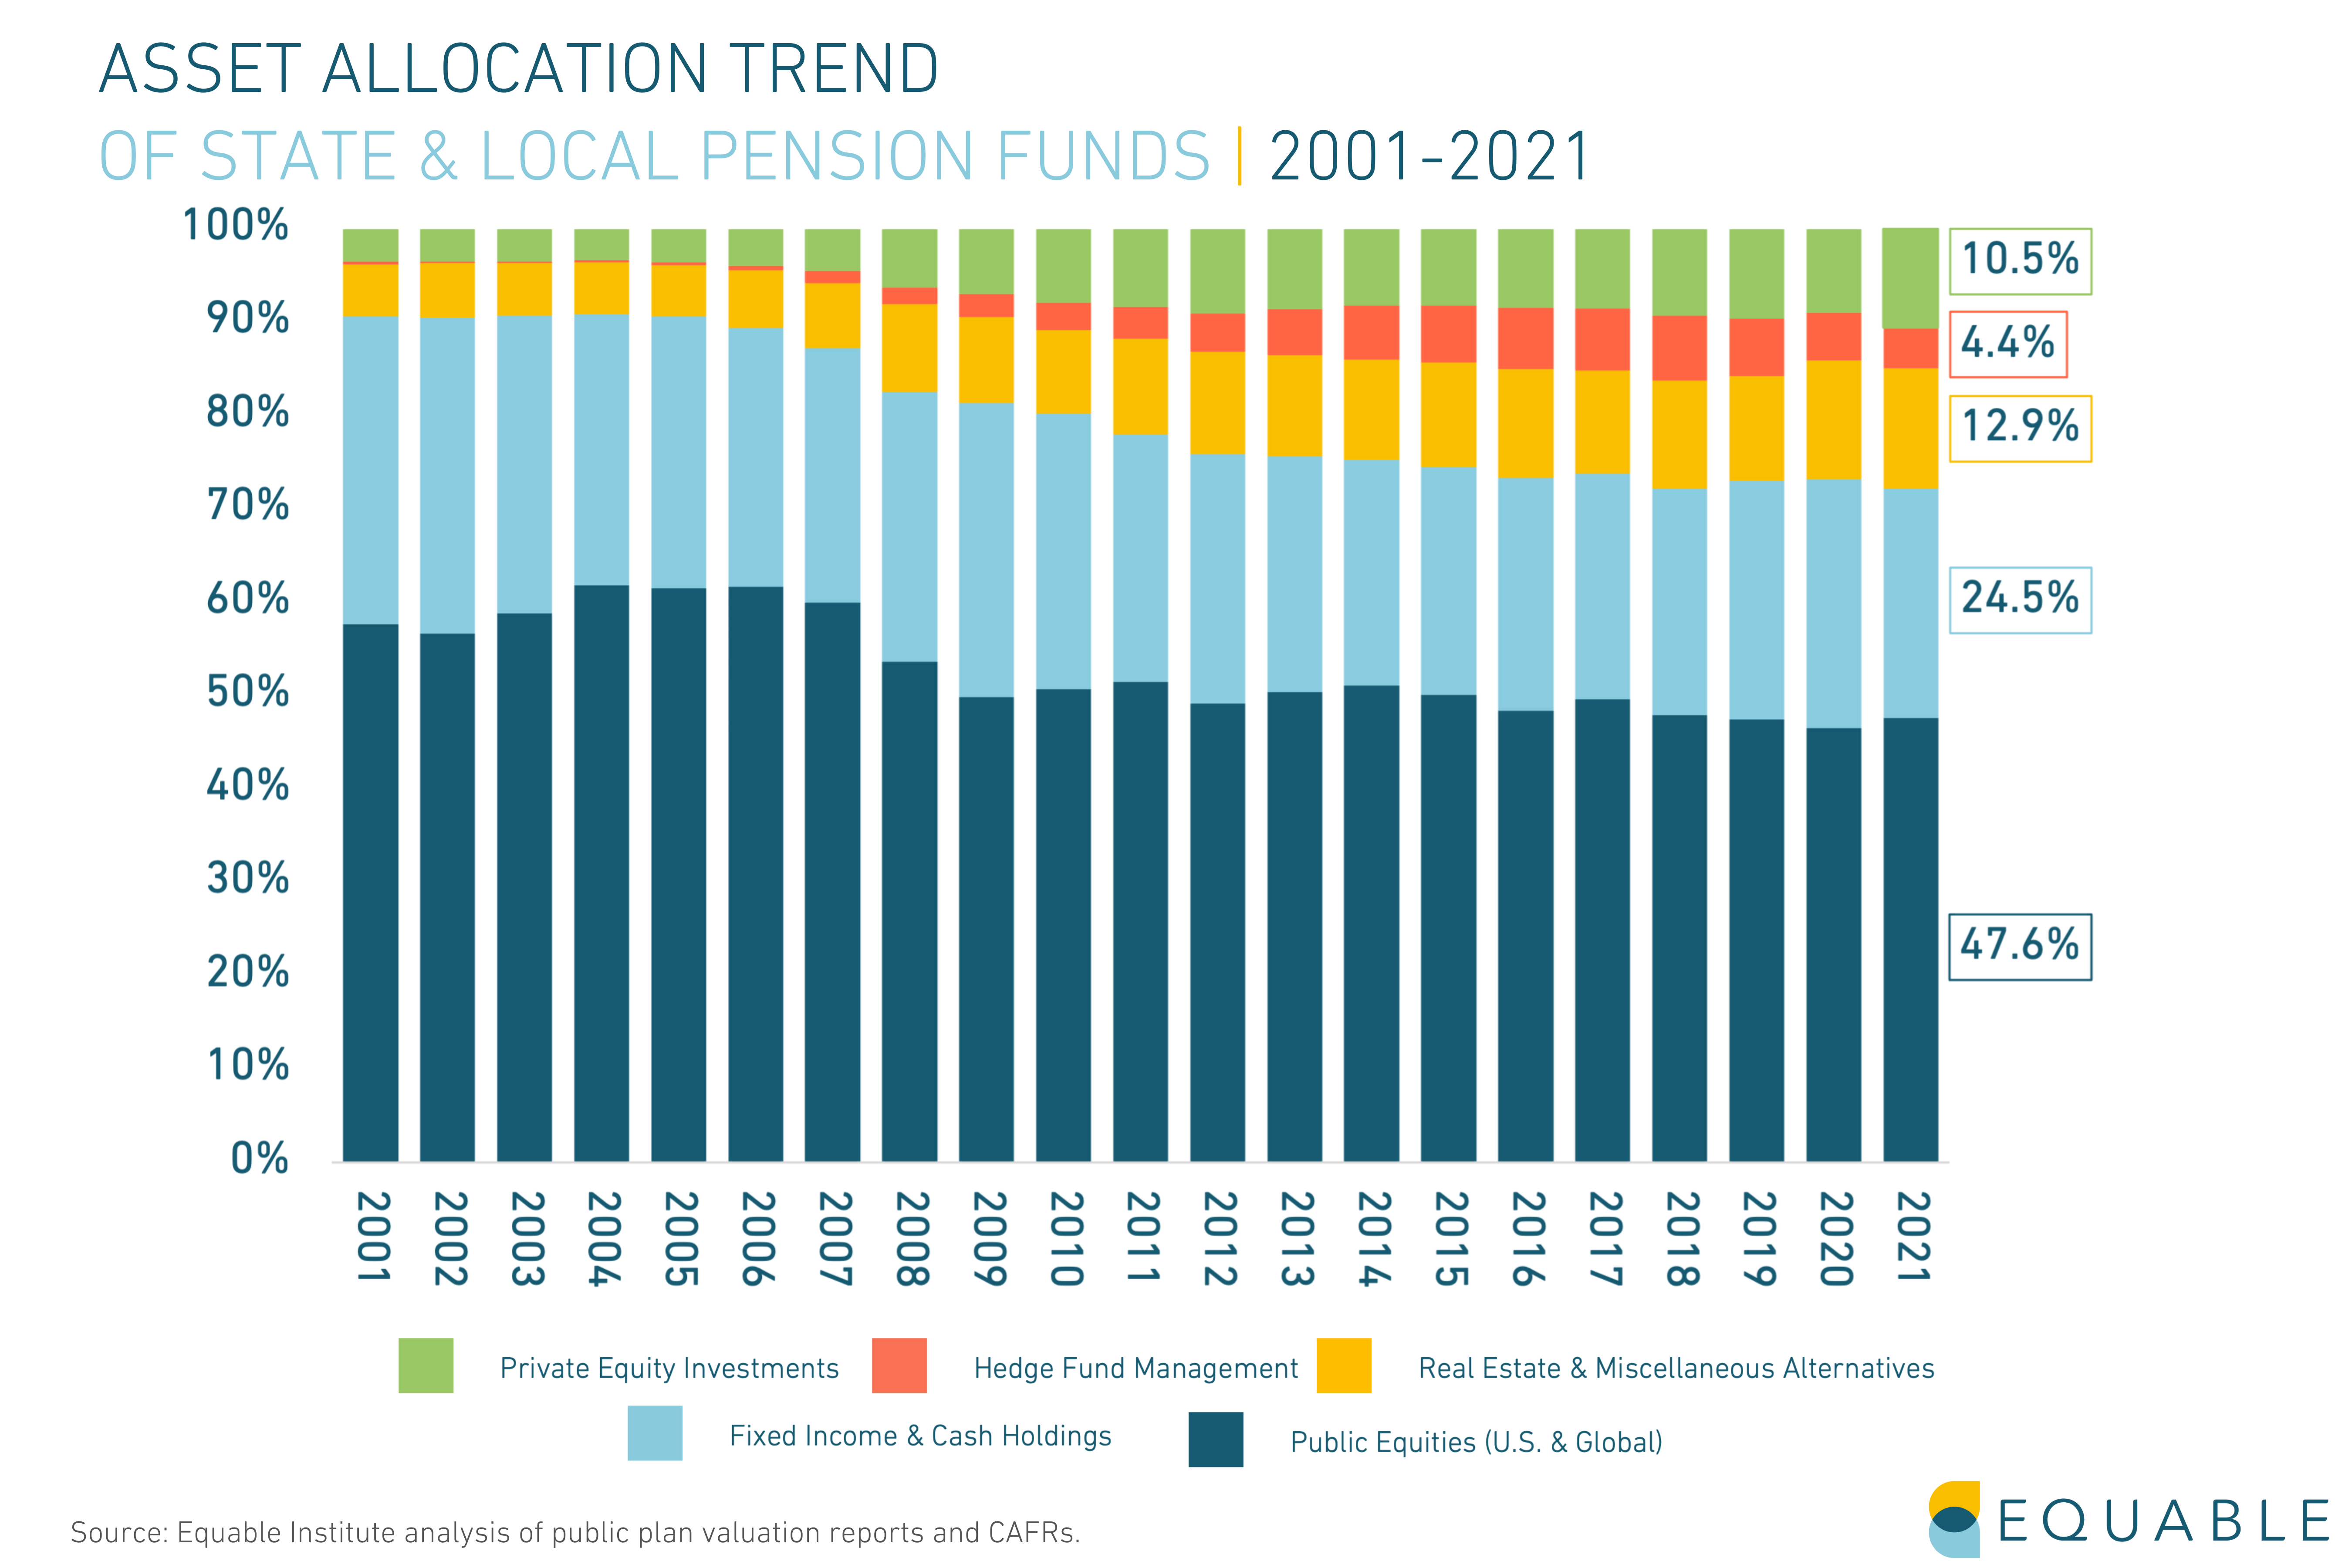
States are trying to make up for negative pension funding trends like lower projected returns on stocks and bonds. They are utilizing more and more alternative investments to chase higher returns. This includes investments hedge funds and private equity strategies, as well as real estate.
Since 2001, pension funds invested a higher percentage of their assets into these alternative investment categories. Hedge funds, real estate, and private equities, are known for a lack of transparency. They also tend to be more volatile in times of economic uncertainty.
Ultimately, state pension funds are in competition with each other when vying for these deals and market strategies. Statistically speaking, there are going to be plans that lose out on this work. Unless state pension funds have better success than the market, it is likely that the net average result across all plans will be modest at best. At worst, these strategies will perform worse than traditional passive equity investment strategies.
Some of the alternative investments that state pension funds have adopted might produce higher returns. They might also help to hedge against sharp downturns in the stock market. But they also carry much higher risks. Those risks are only justifiable if the objective is to try and earn an unreasonably high assumed rate of return target.
How are states responding to the volatile market’s risks and rewards?
There has been a widespread trend among states to take action to shore up pension funds in the last year. States used supplemental funds, rainy day funds, and budget surpluses to make one-time contributions into state pension funds. These one-time supplemental contributions totaled more than $12 billion.
There were several driving forces behind this trend. The first was the influx of federal stimulus dollars paid to states as a response to the pandemic. States also underestimated their tax revenues during the peak of the pandemic in 2020, creating budget surpluses. As a result, rainy day funds (savings that states built up after the last financial crises) exceeding their legal limits in many states.
States also used this “windfall” to responsibly reduce their assumed rates of return. Plans estimate their level of unfunded liabilities based on what they assume they will earn in the coming years. When the assumed rate of return is too optimistic, their estimation of their total pension debt is lower than it should be. This means that contribution rates are set lower than they should be for pension plans to close their funding gaps.
Lowering the assumed rate of return means that both unfunded liabilities and contribution rates will increase. But states were able to help offset this with one-time supplemental contributions. This year, states have tempered their investment assumptions significantly. The average assumed rate of return is now 6.9%, below the 7% mark for the first time in modern history. There are now 83 state and local plans assuming investment returns below 7%, as of June 2022. In 2020, just 65 plans expected returns of 7% or less.
The State of Pensions 2022: Most Public Pension Systems Are Still Financially Fragile or Distressed
What do pension funding gaps mean for states?
Despite the most recent fiscal year’s strong investment returns, it’s unlikely those earnings will cut the number of plans that are financially fragile or distressed. Currently, 58% of all statewide plans are fragile or distressed.
Fragile status generally means a retirement plan is between 60% and 90% funded. While they’re not at immediate risk of insolvency, they are accumulating unfunded liabilities. Over time, that will gradually become a strain on budgets and government revenues. One or two asset shocks could send the plan into a downward spiral.
State of Pensions 2022: Public Workers are Highly Likely to Feel The Effects of Inflation and a Recession
How will public workers be affected by inflation?
Public retirees may be more exposed to inflation that many assume, given the limited cost-of-living adjustment (COLA) provisions that are available across the country. 168 plans do not offer or guarantee retirees a COLA. For plans that do offer inflation protection, the average COLA is 1.58% in 2022. This is significantly less than the estimated 8.6% rate of inflation (CPI as of May 2022) nationally.
Read more about this here.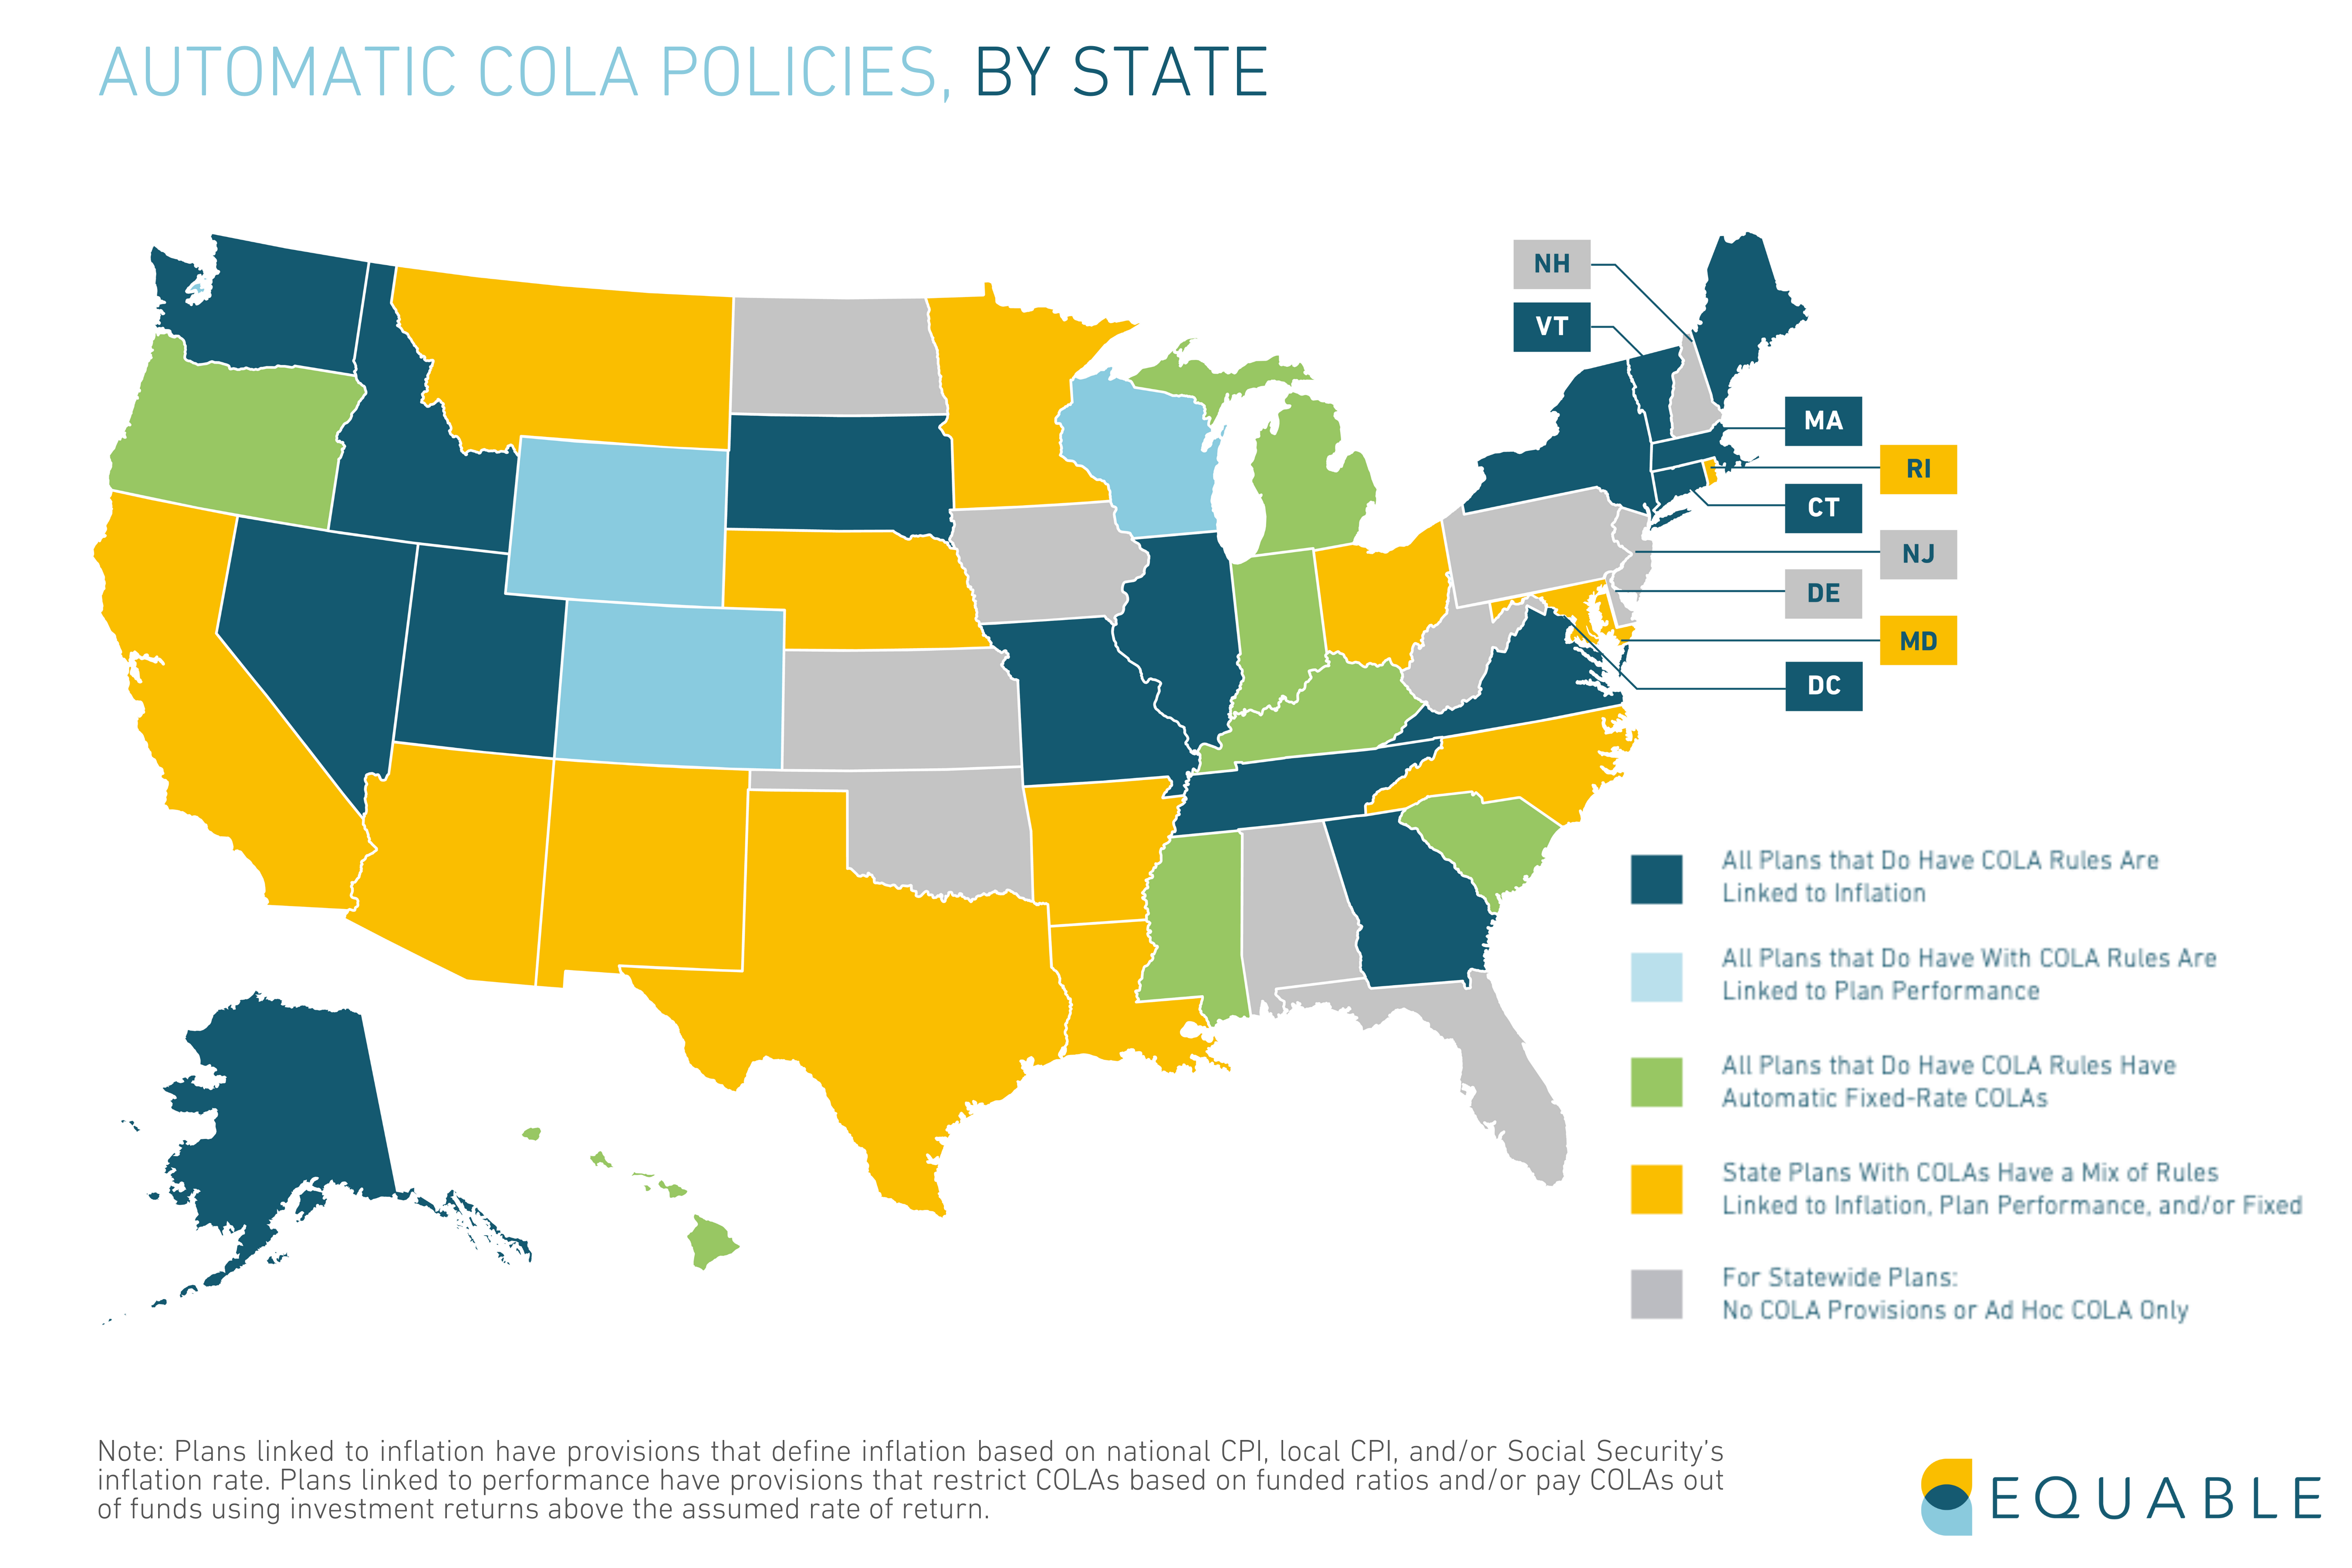
How will underfunded pension funds cover promised benefits for workers?
There are three strategies that states might take in seeking to ensure they can pay promised benefits to workers:
- Increase contributions into their pension funds,
- Pursue higher investment returns, or
- Reduce the value of benefits.
Cutting benefits is unconstitutional in nearly every state, but in certain places benefits have been reduced by cutting back on the inflation adjustment of pension checks.
Pursuing higher investment returns has been the primary strategy of the past decade. While a few state pension plans were able to recover and some years produced good returns, overall investment returns have not been high enough for everyone to recover. States will continue using this strategy, but it has high risks. And if it doesn’t succeed that leaves only the other two strategies.
The other key strategy is increasing contributions. Usually, when unfunded pension liabilities rise steadily over the years, employer contributions experience an uptick along with required employee paycheck deductions. Just throwing more money into state pension funds doesn’t always help, though, if the underlying reasons that the funding shortfall is growing in the first place are not addressed. That means pension debt and employee contributions may rise unabated until a change in policy mandates a reversal of problematic practices. Even a boon in investment returns has historically offered no guarantee that state and local governments will make debt payments in a timely fashion.
Click Here to Read the Full State of Pensions 2022 Report
The Best U.S. States for New Teacher Retirement Benefits
There are lots of factors that new, prospective K–12 teachers have to consider when entering the education workforce. People typically pay the most attention to things like salary, location, and health insurance benefits, but what are the best U.S. States for new teachers looking for secure retirement?
Retirement benefits are a unique form of compensation in that they are deferred compensation. It is straightforward to compare the salaries offered to teach in one county versus another, or even to look at the health insurance benefits (medical plus dental? plus vision?) offered by one school district versus another. But comparing retirement plans on a state-by-state basis is a more difficult because there is no intuitive way to understand the value of one pension plan versus another, or whether a hybrid plan or defined contribution (DC) plan might be more valuable.
This article provides a ranking of states based on the quality of retirement benefits that they offer to new teachers entering the workforce in 2022-23, first published in Special Report #2 of the Retirement Security Report Teacher Edition.
Jump to the Complete Rankings
The Top 10 / Bottom 10 States by Average Quality of Retirement Benefits for New Teachers
- South Carolina (94.2%)
- Tennessee (88.2%)
- South Dakota (78.7%)
- Oregon (78.6%)
- Michigan (75.3%)
- Washington (74.4%)
- Rhode Island (73.9%)
- Florida (73.7%)
- Hawaii (71.0%)
- Virginia (70.7%)
…
- Illinois (49.7%)
- Mississippi (49.6%)
- Alabama (49.1%)
- New Jersey (48.0%)
- Nevada (47.1%)
- Georgia (46.2%)
- Wisconsin (46.1%)
- Kentucky (46.1%)
- Texas (44.9%)
- Louisiana (33.8%)
The score shown for each state is the percentage of available Retirement Benefits Score points that the retirement system averages overall for all open retirement plans available to public school teachers for the 2022-23 school year.
How States are Ranked
Our approach to ranking states is to grade each retirement plan offered to public school teachers based on the quality of benefits offered to three groups of people: those who are only going to teach for 10-years or less (“short-term” teachers), those who are going to spend 10-20 years in the classroom (“medium-term” teachers), and those who will teach in K–12 education for their entire lives (“full career” teachers).
This ranking includes all types of retirement plans for teachers, including “pension” plans, “defined contribution” plans, “guaranteed return” (or “cash balance”) plans, and “hybrid” plans that blend together various elements from the first three plan types.
While most teachers do not make their job decisions based on the retirement benefits being offered, today’s workforce is highly mobile and very much in flux. It is easily conceivable that someone who is getting their teaching certificate or finishing up an education program or considering changing professions might have some flexibility in where they want to go to work.
Read the Report for Full Details on How We Measured Each Teacher Retirement Plan
State Ranking
States Ranked by Best Retirement Plan Available to New Public School Teachers
| wdt_ID | Rank | State | Best Plan Available (Design Type) | Overall Retirement Benefits Score | "Short-Term" Teacher Score | "Medium-Term" Teacher Score | "Full Career" Teacher Score |
|---|---|---|---|---|---|---|---|
| 1 | 1 | South Carolina | DC Plan (Pension Option Available) | 94.20% | 86.20% | 96.40% | 100.00% |
| 2 | 2 | Tennessee | Hybrid | 88.20% | 77.90% | 86.70% | 100.00% |
| 3 | 3 | South Dakota | Hybrid | 78.70% | 62.30% | 75.50% | 98.30% |
| 4 | 4 | Oregon | Hybrid | 78.60% | 59.30% | 76.60% | 100.00% |
| 7 | 5 | Michigan | DC Plan (Hybrid Option Available) | 75.30% | 58.30% | 67.70% | 100.00% |
| 10 | 6 | Washington | Pension (Hybrid Option Available) | 74.40% | 52.20% | 72.60% | 100.00% |
| 11 | 7 | Rhode Island | Hybrid | 73.90% | 60.00% | 63.30% | 98.30% |
| 13 | 8 | Florida | DC Plan (Pension Option Available) | 73.70% | 66.50% | 63.00% | 91.80% |
| 14 | 9 | Hawaii | Hybrid | 71.00% | 41.70% | 71.50% | 100.00% |
| 15 | 10 | Virginia | Hybrid | 70.70% | 51.50% | 62.30% | 98.30% |
Notes:
(1) “Pension” means a defined benefit pension plan, “DC plan” means a defined contribution plan, “GR plan” means guaranteed return plan (or cash balance plan), and “Hybrid” means a hybrid plan that combines elements of pension, DC, and/or GR plans.
(2) Different retirement plan designs (pension, DC, guaranteed return, hybrid) have different available Retirement Benefits Score points, given the underlying variance in the kind of provisions offered by each plan design. The percentages shown are the percentage of available Retirement Benefit Score points.
(3) The following states offer multiple plans to teachers who must make a choice which they want to join: Florida, Indiana, Michigan, Ohio, Pennsylvania, South Carolina, Utah, Washington.
(4) The following states show average scores for a statewide teacher plan and separately managed municipal teacher plan: Illinois, Minnesota, Missouri, New York
(5) Colorado has separate pension plans for Denver Public Schools and all other state school districts, but both plans are managed by the same state administrative organization.
(6) Nevada has two pension plan designs with different contribution rate structures. In most school districts the employer decides which to offer, but in some places employees have a choice.
(7) Rhode Island has different hybrid plan tiers of benefits based primarily on whether or not an individual is enrolled in Social Security.
(8) Texas has two pension plan designs that new members can join that differ slightly in their provisions based on the previous state employment history of the individual.
What All of This Data Means for Teachers
Many of the lowest scoring retirement plans for teachers are those that were created in the years following the Great Recession.
While some states replaced their pension plans with lower-risk alternative plan designs that offered comparable benefits, others simply reduced the value of pension benefits offered to new teachers. The net result is that the value of pension benefits today are roughly $100,000 less than they were in 2005, a 13% decline over the past two decades.
Teachers who were already hired before states began creating new tiers of benefits with less value will still retire with the benefits they were promised. This means the benefit value reduction is going to be felt primarily by new generations of teachers.
All of the new pension plans and benefit tiers were put in place as part of a wave of legislation to reduce costs and the risks to taxpayers from future investment shortfalls. These goals are understandable in the context of economic recession and financial volatility. And in the years since as teacher pension plans have accumulated over $600 billion in pension debt — i.e., unfunded liabilities — the costs of paying this down have become an acute burden for states and school districts.
But the state legislatures who chose to continue offering pension benefits only through a lower valued tier of benefits have effectively shifted the costs of their legacy retirement plans on to educators. By cutting the benefit values for future teachers, states are forcing those individuals to find additional ways to use their salaries to save for retirement independent of the state retirement system. The best U.S. States for new teachers do not put teachers in this position.
____________
Details & Methodology Notes
Our ranking approach starts by grading each teacher retirement plan using Retirement Security Report methodology. This assigns a Retirement Benefits Score to each plan based on how well they are serving short-term teachers, medium-term teachers, and full career teachers. We blend those scores together to get an average overall score for each retirement plan. And that is what is used to determine the score for each state.
If a state only has one retirement plan that is open to enrolling new teachers, then the score for that retirement plan is the score for that state. If a state has multiple retirement plans available for new teachers to join, then we calculate the average score of those plans, and that is the score for the state.
Using this approach, the best state in the country for new teacher retirement benefits is Tennessee. Their hybrid plan for teachers serves all members well, including earning 100% of available Retirement Benefits Score points for full career teachers and 77.9% of available points for short-term teachers.
For states like Tennessee, South Dakota, or Oregon, the score for the one hybrid plan that they have available for new teacher is how we’ve ranked the state itself. For states like Pennsylvania and Michigan, each of which offers the choice of a hybrid retirement plan or defined contribution plan, we’ve averaged the scores for those plans to come up with a ranking for the state itself.
An example of how this works is South Carolina. They offer teachers the choice of a pension plan or defined contribution plan. The defined contribution plan on its own is actually the highest scoring teacher retirement plan in the country, but the South Carolina pension plan does not get very good scores. The average of those two puts South Carolina in fourth among the states with 78% of available points scored — 10% percentage points below Tennessee.
In cases where a state has a plan for teachers that is intended to be supplemental to primary retirement benefits or is only offered to part-time teachers, we do not include that in the state’s average. We also do not include retirement plans that are only offered to non-certified public school employees or plans exclusively for higher education employees.
The Best U.S. States for New Teacher Retirement Benefits
There are lots of factors that new, prospective K–12 teachers have to consider when entering the education workforce. People typically pay the most attention to things like salary, location, and health insurance benefits, but what U.S. States are the best for new teachers looking for secure retirement?
Retirement benefits are a unique form of compensation in that they are deferred compensation. It is straightforward to compare the salaries offered to teach in one county versus another, or even to look at the health insurance benefits (medical plus dental? plus vision?) offered by one school district versus another. But comparing retirement plans on a state-by-state basis is a more difficult because there is no intuitive way to understand the value of one pension plan versus another, or whether a hybrid plan or defined contribution (DC) plan might be more valuable.
This article provides a ranking of states based on the quality of retirement benefits that they offer to new teachers entering the workforce in 2022-23, first published in Special Report #2 of the Retirement Security Report Teacher Edition.
Jump to the Complete Rankings
The Top 10 / Bottom 10 States by Average Quality of Retirement Benefits for New Teachers
- South Carolina (94.2%)
- Tennessee (88.2%)
- South Dakota (78.7%)
- Oregon (78.6%)
- Michigan (75.3%)
- Washington (74.4%)
- Rhode Island (73.9%)
- Florida (73.7%)
- Hawaii (71.0%)
- Virginia (70.7%)
…
- Illinois (49.7%)
- Mississippi (49.6%)
- Alabama (49.1%)
- New Jersey (48.0%)
- Nevada (47.1%)
- Georgia (46.2%)
- Wisconsin (46.1%)
- Kentucky (46.1%)
- Texas (44.9%)
- Louisiana (33.8%)
The score shown for each state is the percentage of available Retirement Benefits Score points that the retirement system averages overall for all open retirement plans available to public school teachers for the 2022-23 school year.
How States are Ranked
Our approach to ranking states is to grade each retirement plan offered to public school teachers based on the quality of benefits offered to three groups of people: those who are only going to teach for 10-years or less (“short-term” teachers), those who are going to spend 10-20 years in the classroom (“medium-term” teachers), and those who will teach in K–12 education for their entire lives (“full career” teachers).
This ranking includes all types of retirement plans for teachers, including “pension” plans, “defined contribution” plans, “guaranteed return” (or “cash balance”) plans, and “hybrid” plans that blend together various elements from the first three plan types.
While most teachers do not make their job decisions based on the retirement benefits being offered, today’s workforce is highly mobile and very much in flux. It is easily conceivable that someone who is getting their teaching certificate or finishing up an education program or considering changing professions might have some flexibility in where they want to go to work.
Read the Report for Full Details on How We Measured Each Teacher Retirement Plan
State Ranking
States Ranked by Best Retirement Plan Available to New Public School Teachers
| wdt_ID | Rank | State | Best Plan Available (Design Type) | Overall Retirement Benefits Score | "Short-Term" Teacher Score | "Medium-Term" Teacher Score | "Full Career" Teacher Score |
|---|---|---|---|---|---|---|---|
| 1 | 1 | South Carolina | DC Plan (Pension Option Available) | 94.20% | 86.20% | 96.40% | 100.00% |
| 2 | 2 | Tennessee | Hybrid | 88.20% | 77.90% | 86.70% | 100.00% |
| 3 | 3 | South Dakota | Hybrid | 78.70% | 62.30% | 75.50% | 98.30% |
| 4 | 4 | Oregon | Hybrid | 78.60% | 59.30% | 76.60% | 100.00% |
| 7 | 5 | Michigan | DC Plan (Hybrid Option Available) | 75.30% | 58.30% | 67.70% | 100.00% |
| 10 | 6 | Washington | Pension (Hybrid Option Available) | 74.40% | 52.20% | 72.60% | 100.00% |
| 11 | 7 | Rhode Island | Hybrid | 73.90% | 60.00% | 63.30% | 98.30% |
| 13 | 8 | Florida | DC Plan (Pension Option Available) | 73.70% | 66.50% | 63.00% | 91.80% |
| 14 | 9 | Hawaii | Hybrid | 71.00% | 41.70% | 71.50% | 100.00% |
| 15 | 10 | Virginia | Hybrid | 70.70% | 51.50% | 62.30% | 98.30% |
Notes:
(1) “Pension” means a defined benefit pension plan, “DC plan” means a defined contribution plan, “GR plan” means guaranteed return plan (or cash balance plan), and “Hybrid” means a hybrid plan that combines elements of pension, DC, and/or GR plans.
(2) Different retirement plan designs (pension, DC, guaranteed return, hybrid) have different available Retirement Benefits Score points, given the underlying variance in the kind of provisions offered by each plan design. The percentages shown are the percentage of available Retirement Benefit Score points.
(3) The following states offer multiple plans to teachers who must make a choice which they want to join: Florida, Indiana, Michigan, Ohio, Pennsylvania, South Carolina, Utah, Washington.
(4) The following states show average scores for a statewide teacher plan and separately managed municipal teacher plan: Illinois, Minnesota, Missouri, New York
(5) Colorado has separate pension plans for Denver Public Schools and all other state school districts, but both plans are managed by the same state administrative organization.
(6) Nevada has two pension plan designs with different contribution rate structures. In most school districts the employer decides which to offer, but in some places employees have a choice.
(7) Rhode Island has different hybrid plan tiers of benefits based primarily on whether or not an individual is enrolled in Social Security.
(8) Texas has two pension plan designs that new members can join that differ slightly in their provisions based on the previous state employment history of the individual.
What All of This Data Means for Teachers
Many of the lowest scoring retirement plans for teachers are those that were created in the years following the Great Recession.
While some states replaced their pension plans with lower-risk alternative plan designs that offered comparable benefits, others simply reduced the value of pension benefits offered to new teachers. The net result is that the value of pension benefits today are roughly $100,000 less than they were in 2005, a 13% decline over the past two decades.
Teachers who were already hired before states began creating new tiers of benefits with less value will still retire with the benefits they were promised. This means the benefit value reduction is going to be felt primarily by new generations of teachers.
All of the new pension plans and benefit tiers were put in place as part of a wave of legislation to reduce costs and the risks to taxpayers from future investment shortfalls. These goals are understandable in the context of economic recession and financial volatility. And in the years since as teacher pension plans have accumulated over $600 billion in pension debt — i.e., unfunded liabilities — the costs of paying this down have become an acute burden for states and school districts.
But the state legislatures who chose to continue offering pension benefits only through a lower valued tier of benefits have effectively shifted the costs of their legacy retirement plans on to educators. By cutting the benefit values for future teachers, states are forcing those individuals to find additional ways to use their salaries to save for retirement independent of the state retirement system. The best U.S. States for new teachers do not put teachers in this position.
____________
Details & Methodology Notes
Our ranking approach starts by grading each teacher retirement plan using Retirement Security Report methodology. This assigns a Retirement Benefits Score to each plan based on how well they are serving short-term teachers, medium-term teachers, and full career teachers. We blend those scores together to get an average overall score for each retirement plan. And that is what is used to determine the score for each state.
If a state only has one retirement plan that is open to enrolling new teachers, then the score for that retirement plan is the score for that state. If a state has multiple retirement plans available for new teachers to join, then we calculate the average score of those plans, and that is the score for the state.
Using this approach, the best state in the country for new teacher retirement benefits is Tennessee. Their hybrid plan for teachers serves all members well, including earning 100% of available Retirement Benefits Score points for full career teachers and 77.9% of available points for short-term teachers.
For states like Tennessee, South Dakota, or Oregon, the score for the one hybrid plan that they have available for new teacher is how we’ve ranked the state itself. For states like Pennsylvania and Michigan, each of which offers the choice of a hybrid retirement plan or defined contribution plan, we’ve averaged the scores for those plans to come up with a ranking for the state itself.
An example of how this works is South Carolina. They offer teachers the choice of a pension plan or defined contribution plan. The defined contribution plan on its own is actually the highest scoring teacher retirement plan in the country, but the South Carolina pension plan does not get very good scores. The average of those two puts South Carolina in fourth among the states with 78% of available points scored — 10% percentage points below Tennessee.
In cases where a state has a plan for teachers that is intended to be supplemental to primary retirement benefits or is only offered to part-time teachers, we do not include that in the state’s average. We also do not include retirement plans that are only offered to non-certified public school employees or plans exclusively for higher education employees.
Introducing the Retirement Security Report Teacher Edition
On June 28th, Equable Institute issued the Retirement Security Report Teacher Edition (2022). The report builds on The Retirement Security Report (RSR) initiative launched last year that evaluated the quality of retirement benefits offered to public workers nationwide using Equable’s Retirement Benefits Score methodology for all 335 statewide retirement plans currently open to new hires at that time.
The Teacher Edition of the report is an in-depth look at the 316 retirement plans currently offered to teachers and non-instructional staff in the U.S., including those offered to new hires and legacy plans with active enrollees – adding more than 200 plans to both our benefits database and interactive retirement security scorecards. The resulting omnibus analysis is comprised of four papers – a summary report and 3 special reports – that illuminate the state of teacher retirement benefits today.
Summary Report: “The National Landscape of Teacher Retirement Benefit Security”
The National Landscape of Teacher Retirement Benefit Security provides an overvie of teacher retirement benefits in America. The paper highlights the trends in the value of pension benefits, evaluates how well teachers are being served by the retirement plans offered to them based on plan type, and other key trends and analysis that are further expanded upon in the three special reports.
Read and Download the Summary Report
Special Report #1: “The Fading Value of Teacher Retirement Benefits in America”
Special Report #1 looks at historical trends in the value of teacher retirement benefits. Analyzing lifetime benefit values going back to 1965, the report shows teachers today enrolled in a pension will earn 13% less in retirement than a teacher hired before the Great Recession. The report also evaluates similar trends in value for other retirement plan types.
Read and Download Special Report #1
Special Report #2: “The Best U.S. States for New Teacher Retirement Benefits”
Special Report #2 ranks states by the quality of their retirement benefits offered to new teachers using Equable’s Retirement Benefits Score methodology. The report offers two rankings: The first based on the best-scoring plan offered to teachers in each state and the second based on the average score for all plans.
Read and Download Special Report #2
Special Report #3: “Important Elements of Quality Teacher Retirement Plans”
Special Report #3 analyzes the design elements of the top-scoring plans in the Retirement Security database. The paper illuminates the best practice in plan design that help to ensure retirement income security for teachers.
Read and Download Special Report #3
In the coming days and weeks, we will be highlighting key findings and more data from the Retirement Security Report Teacher Edition. Visit equable.org/rsr to read more RSR content and learn more about the initiative.
About the Retirement Security Report
The RSR is a universe of in-depth research, interactive tools, policy scores and other resources to shed light on the quality and value of retirement benefits for all public workers. All RSR projects are based on data from our comprehensive benefit database of retirement plans offered to public workers and use an open-source scoring methodology that accounts for three primary criteria: Eligibility, Income Adequacy (based on a 70% pre-retirement income replacement rate), and Flexibility & Mobility.
Retirement Security Report Teacher Edition: Comprehensive Plan Scores
The Retirement Security Report Teacher Edition analyzes the state of teacher retirement benefits in the United States. While the omnibus report highlights some of the best and worst performing plans using Equable’s Retirement Benefits Score methodology, readers may be interested in diving deeper in accessing the full set of scores to determine how specific states and plan types stack up for America’s teachers.
The searchable and sortable table provides the Retirement Benefits Scores for each of 316 retirement plans offered to teachers and non-instructional staff by worker tenure that are included in the report. Detailed teacher retirement plan scores for each plan can also be accessed in our interactive tool here.
Retirement Security Report Teacher Plan Retirement Benefit Scores
| wdt_ID | State | Plan Name | Class Name | Plan Type | Social Security Enrollment | Status: Legacy Plan or Open to New Hires | Overall Retirement Benefits Score | Short-Term Teacher Score | Medium-Term Worker Score | Full Career Teacher Score |
|---|---|---|---|---|---|---|---|---|---|---|
| 1 | Alabama | Alabama Teachers' Retirement System | AL TRS Tier 1 | traditional pension plan | required | Legacy Plan | 53.2% | 33.0% | 51.3% | 75.2% |
| 2 | Alabama | Alabama Teachers' Retirement System | AL TRS Tier 2 | traditional pension plan | required | Open to New Hires | 49.1% | 32.8% | 41.1% | 73.4% |
| 3 | Alaska | Alaska Teachers’ Retirement System - Defined Contribution Retirement Plan | AK TRS DC | defined contribution plan | not available | Open to New Hires | 70.3% | 55.7% | 59.7% | 95.5% |
| 4 | Alaska | Alaska Public Employees' Retirement System - Defined Benefit Plan Noncertificated School District Employees Tier 2 | AK PERS Noncertificated School District Employees Tier 2 | traditional pension plan | not available | Legacy Plan | 56.5% | 43.8% | 55.9% | 69.8% |
| 5 | Alaska | Alaska Public Employees' Retirement System - Defined Benefit Plan Noncertificated School District Employees Tier 3 | AK PERS Noncertificated School District Employees Tier 3 | traditional pension plan | not available | Legacy Plan | 56.5% | 43.8% | 55.9% | 69.8% |
| 6 | Alaska | Alaska Public Employees' Retirement System - Defined Benefit Plan Noncertificated School District Employees Tier 1 | AK PERS Noncertificated School District Employees Tier 1 | traditional pension plan | not available | Legacy Plan | 53.6% | 44.5% | 56.8% | 59.6% |
| 7 | Alaska | Alaska Teachers’ Retirement System - Defined Benefit Plan | AK TRS DB Tier 2 | traditional pension plan | not available | Legacy Plan | 52.1% | 35.3% | 58.4% | 62.6% |
| 8 | Alaska | Alaska Teachers’ Retirement System - Defined Benefit Plan | AK TRS DB Tier 1 | traditional pension plan | not available | Legacy Plan | 51.9% | 35.6% | 56.2% | 63.9% |
| 9 | Arizona | Arizona State Retirement System | AZ SRS Teachers Post-2013 | traditional pension plan | required | Open to New Hires | 59.8% | 45.1% | 47.7% | 86.7% |
| 10 | Arizona | Arizona State Retirement System | AZ SRS Teachers Pre-2013 | traditional pension plan | required | Legacy Plan | 59.6% | 44.6% | 47.6% | 86.7% |
| State | Plan Name | Class Name | Plan Type | Social Security Enrollment | Status: Legacy Plan or Open to New Hires | Overall Retirement Benefits Score | Short-Term Teacher Score | Medium-Term Worker Score | Full Career Teacher Score |
About the Retirement Security Report
The RSR is a universe of in-depth research, interactive tools, policy scores and other resources to shed light on the quality and value of retirement benefits for all public workers. All RSR projects are based on data from our comprehensive benefit database of retirement plans offered to public workers and use an open-source scoring methodology that accounts for three primary criteria: Eligibility, Income Adequacy (based on a 70% pre-retirement income replacement rate), and Flexibility & Mobility.
State of Pensions 2021: National Pension Funding Trends
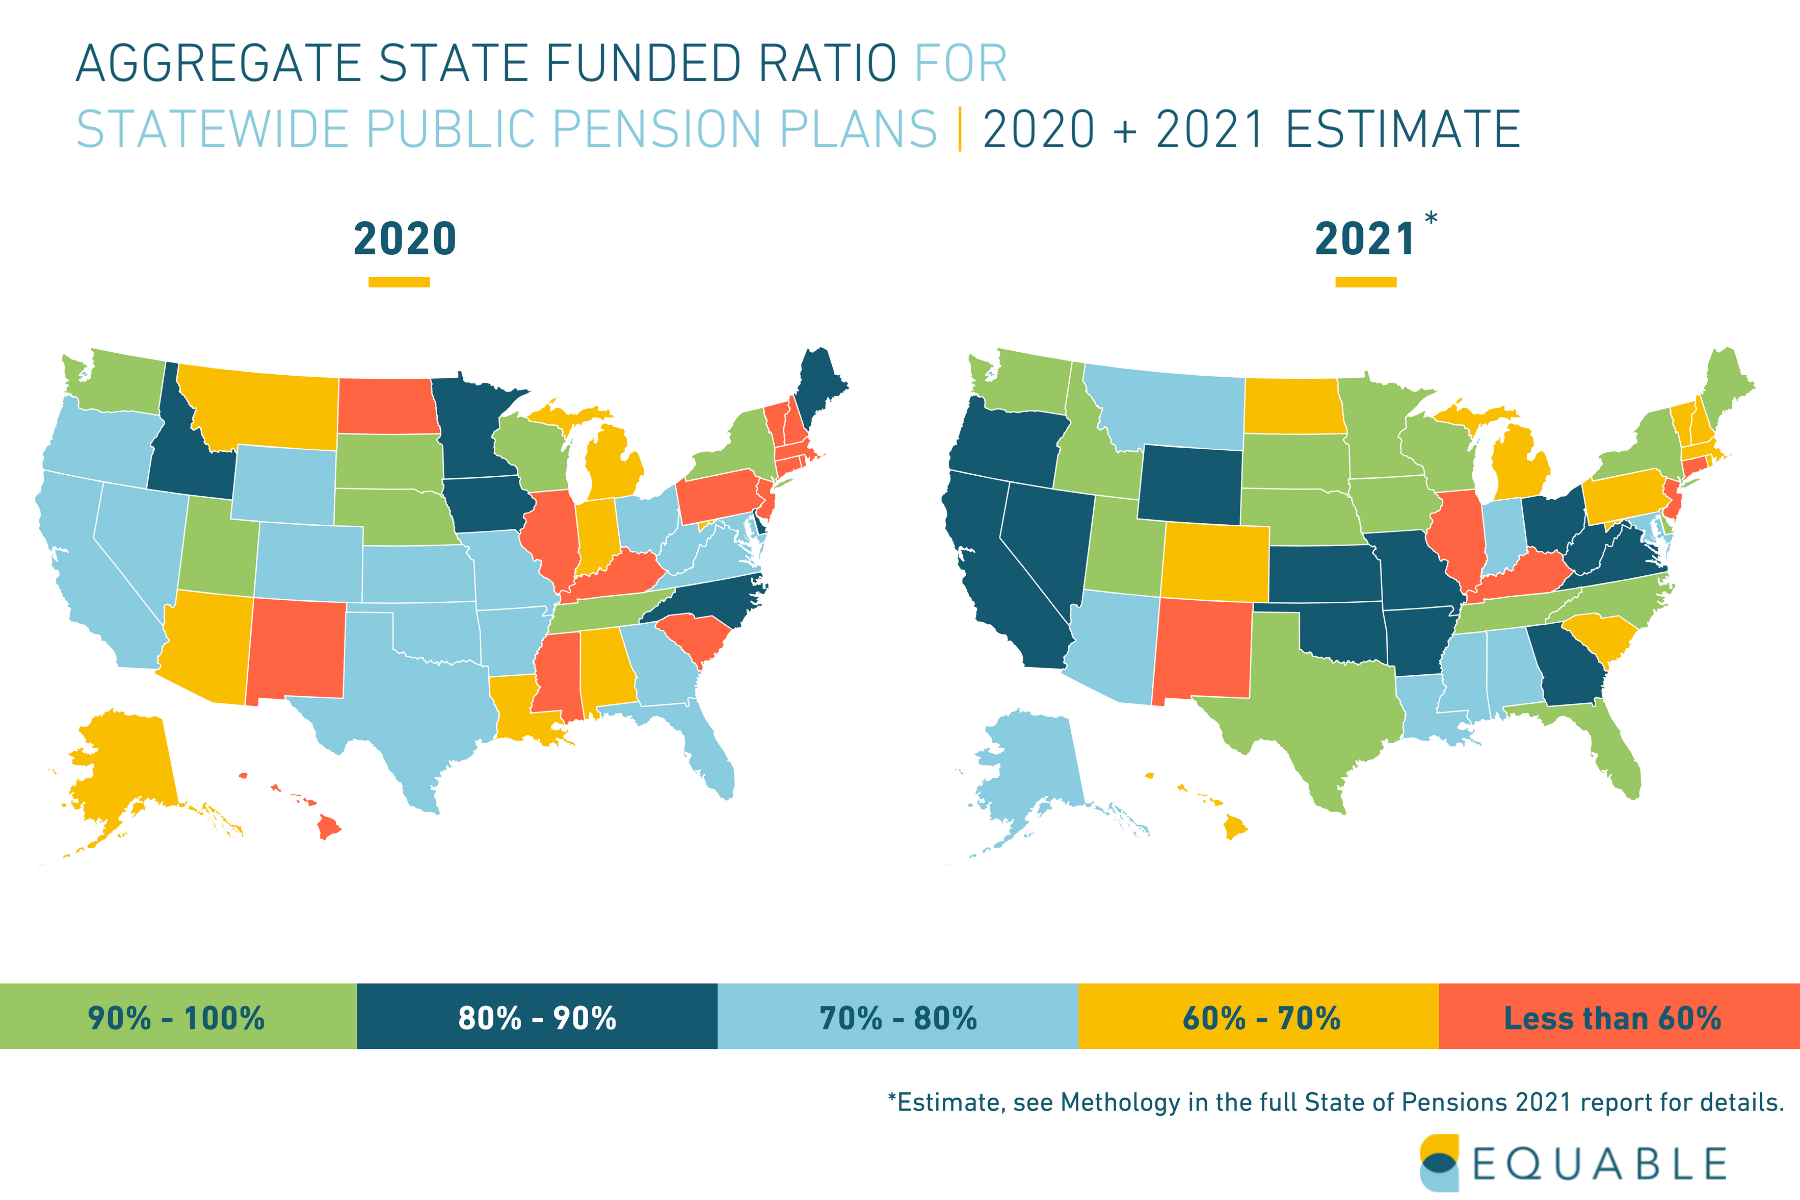
U.S. public pension funding in 2021 experienced strong investment returns in the most recent fiscal year, but the funded ratio for most statewide retirements plans are only back to 2008 levels, a new Equable Institute report on national pension funding trends shows. In this post, we will look at the core reasons behind why pension funds are struggling to get back to pre-Great Recession numbers.
A few strong years over the past decade have helped improve the 10-year average, but for much of the 20th century average returns have been less than assumed — in part because while interest rates fell sharply assumed returns declined only gradually.
As a result, pension fund assets grew less than expected, which was a key reason for the growth in unfunded liabilities up until 2021’s massive year of investment performance.
State of Pensions 2021: Public Pension Debt is Dropping.
What is the public pension funding gap in 2021?
The national pension funding shortfall (or pension debt) for statewide retirement systems was $1.48 trillion at the end of 2020, per Equable Institute’s State of Pensions 2020 report.
The funding shortfall — formally called unfunded liabilities — is the gap between money held by pension funds and the value of all future benefits it has promised to pay. This is also sometimes called pension debt.
The shortfall was, in part, caused by investment volatility set off by the Covid-19 pandemic. But in the past year investments have been strong, and we think 2021’s those returns will shrink the funding shortfall to $1.08 trillion.
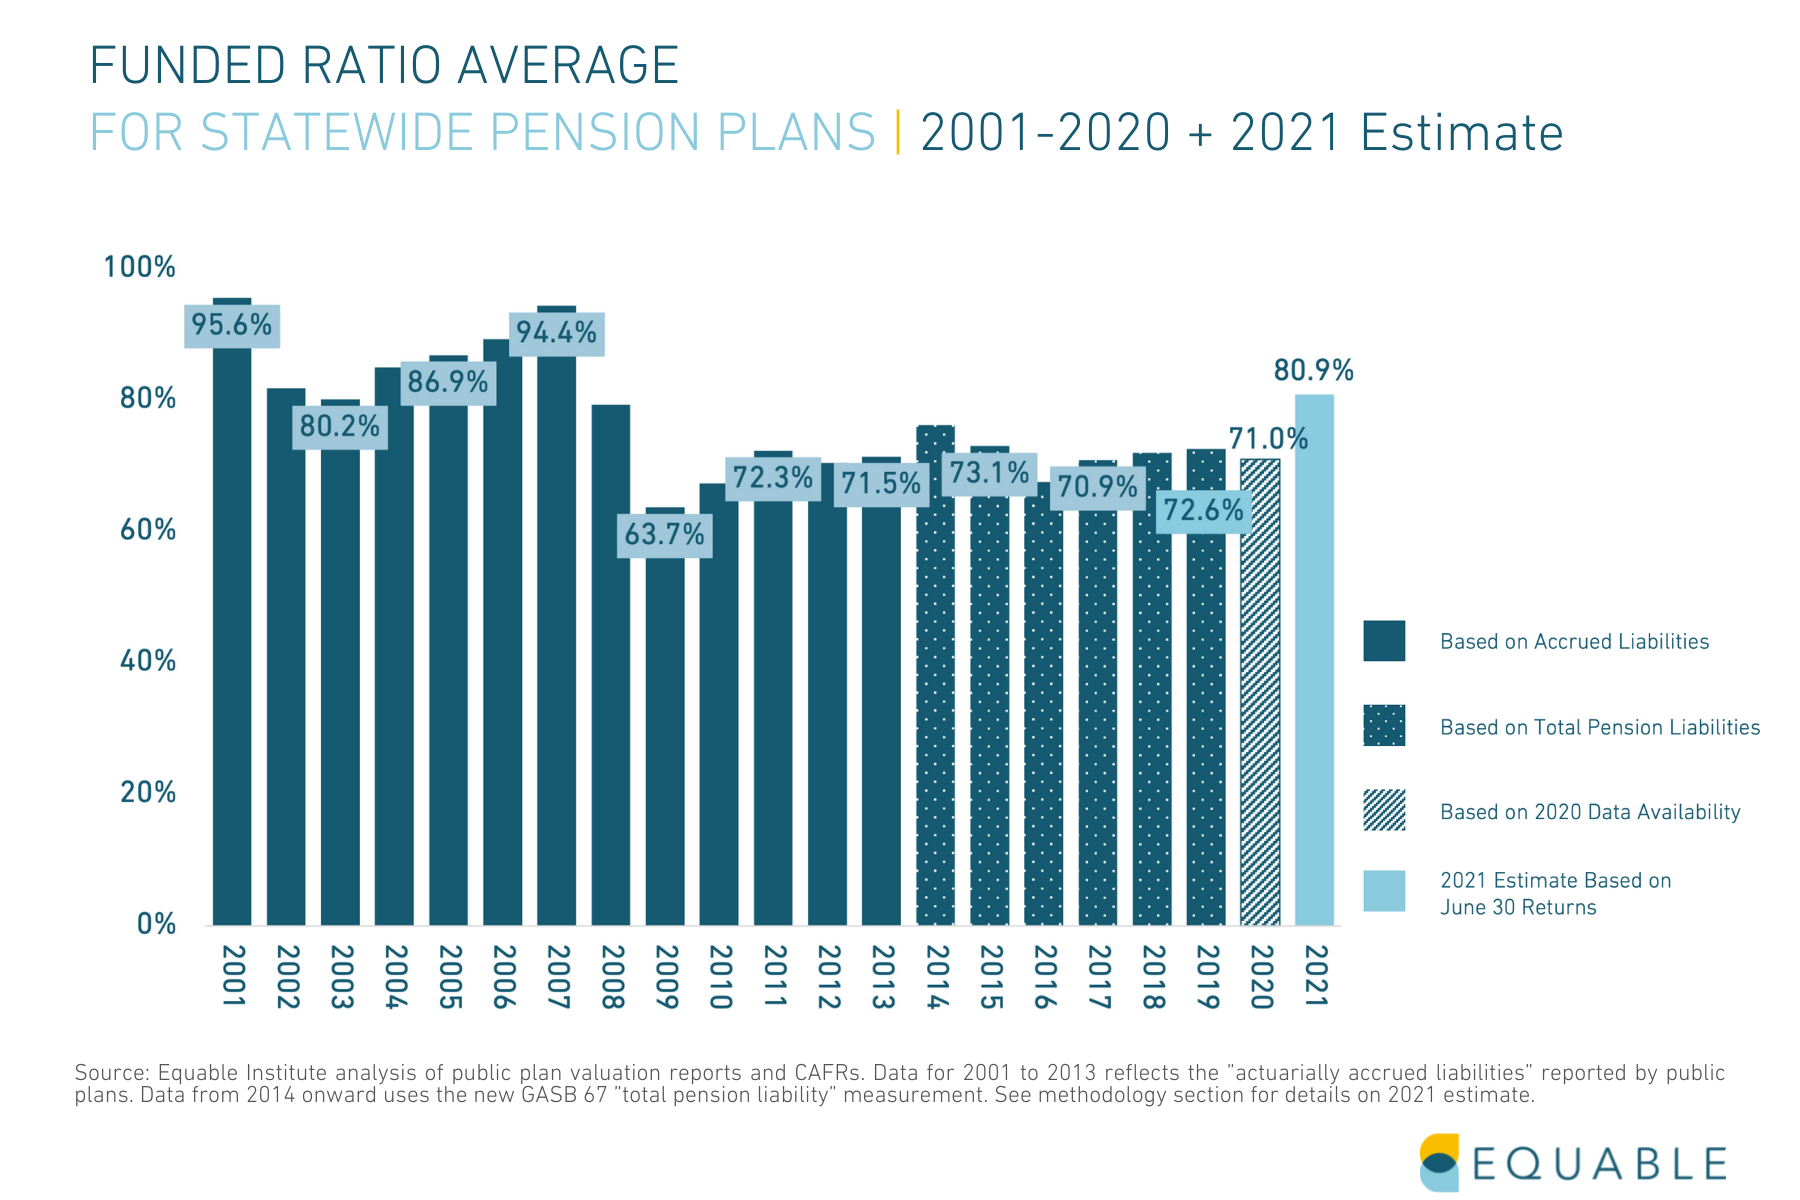
On average, this means American public pensions plans are currently holding 80.9% of assets required to pay future retirees their pension benefits. This is positive, but still much lower than the funded ratios in 2007 or 2008.
By contrast, in 2007 before the Great Recession, statewide retirement systems in the U.S. had 93.8% of the money promised to current and future public retirees. Losses because of the Financial Crisis of 2008 knocked this funded ratio down to 80%.
So while pension funds have been able to recoup the losses experienced during the Covid-19 pandemic, they have still not recovered from the 2008 recession. And capital market forecasts are warning future returns are likely to be muted, perhaps in part because the double-digit returns this year have pulled forward investment returns from future years.
This means the increase in funded ratios will not be long-lasting, especially if states don’t cut their assumed rate of returns.
Why the Assumed Rate of Return Matters
Public pension systems use an assumed rate of return to calculate what dollars will be needed to cover pension benefits due to future retirees. When there is a large gap between (a) the actual returns pension funds receive from their investments, and (b) the rate that they assume they will earn, then (c) pension funding shortfalls grow.
For several years, a significant gap between projected earnings and fiscal reality has existed for public pension plans in many states. Still, the assumed rates of return used by many statewide retirement systems have remained significantly higher than actual investment earnings. A handful of states have meaningfully reduced their assumed rates of return in response to economic shifts, with the average assumed rate of return at 7.03% in 2021—down from 8.05 in 2001.
Interest rates are considered an indicator of future market performance. Declining interest rates indicate that investments will likely see slower investment return gains in the future. This is important because it means that historic performance is not a good indicator of future performance. Many pension funds report that they have had strong investment returns over the past 30 or 40 years — and this is true. But unfortunately those numbers do not actually mean very much for the future. They include investment returns from the 1980s or 1990s, which were very different economic times.
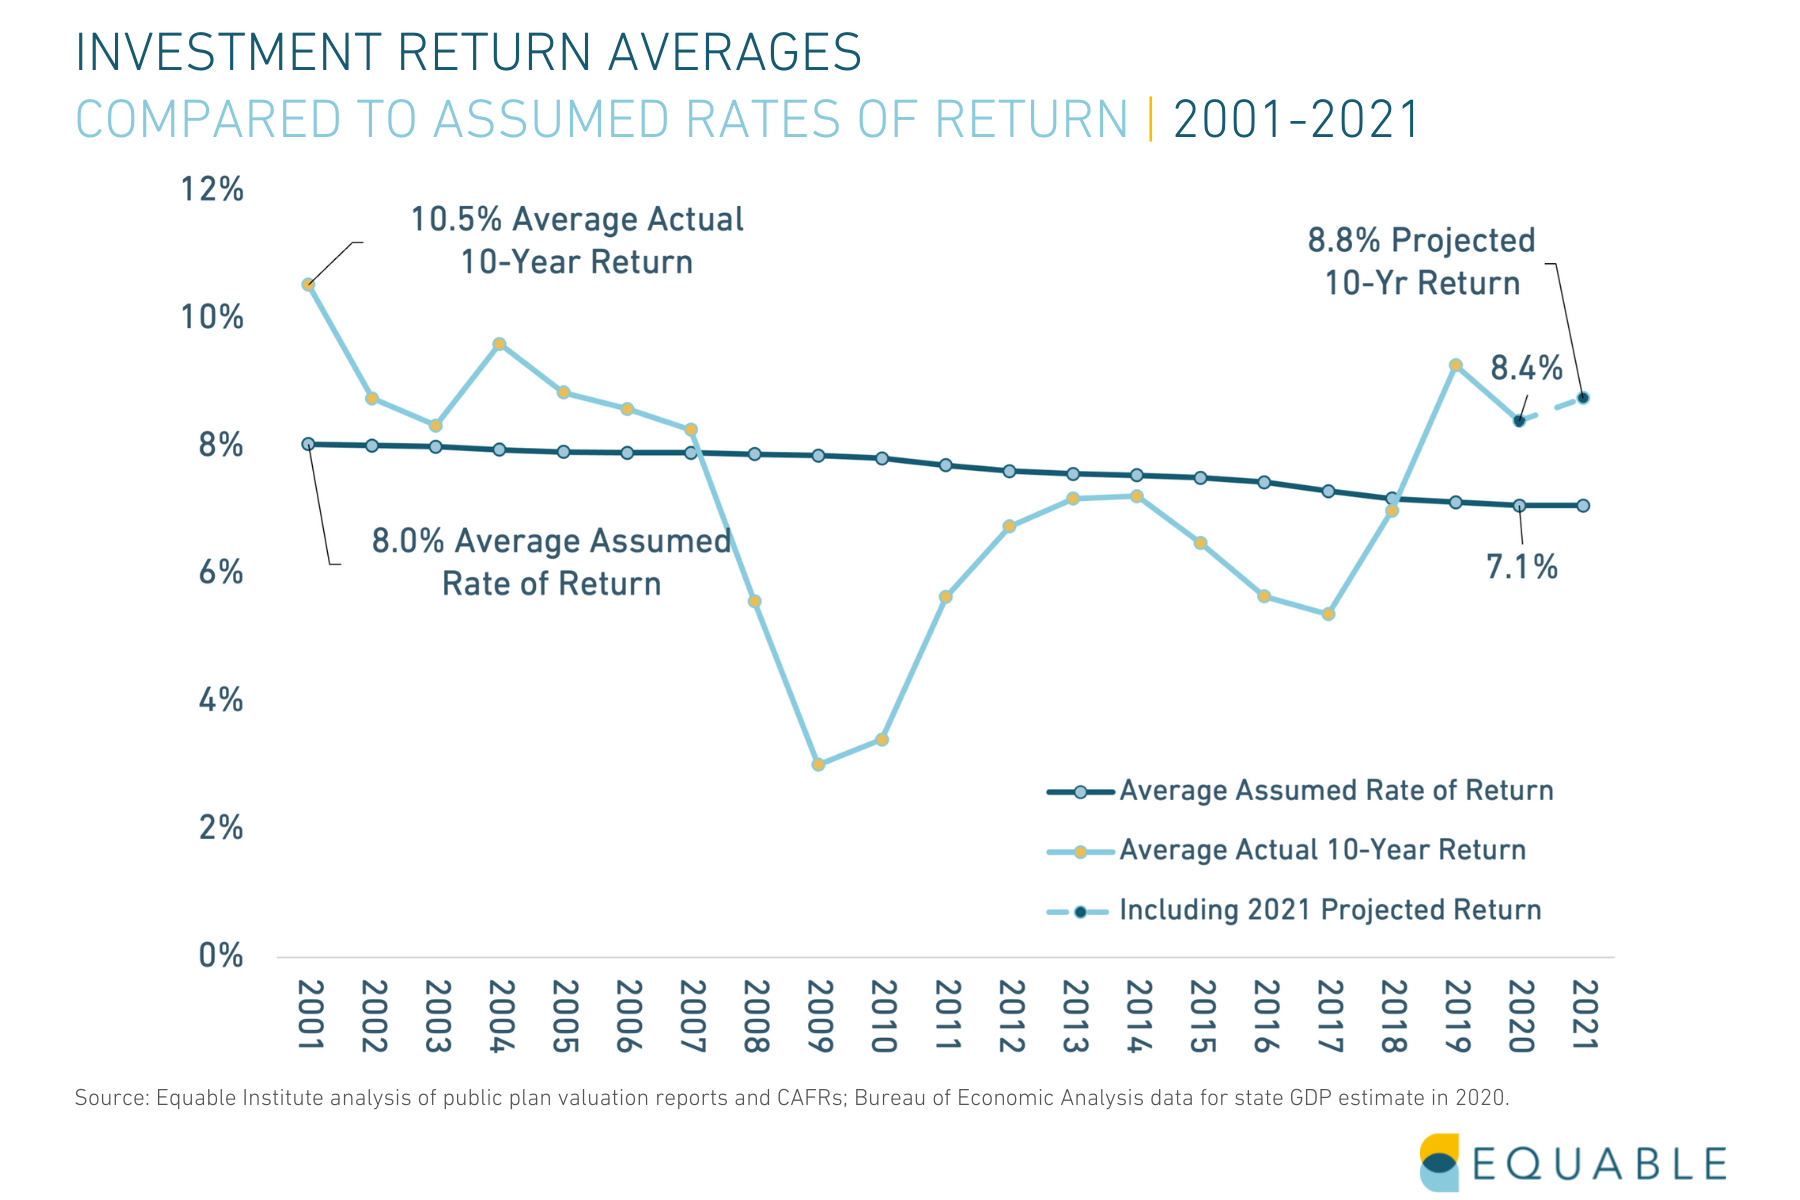
While interest rates over the past two decades have rapidly declined, pension fund assumed rates of return have not kept pace. Meaning many funds are either over-estimating what their investments will earn or they are making a lot of high risk, high reward investments to try and hit their optimistic targets.
The chart below shows the recent trend in assumed rates of return in tandem with interest rates. They have not kept pace with each other. Today, the average assumed rate of return for statewide pension funds is 7.2%. If assumed returns had kept pace with declining interest rates since 2001, the average assumed rate of return in 2019 would have been around 4.9%.
The often highly optimistic assumed rate of return used by most pension funds to make financial decisions may be increasingly hard to achieve if America’s path to economic recovery remains uncertain.
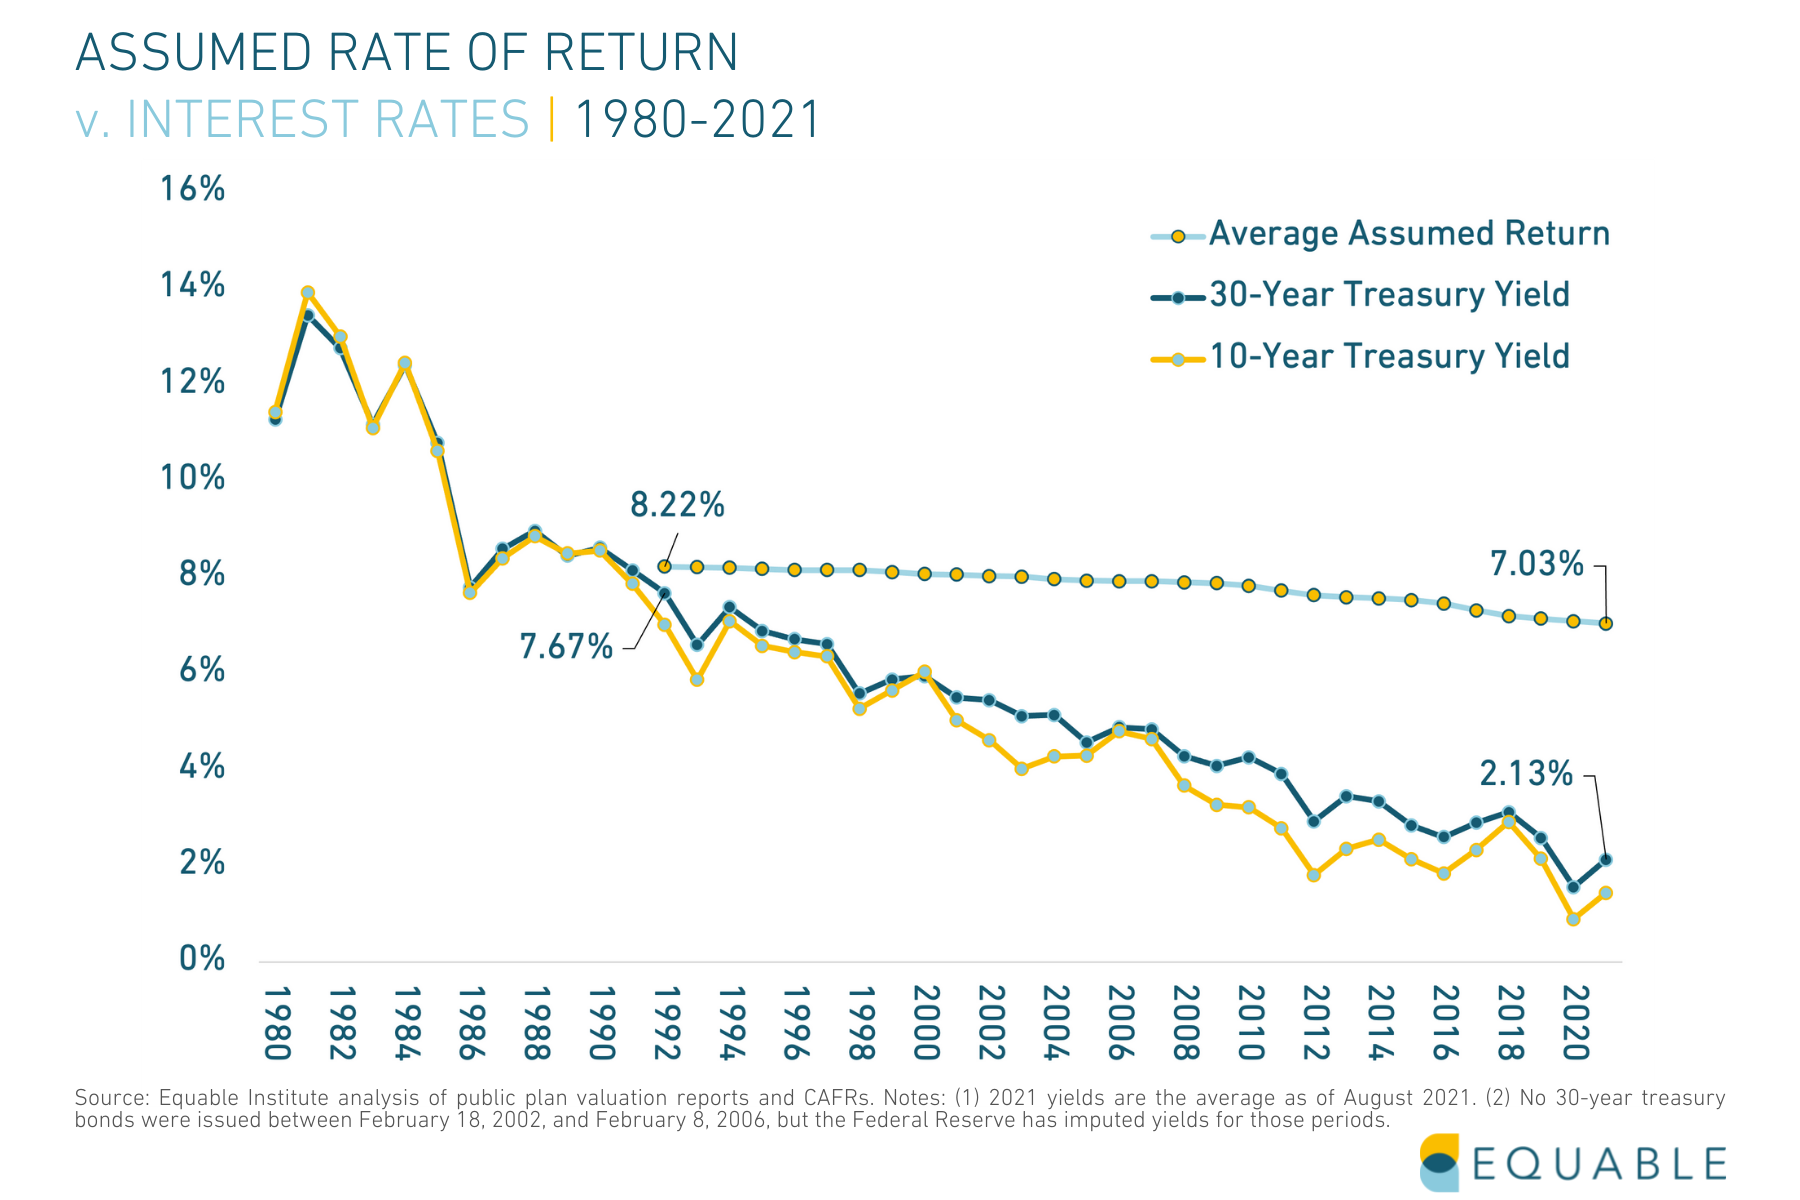
How does national pension funding debt affect public workers?
The pension debt carried by governments is costly to pay down and creates pressure on the public budget. It may cause an increase in required pension contributions for public employees or benefit reduction like the elimination of cost-of-living (COLA) adjustments for retirees. Higher employee contribution rates means less money in public workers’ paychecks—and in recent years, the first number has been growing while the latter shrinks.
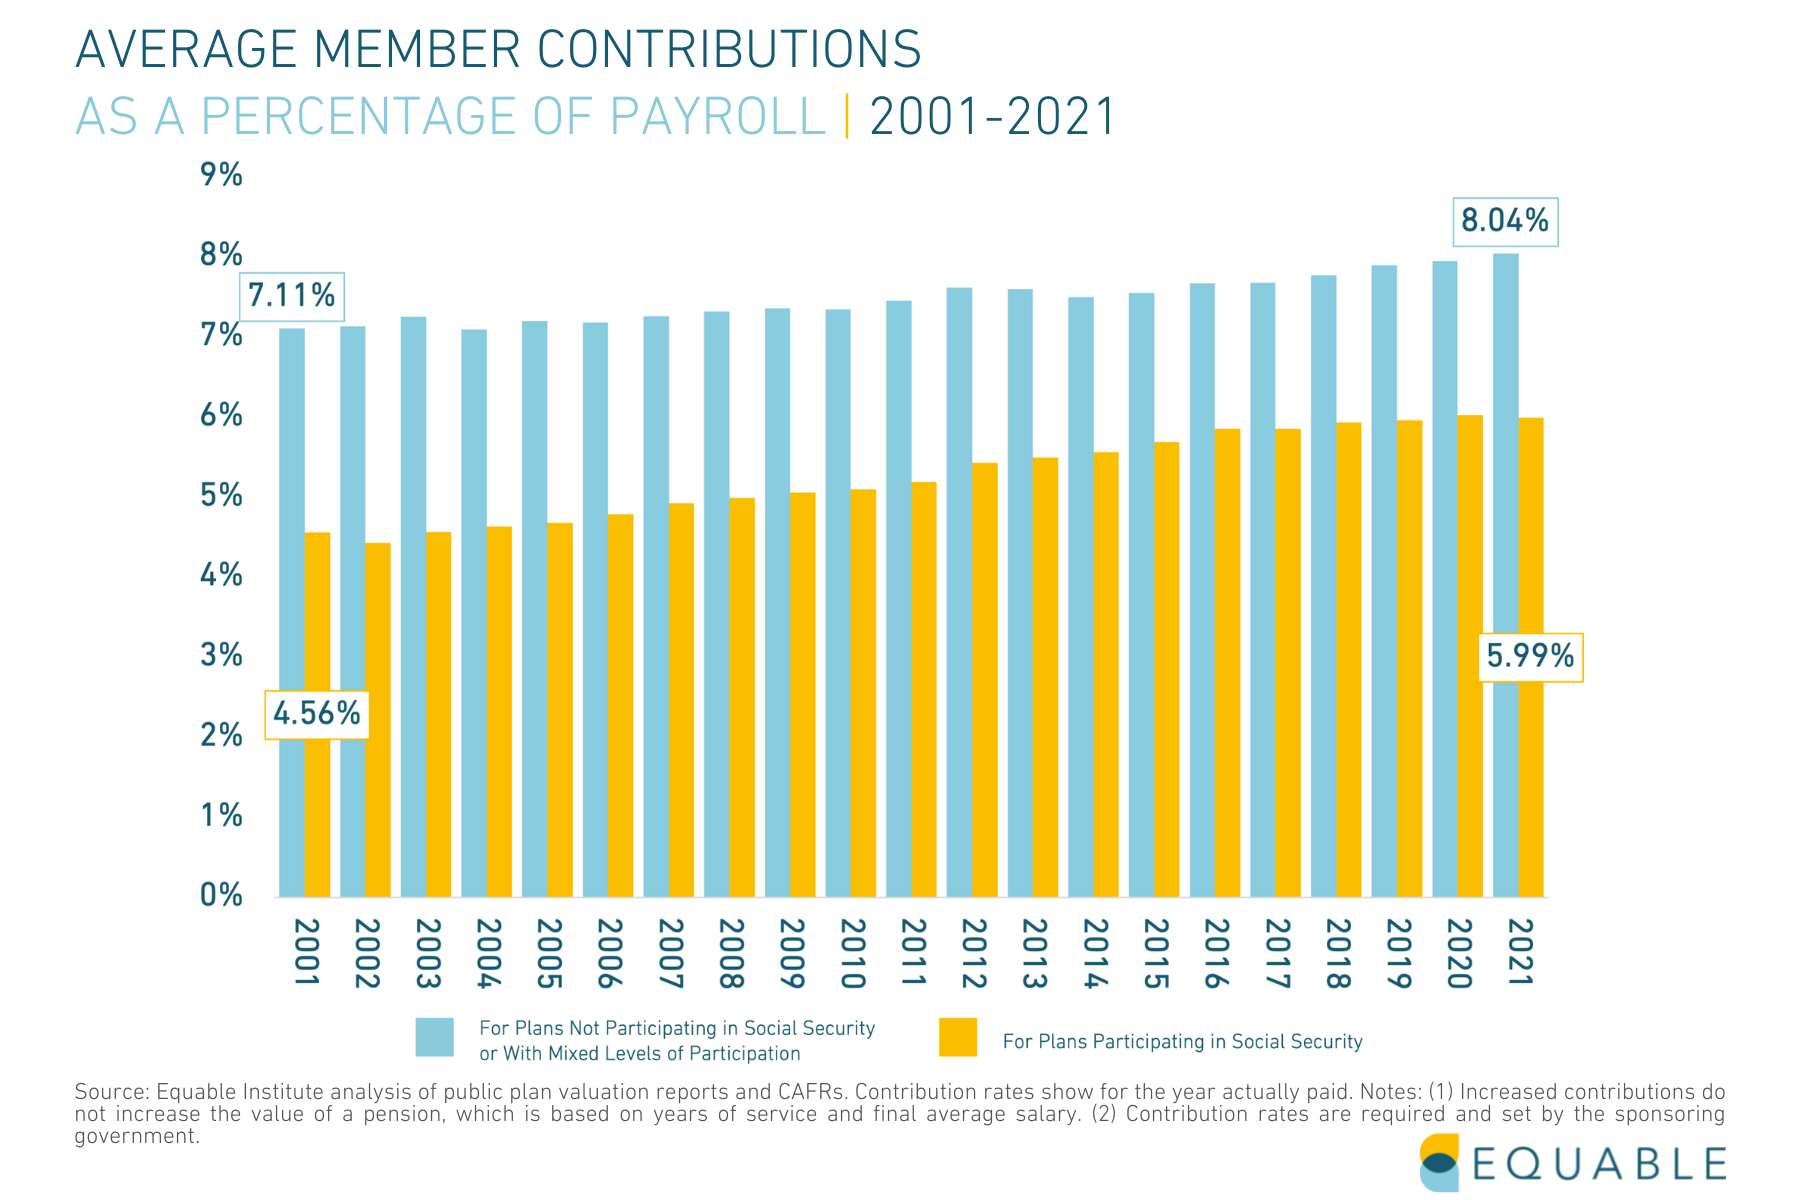
Public sector workers who are also enrolled in Social Security paid 143 basis points more (a 31.4% increase) during the 2021 fiscal year than they did during the 2001 fiscal year and 20.0% more than they did in 2008 before the financial crisis.
Those who do not participate in Social Security will pay 13.1% more than in 2001 and 9.8% more than in 2008.
In times of economic hardship, higher contribution rates may also result in higher property taxes, delayed raises, cuts in school funding, and a reduction in essential services like public sanitation.
State of Pensions 2021: Public Pension Plans Are Diversifying their Assets
To try and make up for the lower projected returns on stocks and bonds, states will likely continue to utilize alternative investments like hedge funds and private equity strategies to chase higher returns.
Since 2001, pension funds have placed a higher percentage of their assets into hedge funds, real estate, and private equities, investment categories known for volatility in times of economic uncertainty.
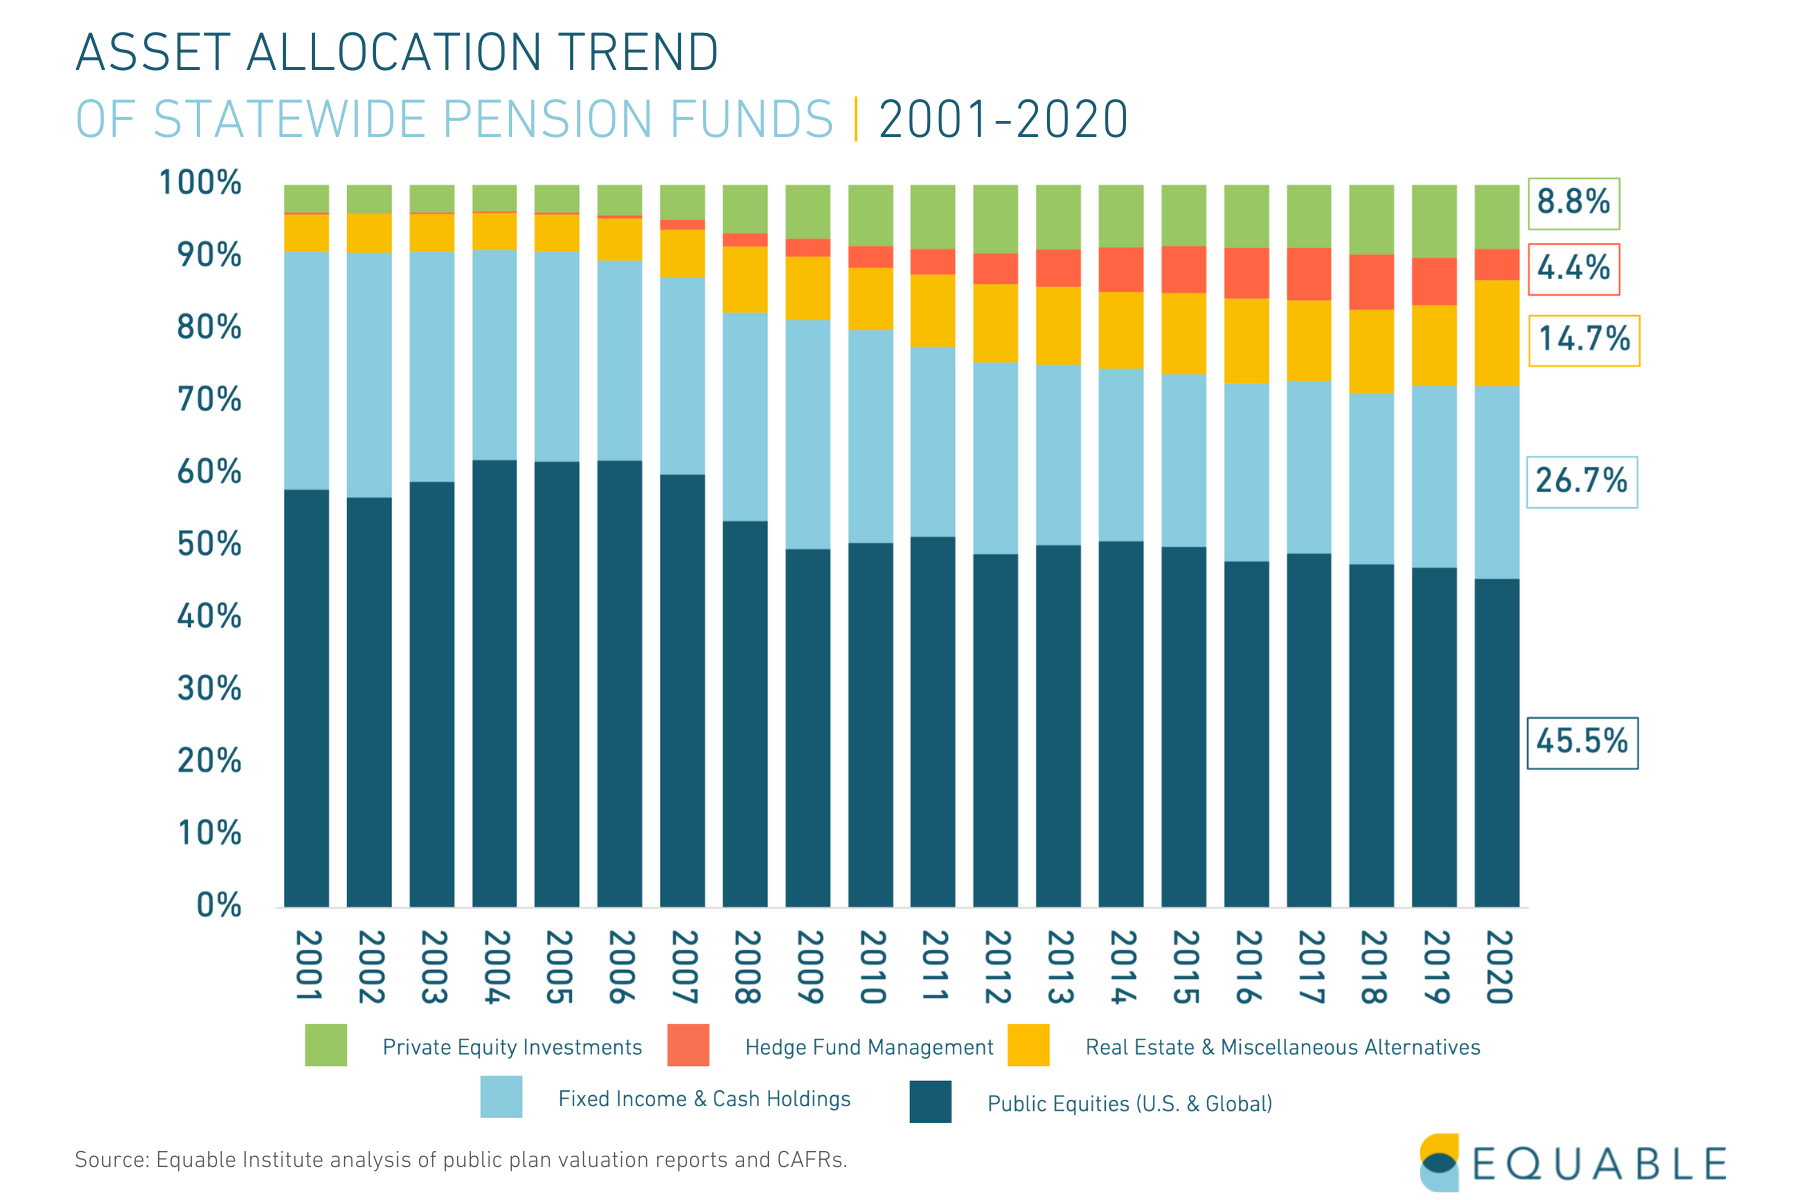
Ultimately, as state pension funds are in competition with each other on these deal and market strategies statistically speaking there are going to be plans that lose out on this work. Unless state pension funding in 2021 has particularly better success than the market, it is likely that the net average result across all plans will be relatively modest performance at best and at worst performance below passive equity investment strategies.
Some of the alternative investments that state pension funds have adopted might produce higher returns and might help hedge against sharp downturns in the stock market. But they also carry much higher risks that are only justifiable if the objective is to try and earn an unreasonably high assumed rate of return target.
The State of Pensions 2021: Most Public Pension Systems Are Still Financially Fragile or Distressed
What does public pension underfunding mean for states?
Despite the most recent fiscal year’s strong investment returns, it’s unlikely those earnings will do much to cut the number of plans that are financially fragile or distressed—which right now stands at 49% of all statewide plans. Fragile status generally means a retirement plan is between 60% and 90% funded and, while they’re not at immediate risk of insolvency, they will be building up unfunded liabilities that will gradually become a strain on budgets and government revenues. One or two asset shocks could send the plan into a downward spiral.
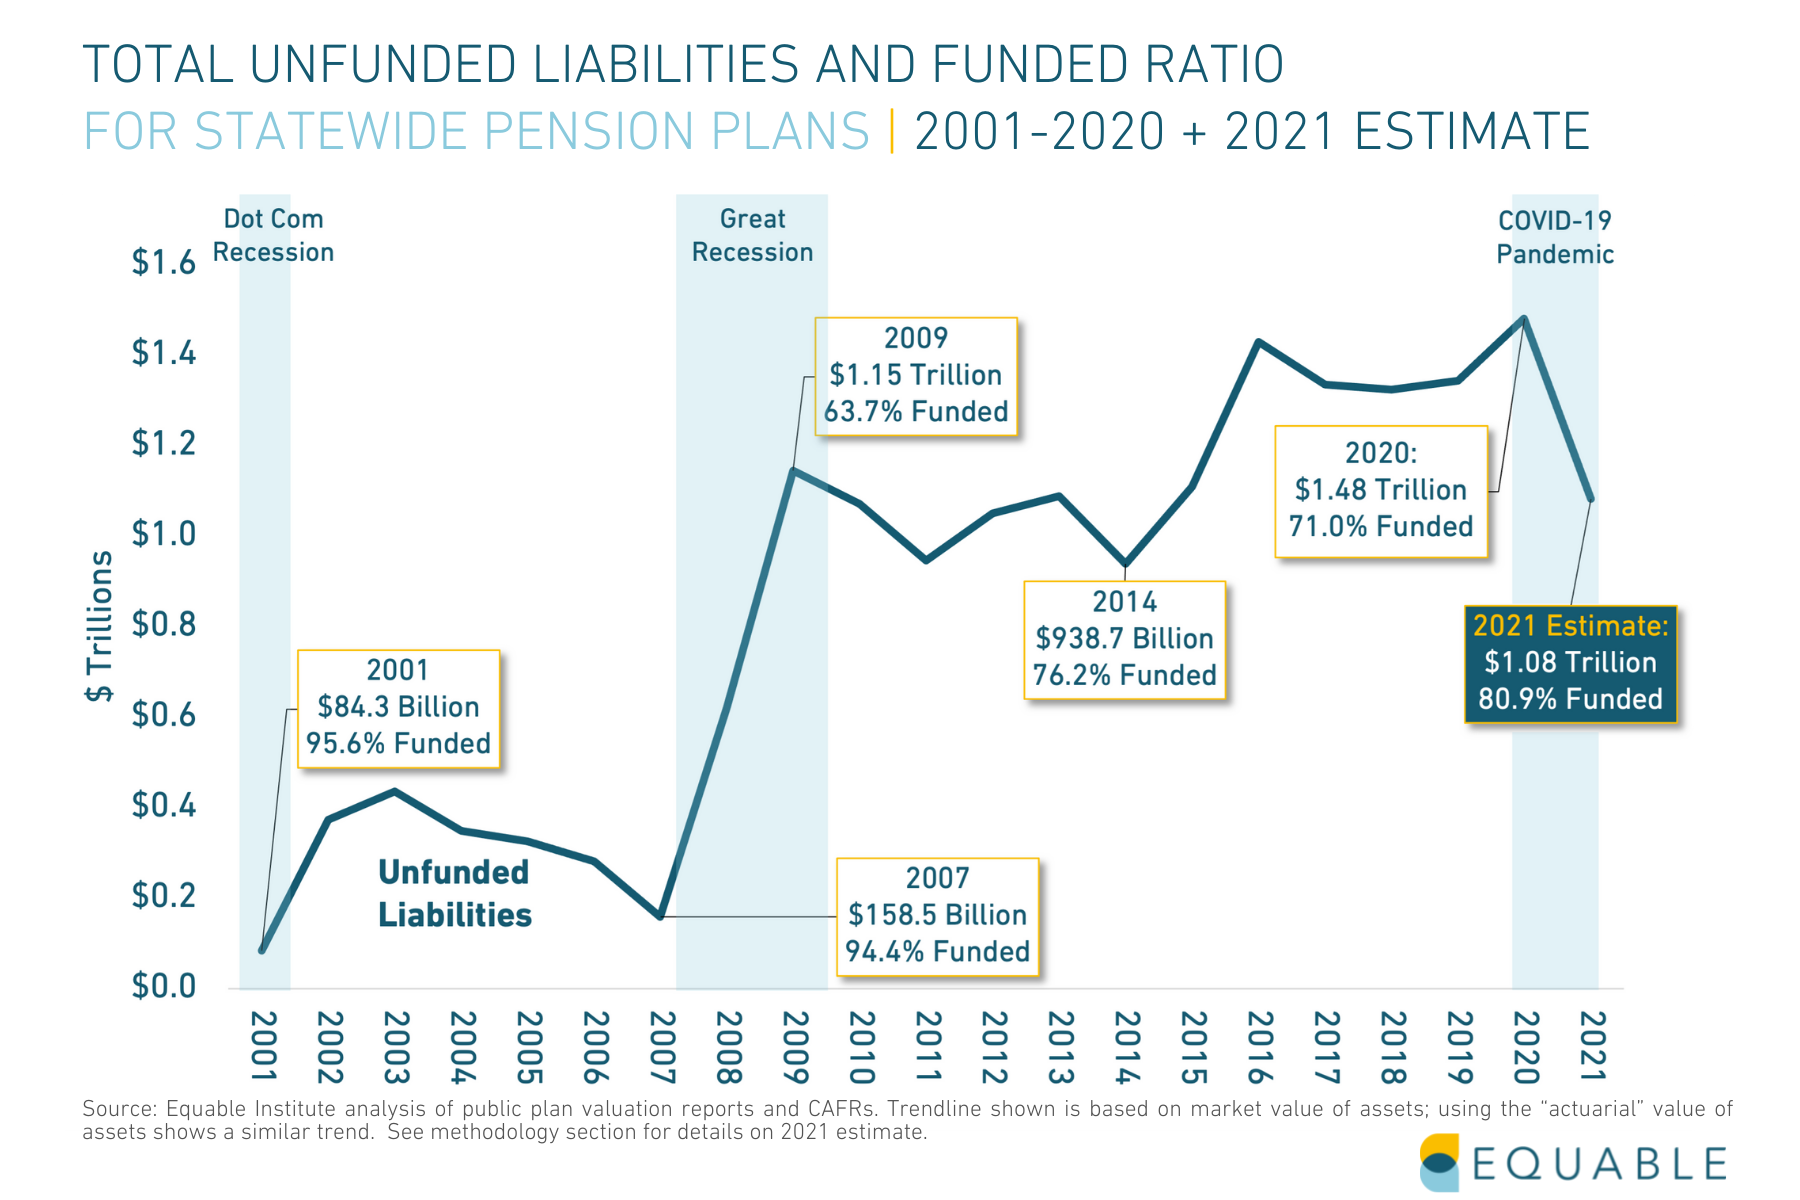
The funded ratio and pension funding shortfall are not the sole indicators of the health of a pension plan. Understanding the size of unfunded liabilities relative to the size of a state’s economy gives a sense of what scale of resources will be needed from a local tax base to improve funded status.
Prior to the pandemic, unfunded liabilities already accounted for a large share of states’ GPDs. We said the pandemic would lead to higher unfunded liability to GDP ratios because of increasing funding shortfalls and economic contraction. Federal stimulus dollars provided by the American Rescue Plan is likely to mitigate much of the expected GDP decline, but the funded ratio dynamics are still at play.
Today, only 26% of all statewide pension plans are considered economically resilient, according to the Equable Institute report, which means holding assets that cover 90% or more of promised public employee pension benefits for at least a few consistent years.
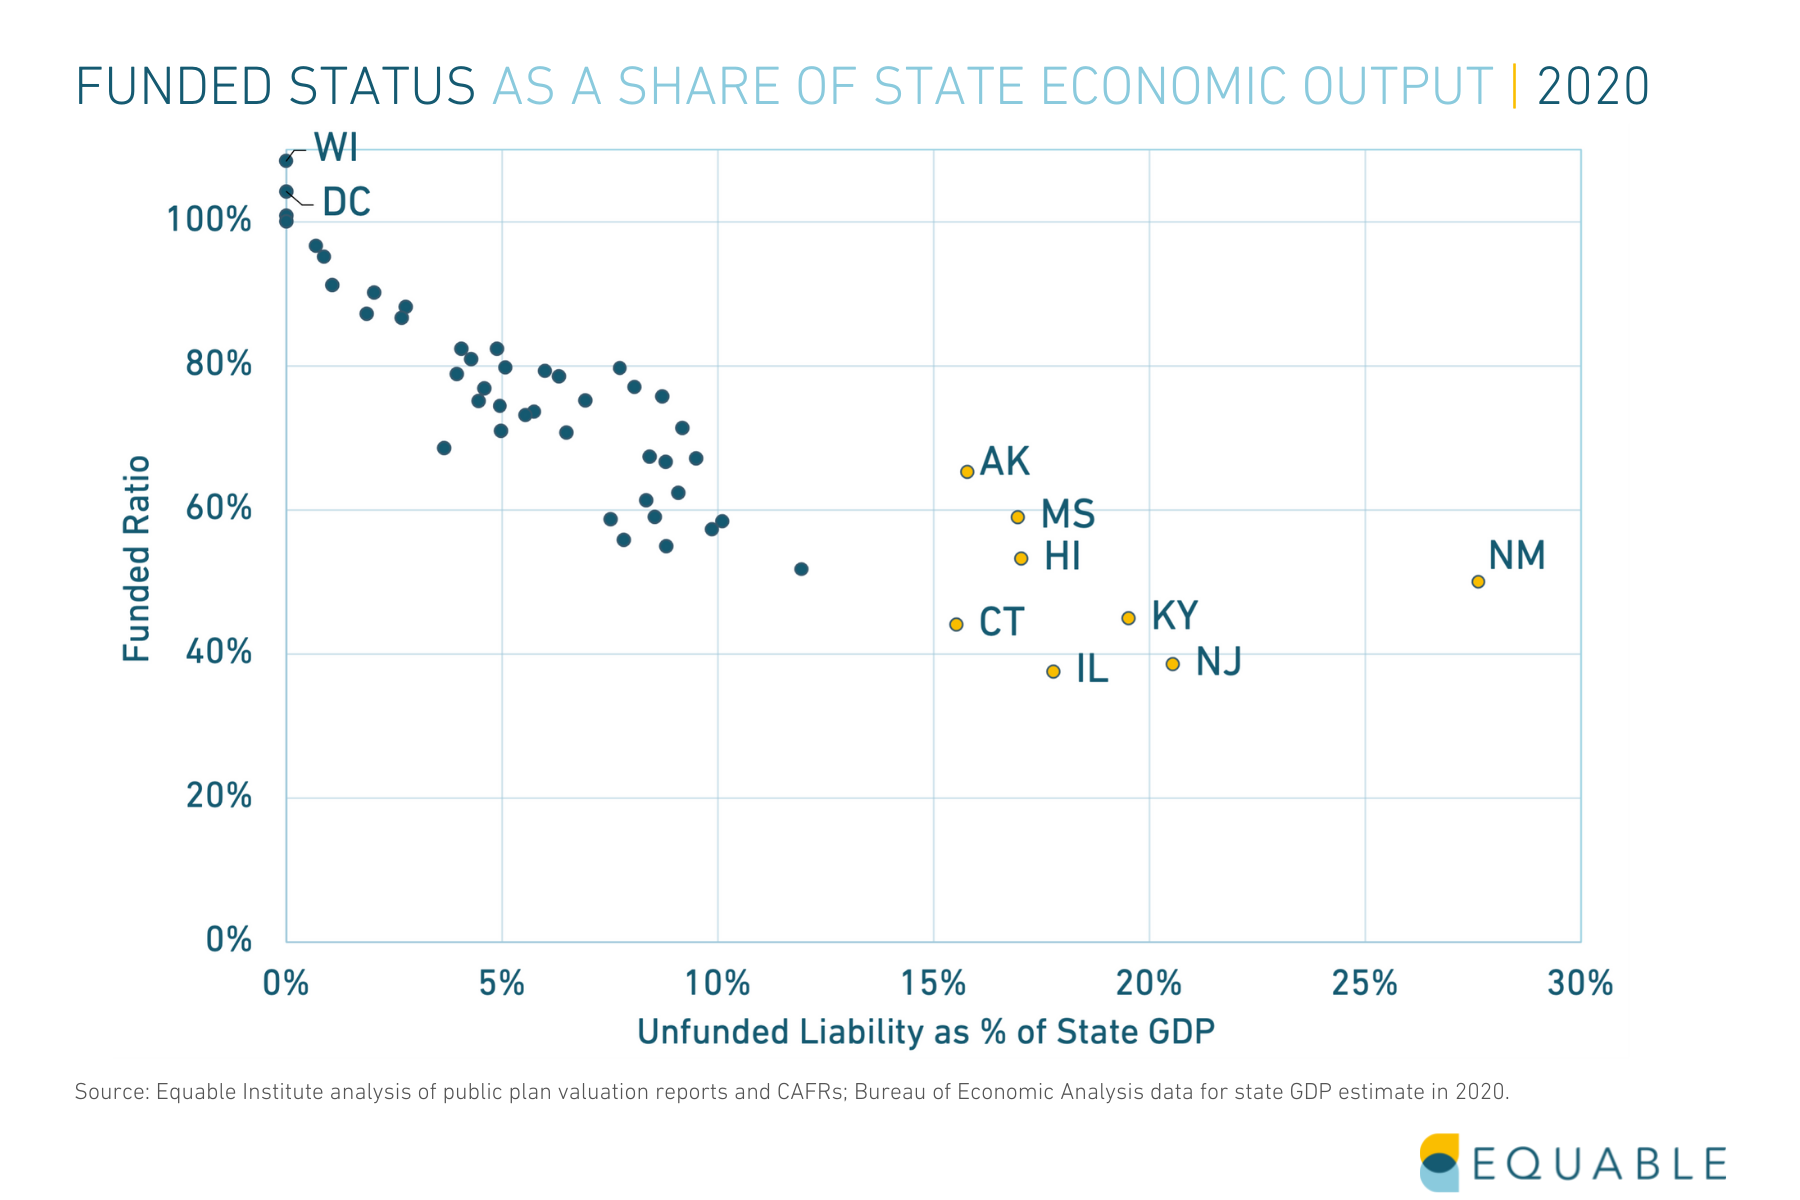
How will underfunded public pension funds cover promised benefits for workers?
There are three strategies that states might take in seeking to ensure they can pay promised benefits to workers: increase contributions into their pension funds, pursue higher investment returns, or reduce the value of benefits.
Cutting benefits is unconstitutional in nearly every state, but in certain places benefits have been reduced by cutting back on the inflation adjustment of pension checks.
Pursuing higher investment returns has been the primary strategy of the past decade. While a few state pension funding 2021 plans were able to recover and some years produced good returns, overall investment returns have not been high enough for everyone to recover. States will continue using this strategy, but it has high risks. And if it doesn’t succeed that leaves only the other two strategies.
The other key strategy is increasing contributions. Usually, when unfunded pension liabilities rise steadily over the years, employer contributions experience an uptick along with required employee paycheck deductions. Just throwing more money into state pension funds doesn’t always help, though, if the underlying reasons that the funding shortfall is growing in the first place are not addressed. That means pension debt and employee contributions may rise unabated until a change in policy mandates a reversal of problematic practices. Even a boon in investment returns has historically offered no guarantee that state and local governments will make debt payments in a timely fashion.
Click Here to Read the Full State of Pensions 2021 Report
State of Pensions 2021: National Retirement Benefit Trends
Statewide national Pension benefit trends look different than they did at the beginning of the century, or even at the start of the previous decade. In this piece, we’ll examine some of the changes made to statewide plans over the past few years and how those changes effect public workers’ retirements. While more options have been created by state legislatures, there’s still a lack of retirement security for all public sector workers—especially as it pertains to cost-of-living adjustments.
Retirement Plans Available to New Hires
In 2001, there were 225 total retirement plans and benefit tiers open to new hires nationwide—this included traditional Pension plans (which make up the bulk of all available plans), Defined Contribution plans (as a primary source of retirement income), Guaranteed Return plans (sometimes called “cash balance”), and Hybrid plans (combinations of the other designs). That number now stands at 337. The increase in total plans and tiers is due, in part, to states designing options and plans for narrower segments of the workforce.
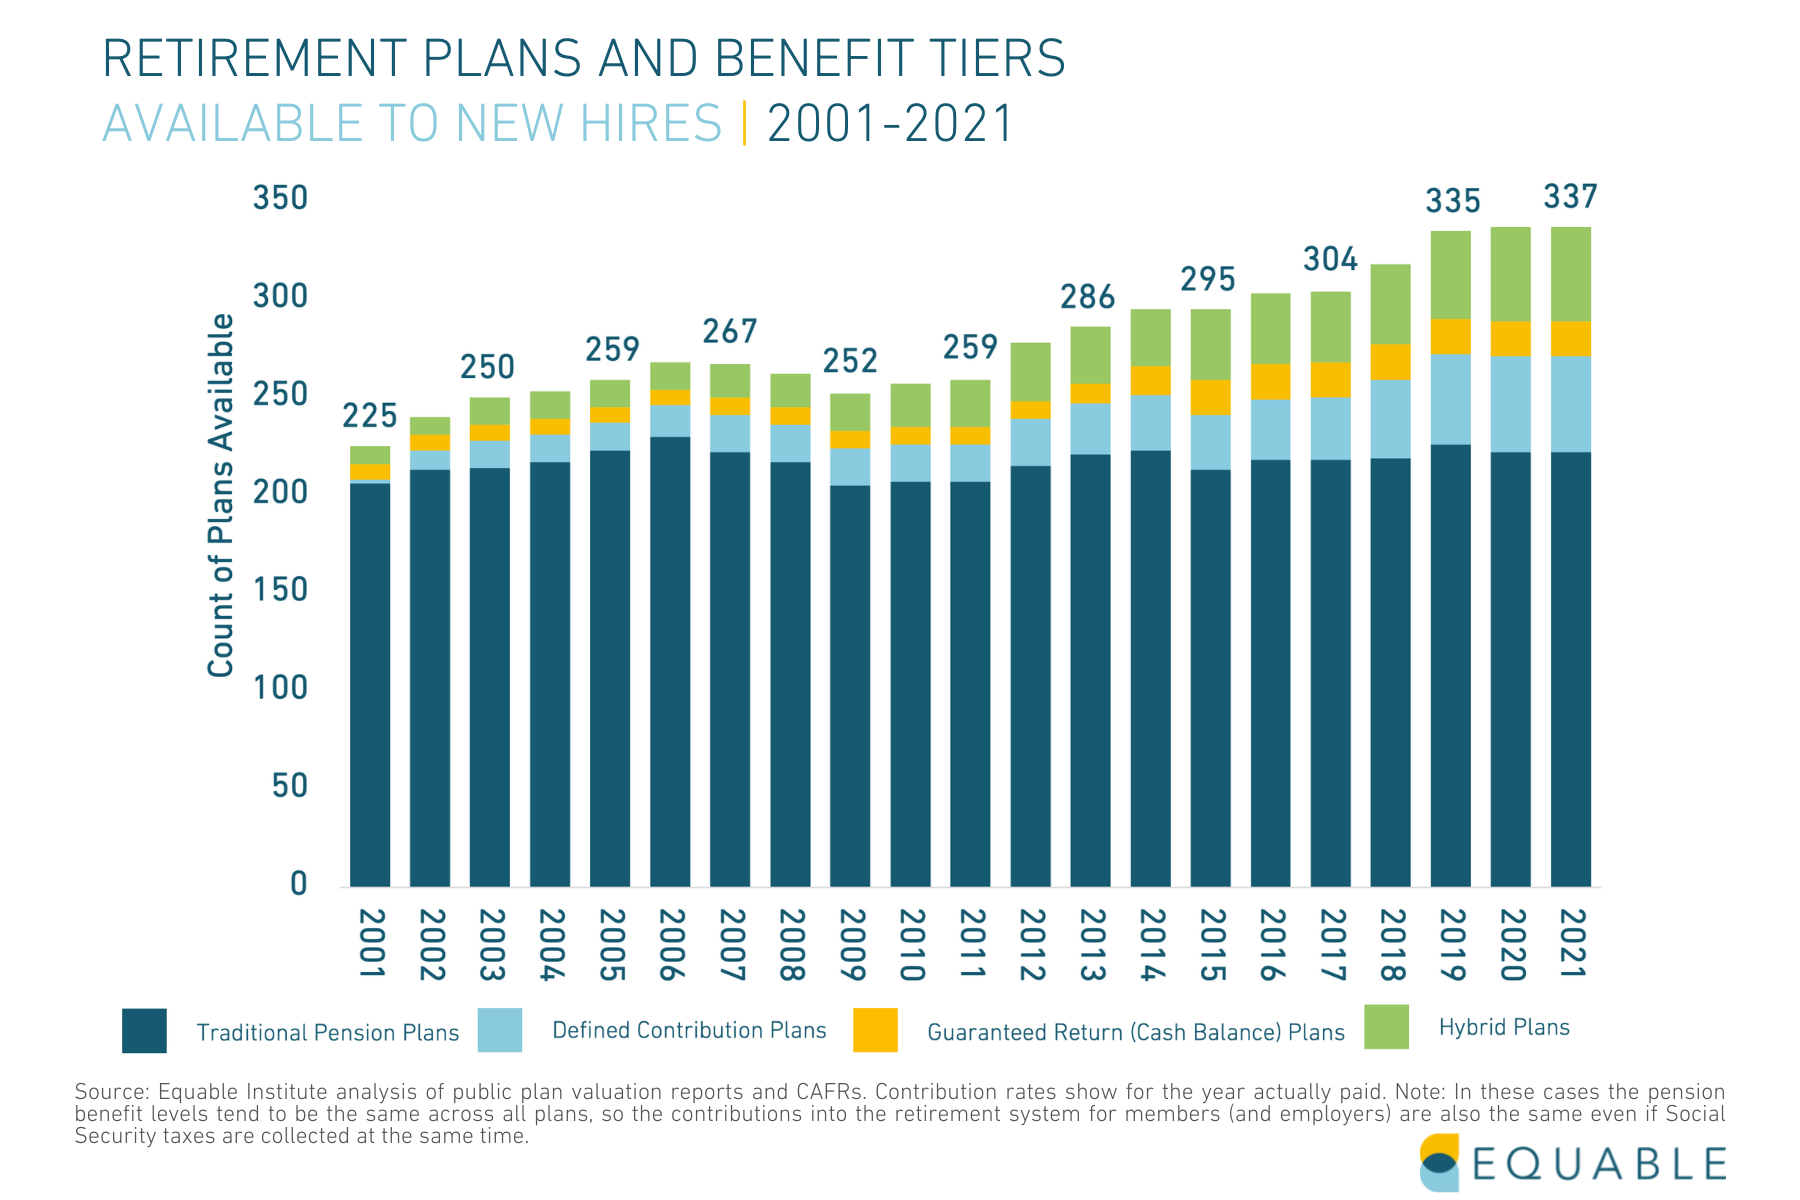
This expansion of benefit designs generally has focused on adding “Hybrid” plans that combine guarantees with individual accounts, while stand alone Defined Contribution and Guaranteed Return Plans have also increased in availability over the past decade.
Two notable tier additions occurred in the last year in Kentucky and Texas. In The Bluegrass State, the Legislature created a new tier within the Teachers’ Retirement System that enrolls teachers hired on or after January 1, 2022 into a Hybrid (Pension/Guaranteed Return) plan. Current hires will remain enrolled in the state’s traditional pension plan.
The new benefit tier mandates a higher member contribution rate—teachers under this tier will contribute 9% of salary to their pension plan, plus 2% to their guaranteed return plan notional account. Employers pay a fixed, statutory rate of 10.75% of payroll, of which 2% is for contributions to guaranteed return plan accounts. Workers will also have to work 30 years, instead of 27, to claim the maximum retirement benefit.
Additionally, a risk-sharing element of the new tier requires members to make increased contributions to the pension plan if its funded ratio falls below 90%. That means mistakes made by the system, or the legislature overseeing it, could result in smaller paychecks for public workers.
And in Texas, members of the Employees’ Retirement System will be enrolled in a Guaranteed Return Plan as opposed to the traditional defined benefit plan current members have. The system will manage investments and guarantee returns equal 4% annually. Any returns earned above 4% will be split evenly between members and employer accounts, up to a maximum 7% return for members.
How this Affects Public Workers
The creation of new benefit tiers is a common move by legislatures looking to rein in their unfunded liabilities within national pension benefit trends—this was part of the reasoning in Kentucky and Texas. (In Kentucky, the legislature also wanted to cap future liabilities; in Texas, the legislature wanted a retirement plan that would make it easier to recruit workers to state government for a 10-year or less period of time.) Often, these new tiers or plans have higher member contributions and lower cost-of-living adjustments.
This affects the public workers in many ways. Barring an increase in their base pay, future hires can expect smaller paychecks than current public workers because more of their salary will be going to reducing the state’s pension debt. And with lower, or eliminated, cost-of-living adjustments, the retirement benefits those workers do earn are likely to be eroded by inflation.
Inflation protection of benefits is important for ensuring they continue to provide retirement income security as intended.
Pension plans (including hybrids where a portion is a pension benefit) currently provide a range of cost-of-living adjustments, depending on the local rules.
And while most states have linked COLAs to inflation, roughly 1/3 of pension plans do not have automatic COLAs.

Click Here to read the full State of Pensions 2021 report
If you are interested in diving deeper in to benefit trends and adequacy, check out Equable’s Retirement Security Report
Mississippi Pension Laws: Infographic
Mississippi teachers’, public safety officers’, and public workers’ pension benefits are entitled to certain protections under state law and affirmed by court rulings. At the same time, the state does have some legal precedent that allows them to change particular aspects of retirement benefits.
In other words, Mississippi pension laws allow parts of public pension benefits to be changed by future state laws, but only certain parts of those benefits.
Equable Institute partnered with Columbia Law School’s Center for Public Research and Leadership to create infographics that map states’ pension governance. Understanding the legal environment for pension policies can be confusing for both lawmakers and public workers, but illuminating legally permissible policy pathways to improve funding sustainability and ensure adequate retirement income security for states’ workforces is essential.
Understanding Mississippi Pension Laws
In the case of Mississippi, state law allows the legislature to increase employee contribution rates. In 2010, they did just that, increasing the employee contribution rate from 7.25 to 9%.
The legal environment is favorable for this shift – meaning that state law and legal precedent allows for the change to this aspect of pension policy.
The legal environment regarding shifting workers’ vesting periods, benefit calculations, and decreasing cost-of-living adjustments is unfavorable—meaning state law and legal precedent prohibits such changes, but only if there’s an offset to promised benefits.
It is important to note that current retirees’ benefits have greater legal protection than those of active employees. Apart from reduced or eliminated COLAs, current retirees’ benefits cannot be taken away or reduced under Mississippi pension law.
Disclaimer: The information here doesn’t constitute legal advice or representation. Equable is not necessarily recommending any of the policies discussed in the infographic. Some may not work for certain states, others may not be desirable policy. Ultimately, any pension policy change should honor promises made to public workers and put them on a path to retirement security, while ensuring sustainable funding measures.
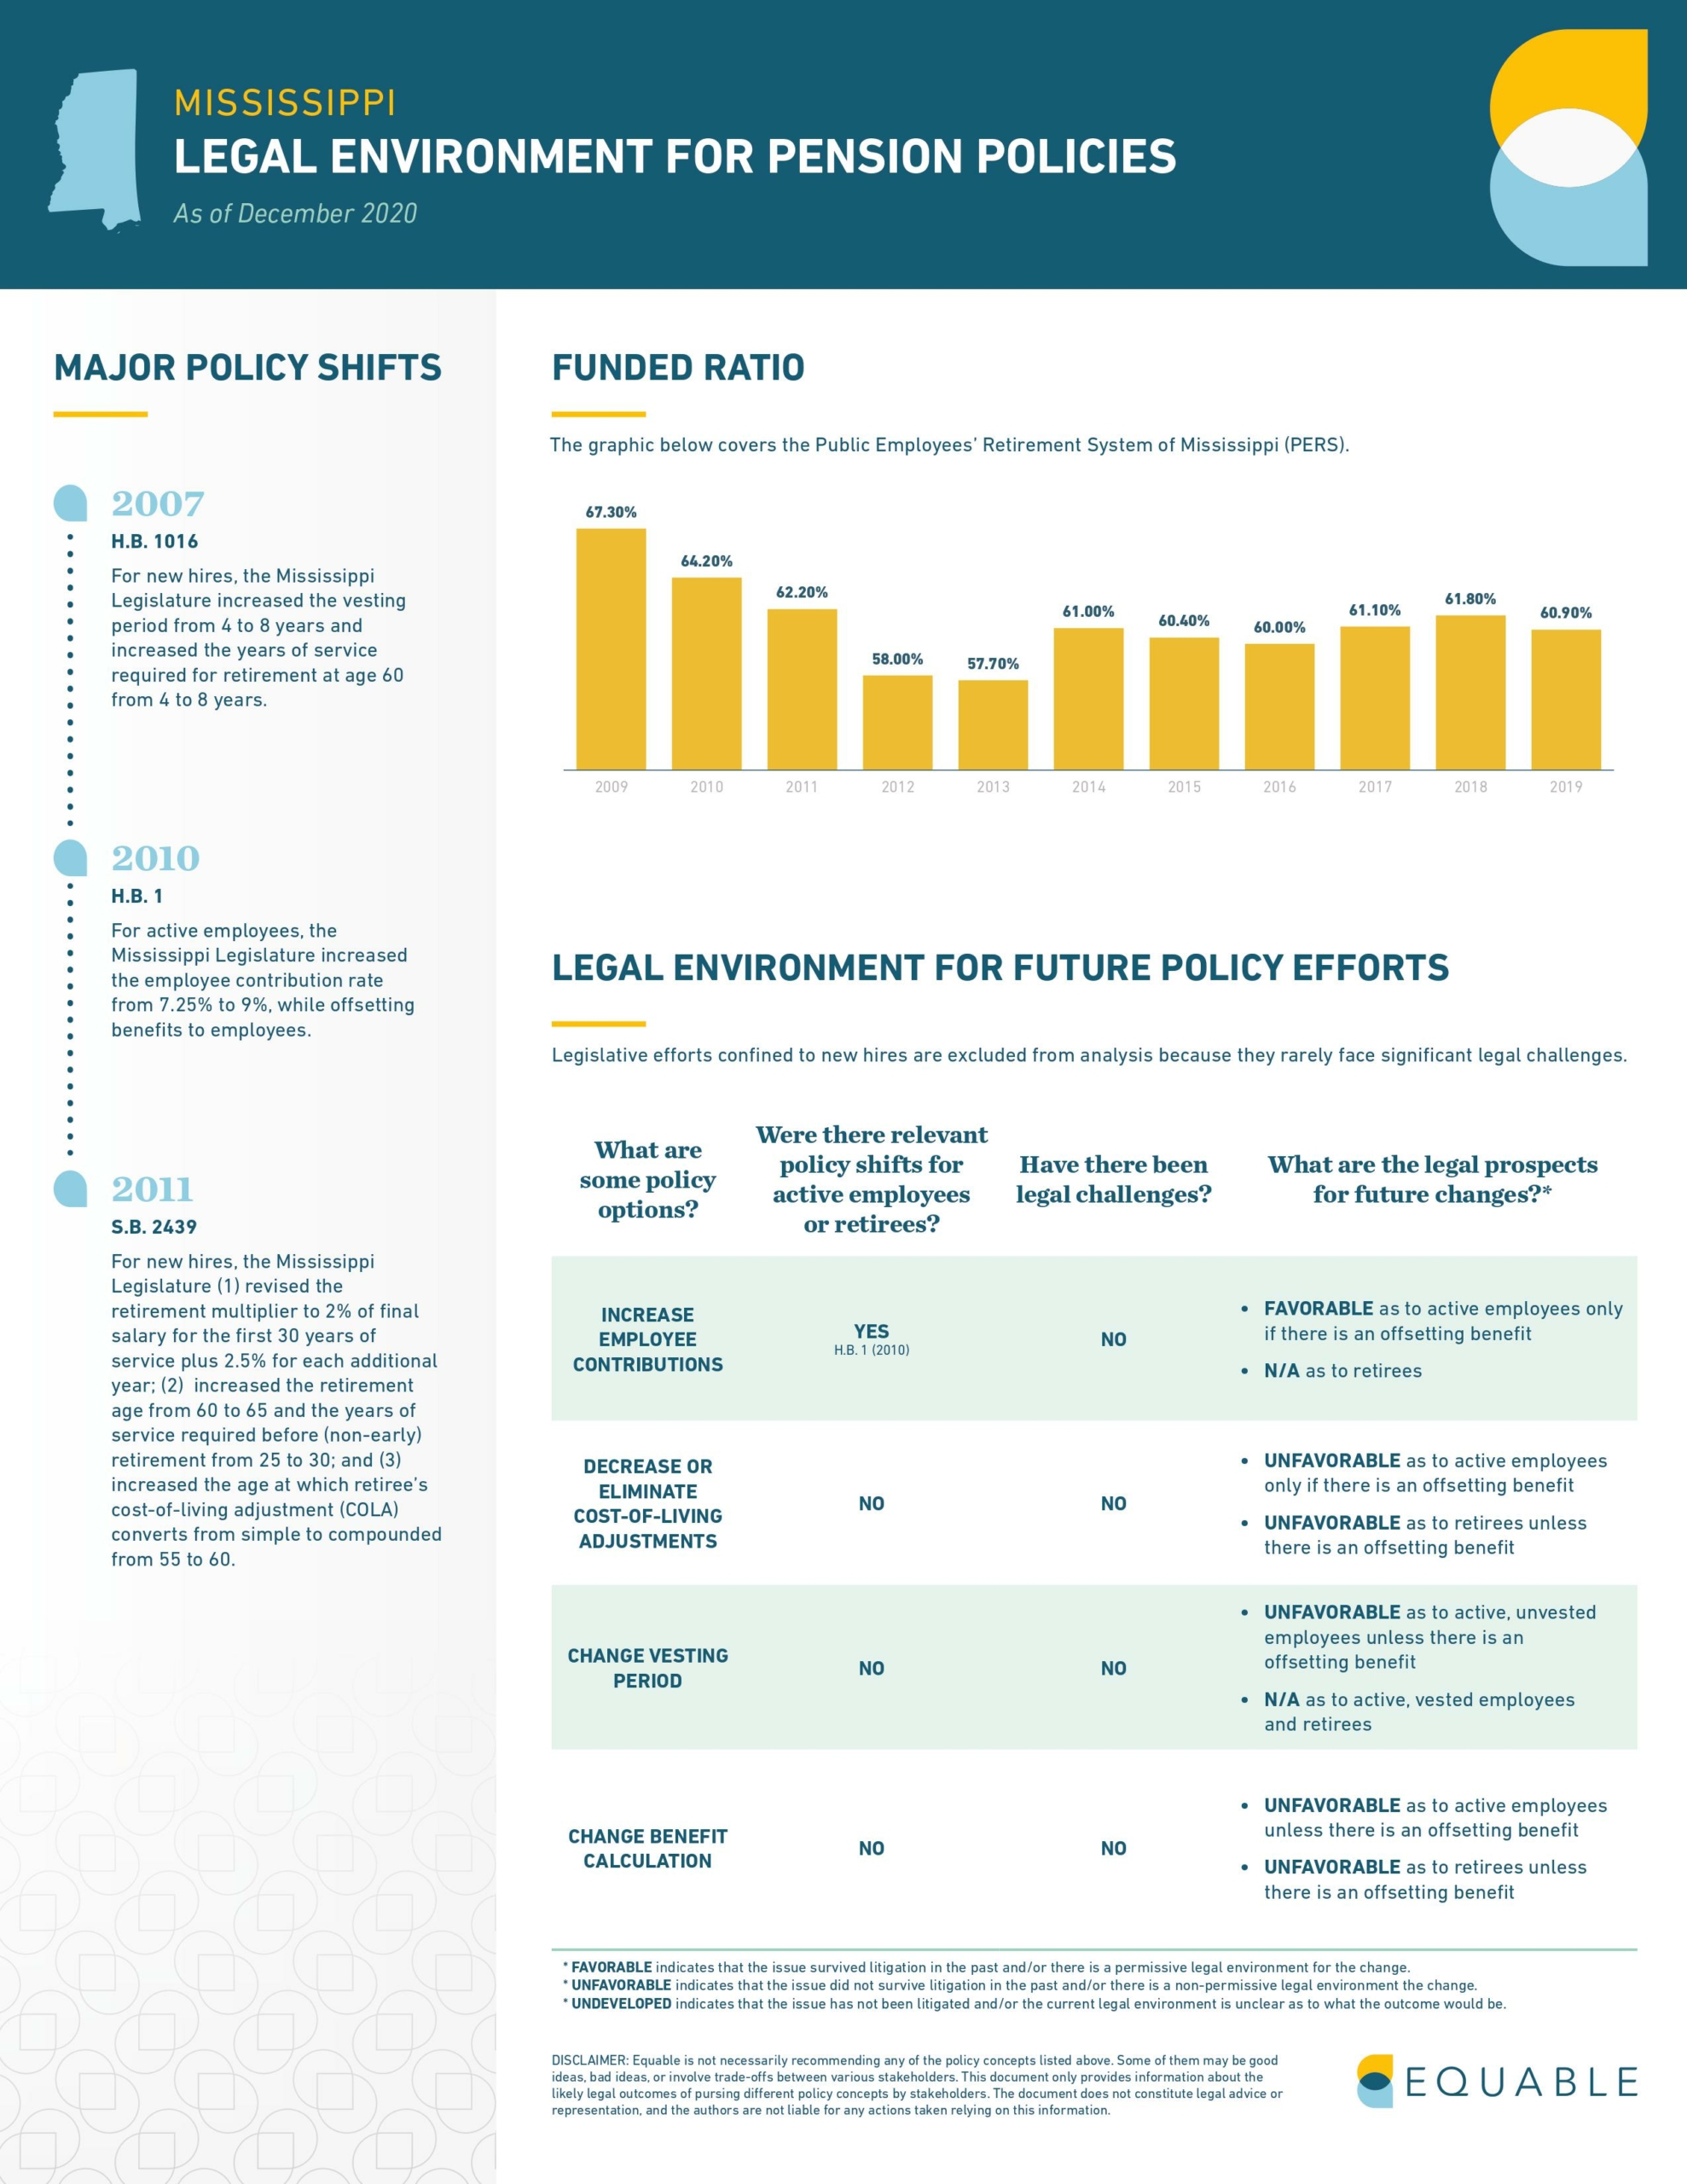
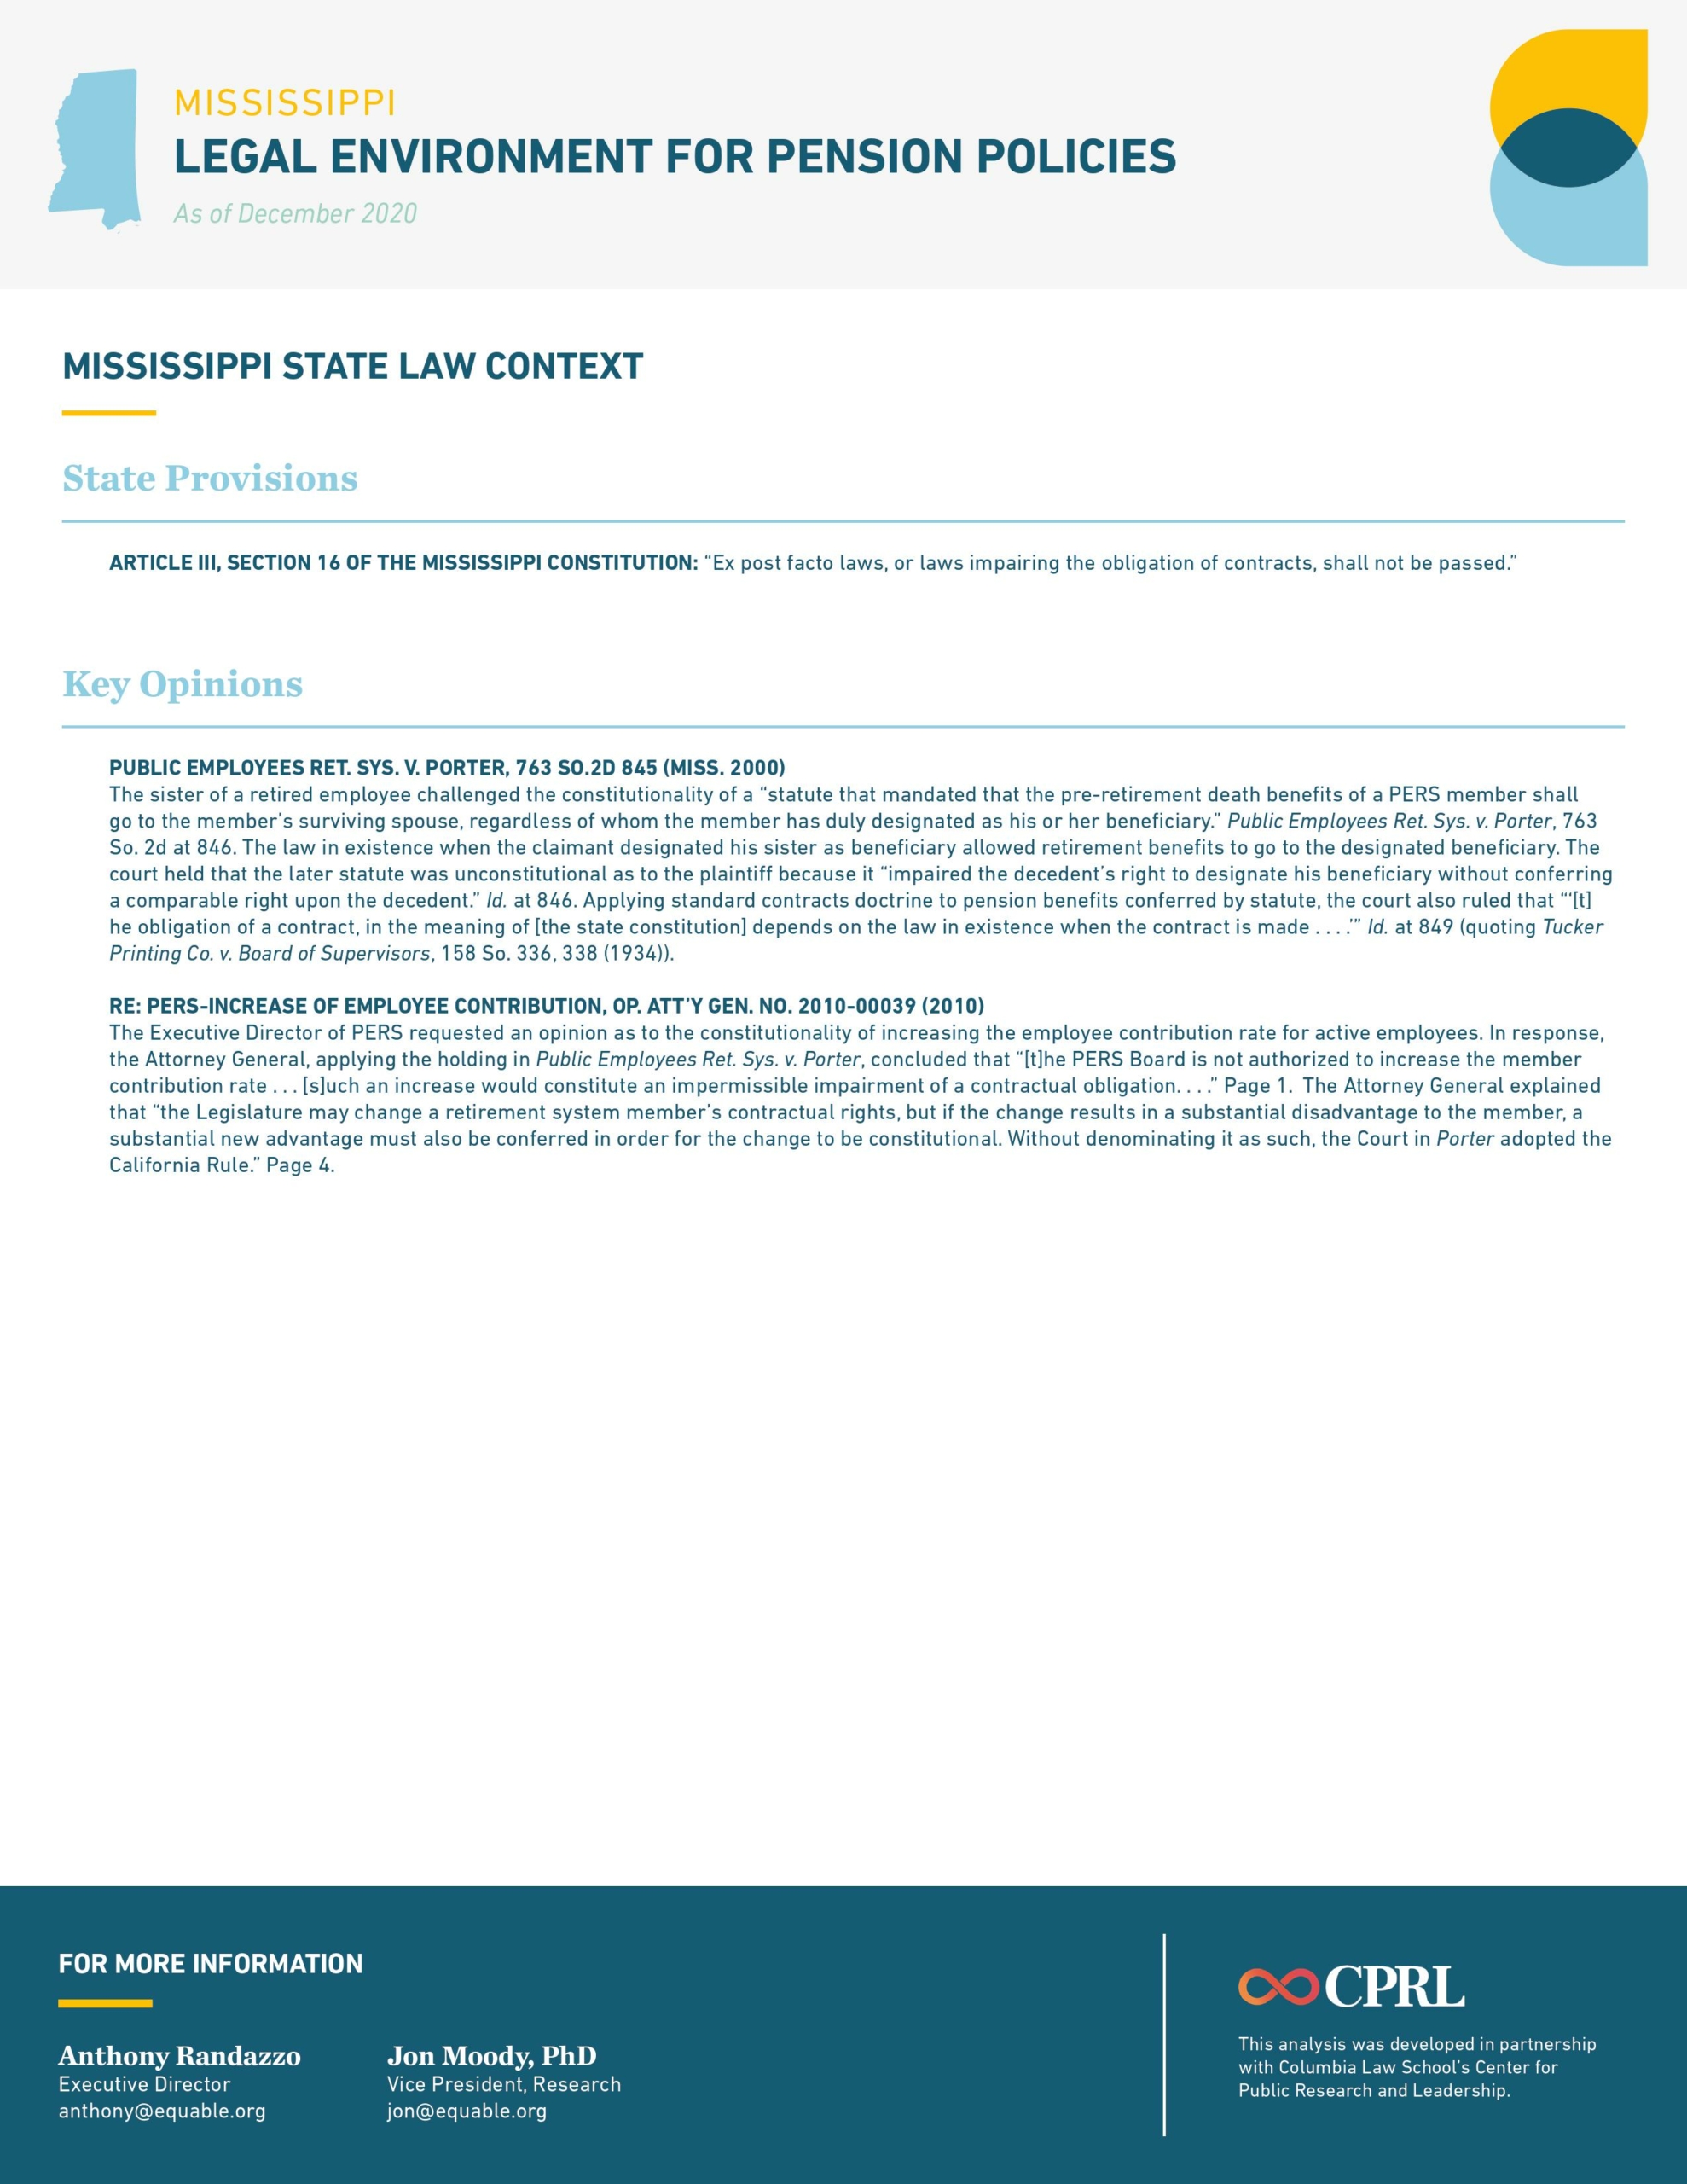
Which States Have Laws that Allow for Police Pension Forfeiture?
Most states have some kind of “pension forfeiture” laws on the books. If a police officer commits a crime in the course of performing their duties, they may be at risk of losing their pension.
These laws usually are related to public employees that are either convicted of, or plead no contest to, a felony or unlawful killing.[1] Only 23 of the state laws cover law enforcement employees, such as police officers.[2] There are three states that might cover police, depending on how they’re interpreted, and 24 states without laws covering police.
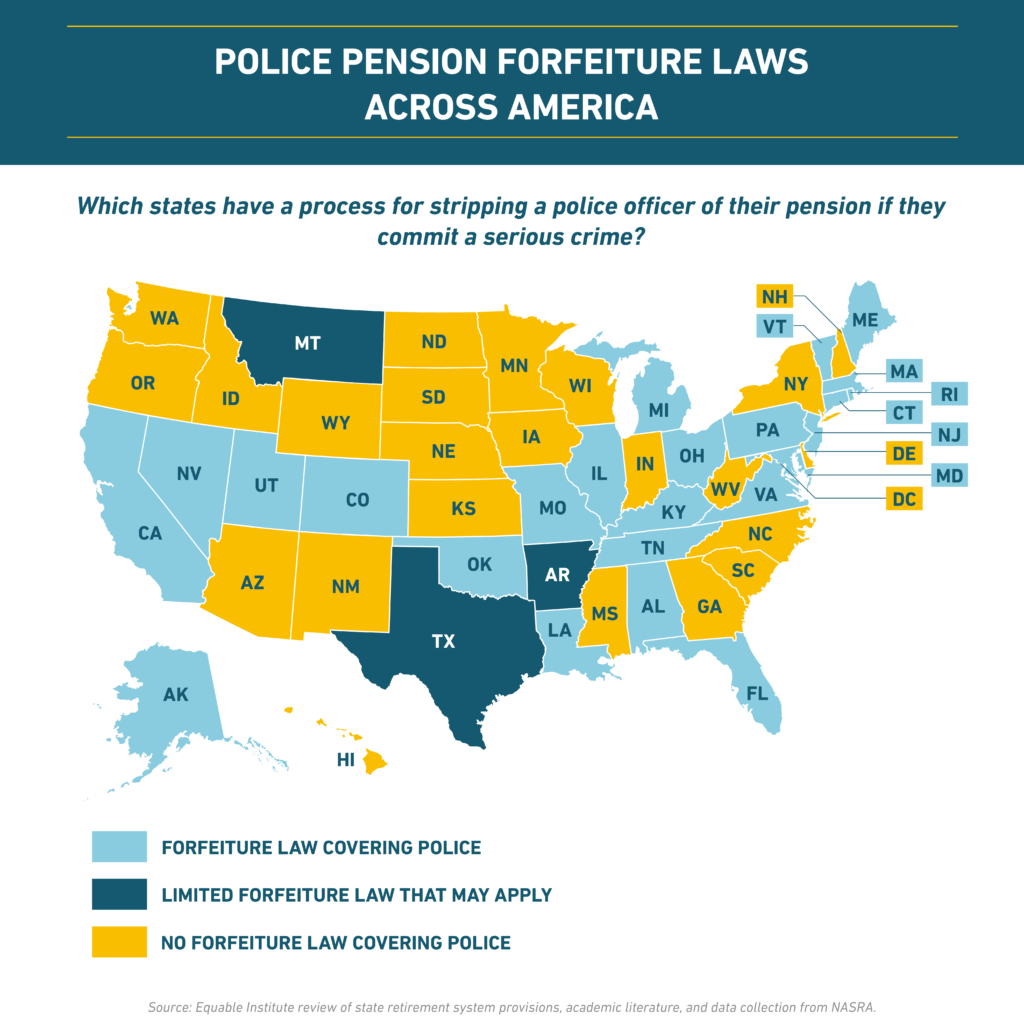
The details about what kind of crimes will lead to pension being stripped from a police officer vary from state to state. Usually the forfeiture law is limited to on-duty offenses, other times it is not. A few states allow for pension benefit reductions rather than taking the whole pension away. And the process for determining whether a pension is to be forfeited isn’t always the same: some states automatically strip pensions from individuals under these circumstances, other states have judges order the pension taken away or require pension boards to hold proceeding to consider taking the right to a pension away.
For complete details, please review the relevant statutes in your state.
If you are interested in learning more about the benefits offered to public safety officers in your state, check out the Retirement Security Report.
Disclaimer: This article and infographic is not intended as legal advice or formal legal analysis.
__________
Notes:
[1] There are seven states with pension forfeiture laws that do not apply to police officers, including: Delaware and Minnesota (laws only applies to surviving beneficiaries who commit an unlawful killing, not active members); Indiana and South Carolina (laws allows for pension benefits to be used as restitution for theft or embezzlement of public property, but does not otherwise require forfeiture for committing a crime); New Mexico and North Carolina (laws allow for pension forfeiture of elected official benefits only); New York (a 2018 law only allows pension forfeiture for elected officials, judges, and gubernatorial appointees)
[2] There are three states with laws that could be interpreted as covering police officers in addition to the 24 listed on the map above. Texas has a pension forfeiture law that only applies to the state Employees’ Retirement System, which does include some state police officers, but does not cover the vast majority of police around the state. Arkansas and Montana have laws that strip the pension of a public employee if they commit an unlawful killing, but only if the person they kill is another public employee.


